

Potential impact of annual vaccination with reformulated COVID-19 vaccines: Lessons from the US COVID-19 scenario modeling hub
- PMID: 38630802
- PMCID: PMC11062554
- DOI: 10.1371/journal.pmed.1004387
Potential impact of annual vaccination with reformulated COVID-19 vaccines: Lessons from the US COVID-19 scenario modeling hub
Abstract
Background: Coronavirus Disease 2019 (COVID-19) continues to cause significant hospitalizations and deaths in the United States. Its continued burden and the impact of annually reformulated vaccines remain unclear. Here, we present projections of COVID-19 hospitalizations and deaths in the United States for the next 2 years under 2 plausible assumptions about immune escape (20% per year and 50% per year) and 3 possible CDC recommendations for the use of annually reformulated vaccines (no recommendation, vaccination for those aged 65 years and over, vaccination for all eligible age groups based on FDA approval).
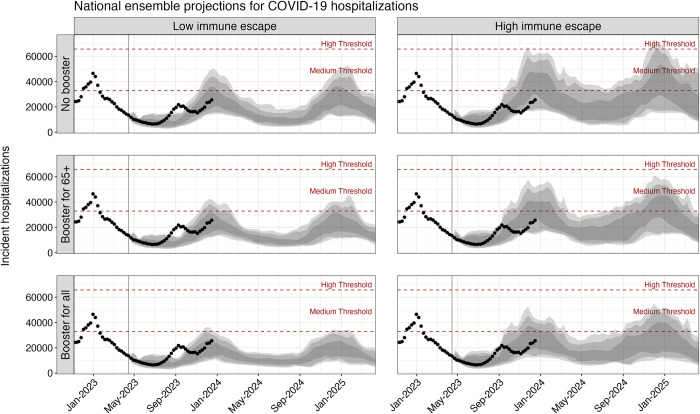
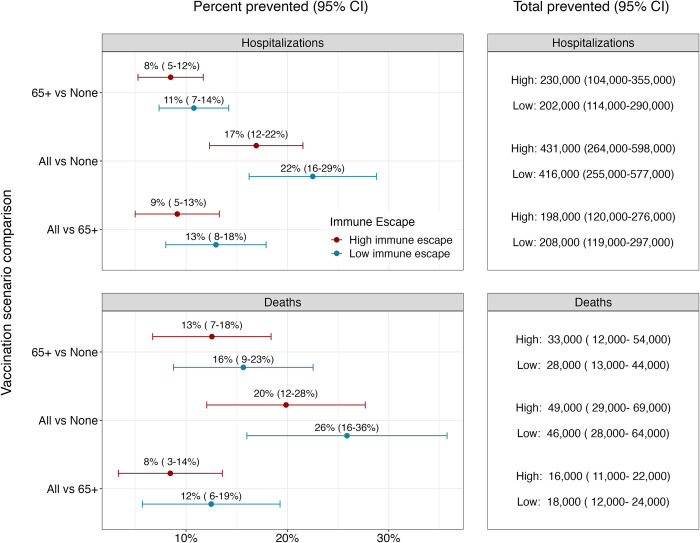
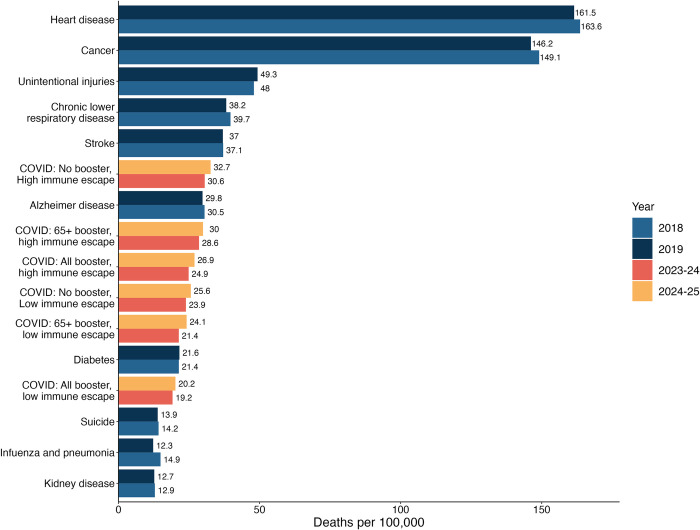
Methods and findings: The COVID-19 Scenario Modeling Hub solicited projections of COVID-19 hospitalization and deaths between April 15, 2023 and April 15, 2025 under 6 scenarios representing the intersection of considered levels of immune escape and vaccination. Annually reformulated vaccines are assumed to be 65% effective against symptomatic infection with strains circulating on June 15 of each year and to become available on September 1. Age- and state-specific coverage in recommended groups was assumed to match that seen for the first (fall 2021) COVID-19 booster. State and national projections from 8 modeling teams were ensembled to produce projections for each scenario and expected reductions in disease outcomes due to vaccination over the projection period. From April 15, 2023 to April 15, 2025, COVID-19 is projected to cause annual epidemics peaking November to January. In the most pessimistic scenario (high immune escape, no vaccination recommendation), we project 2.1 million (90% projection interval (PI) [1,438,000, 4,270,000]) hospitalizations and 209,000 (90% PI [139,000, 461,000]) deaths, exceeding pre-pandemic mortality of influenza and pneumonia. In high immune escape scenarios, vaccination of those aged 65+ results in 230,000 (95% confidence interval (CI) [104,000, 355,000]) fewer hospitalizations and 33,000 (95% CI [12,000, 54,000]) fewer deaths, while vaccination of all eligible individuals results in 431,000 (95% CI: 264,000-598,000) fewer hospitalizations and 49,000 (95% CI [29,000, 69,000]) fewer deaths.
Conclusions: COVID-19 is projected to be a significant public health threat over the coming 2 years. Broad vaccination has the potential to substantially reduce the burden of this disease, saving tens of thousands of lives each year.
Copyright: © 2024 Jung et al. This is an open access article distributed under the terms of the Creative Commons Attribution License, which permits unrestricted use, distribution, and reproduction in any medium, provided the original author and source are credited.
Conflict of interest statement
JE is president of General Biodefense LLC, a private consulting group for public health informatics, and has interest in READE.ai, a medical artificial intelligence solutions company. MR reports stock ownership in Becton Dickinson & Co., which manufactures medical equipment used in COVID-19 testing, vaccination, and treatment. JL has served as an expert witness on cases where the likely length of the pandemic was of issue. The remaining authors declare no competing interests.
Figures
Update of
-
Potential impact of annual vaccination with reformulated COVID-19 vaccines: lessons from the U.S. COVID-19 Scenario Modeling Hub.medRxiv [Preprint]. 2023 Nov 18:2023.10.26.23297581. doi: 10.1101/2023.10.26.23297581. medRxiv. 2023. Update in: PLoS Med. 2024 Apr 17;21(4):e1004387. doi: 10.1371/journal.pmed.1004387. PMID: 37961207 Free PMC article. Updated. Preprint.
References
-
- Bobrovitz N, Ware H, Ma X, Li Z, Hosseini R, Cao C, et al. Protective effectiveness of previous SARS-CoV-2 infection and hybrid immunity against the omicron variant and severe disease: a systematic review and meta-regression. Lancet Infect Dis. 2023;23:556–567. doi: 10.1016/S1473-3099(22)00801-5 - DOI - PMC - PubMed
-
- Gavenčiak T, Monrad JT, Leech G, Sharma M, Mindermann S, Bhatt S, et al. Seasonal variation in SARS-CoV-2 transmission in temperate climates: A Bayesian modelling study in 143 European regions. Struchiner CJ, editor. PLoS Comput Biol. 2022;18:e1010435. doi: 10.1371/journal.pcbi.1010435 - DOI - PMC - PubMed
Publication types
MeSH terms
Substances
Grants and funding
LinkOut - more resources
Full Text Sources
Medical
Research Materials
Miscellaneous
