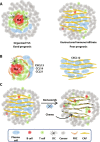
Spatiotemporal architecture of immune cells and cancer-associated fibroblasts in high-grade serous ovarian carcinoma
- PMID: 38630822
- PMCID: PMC11023532
- DOI: 10.1126/sciadv.adk8805
Spatiotemporal architecture of immune cells and cancer-associated fibroblasts in high-grade serous ovarian carcinoma
Abstract
High-grade serous ovarian carcinoma (HGSOC), the deadliest form of ovarian cancer, is typically diagnosed after it has metastasized and often relapses after standard-of-care platinum-based chemotherapy, likely due to advanced tumor stage, heterogeneity, and immune evasion and tumor-promoting signaling from the tumor microenvironment. To understand how spatial heterogeneity contributes to HGSOC progression and early relapse, we profiled an HGSOC tissue microarray of patient-matched longitudinal samples from 42 patients. We found spatial patterns associated with early relapse, including changes in T cell localization, malformed tertiary lymphoid structure (TLS)-like aggregates, and increased podoplanin-positive cancer-associated fibroblasts (CAFs). Using spatial features to compartmentalize the tissue, we found that plasma cells distribute in two different compartments associated with TLS-like aggregates and CAFs, and these distinct microenvironments may account for the conflicting reports about the role of plasma cells in HGSOC prognosis.
Figures


Similar articles
-
The activity of tertiary lymphoid structures in high grade serous ovarian cancer is governed by site, stroma, and cellular interactions.Cancer Cell. 2024 Nov 11;42(11):1864-1881.e5. doi: 10.1016/j.ccell.2024.09.007. Epub 2024 Oct 10. Cancer Cell. 2024. PMID: 39393357 Free PMC article.
-
High tumor expression of CTLA4 identifies lymph node-negative basal-like breast cancer patients with excellent prognosis.Commun Med (Lond). 2025 Jun 16;5(1):234. doi: 10.1038/s43856-025-00865-z. Commun Med (Lond). 2025. PMID: 40523912 Free PMC article.
-
[Joint analysis of invasive margins and tumor center to evaluate the prognostic value of bystander CD8+ T cells in early-stage non-small cell lung cancer].Zhonghua Zhong Liu Za Zhi. 2025 Jun 23;47(6):508-516. doi: 10.3760/cma.j.cn112152-20240805-00326. Zhonghua Zhong Liu Za Zhi. 2025. PMID: 40534266 Chinese.
-
Assessing the comparative effects of interventions in COPD: a tutorial on network meta-analysis for clinicians.Respir Res. 2024 Dec 21;25(1):438. doi: 10.1186/s12931-024-03056-x. Respir Res. 2024. PMID: 39709425 Free PMC article. Review.
-
Prevalence and odds of anxiety and depression in cutaneous malignant melanoma: a proportional meta-analysis and regression.Br J Dermatol. 2024 Jun 20;191(1):24-35. doi: 10.1093/bjd/ljae011. Br J Dermatol. 2024. PMID: 38197404
Cited by
-
Phospho-RPA2 predicts response to platinum and PARP inhibitors in homologous recombination-proficient ovarian cancer.J Clin Invest. 2025 May 20;135(13):e189511. doi: 10.1172/JCI189511. eCollection 2025 Jul 1. J Clin Invest. 2025. PMID: 40392598 Free PMC article.
-
Tumor-Infiltrating Lymphocytes in Breast and Female Genital Tract Cancers: Overlooked Potential and Unexplored Frontiers.Cancer Med. 2025 Jul;14(13):e71023. doi: 10.1002/cam4.71023. Cancer Med. 2025. PMID: 40621806 Free PMC article. Review.
-
Immunomodulatory role of RNA modifications in sex hormone-dependent cancers.Front Immunol. 2025 May 8;16:1513037. doi: 10.3389/fimmu.2025.1513037. eCollection 2025. Front Immunol. 2025. PMID: 40406121 Free PMC article. Review.
-
Spatial oncology: Translating contextual biology to the clinic.Cancer Cell. 2024 Oct 14;42(10):1653-1675. doi: 10.1016/j.ccell.2024.09.001. Epub 2024 Oct 3. Cancer Cell. 2024. PMID: 39366372 Review.
-
Advances in nanotechnology for targeting cancer-associated fibroblasts: A review of multi-strategy drug delivery and preclinical insights.APL Bioeng. 2025 Mar 13;9(1):011502. doi: 10.1063/5.0244706. eCollection 2025 Mar. APL Bioeng. 2025. PMID: 40094065 Free PMC article. Review.
References
-
- Bowtell D. D., Bohm S., Ahmed A. A., Aspuria P. J., Bast R. C. Jr., Beral V., Berek J. S., Birrer M. J., Blagden S., Bookman M. A., Brenton J. D., Chiappinelli K. B., Martins F. C., Coukos G., Drapkin R., Edmondson R., Fotopoulou C., Gabra H., Galon J., Gourley C., Heong V., Huntsman D. G., Iwanicki M., Karlan B. Y., Kaye A., Lengyel E., Levine D. A., Lu K. H., McNeish I. A., Menon U., Narod S. A., Nelson B. H., Nephew K. P., Pharoah P., Powell D. J. Jr., Ramos P., Romero I. L., Scott C. L., Sood A. K., Stronach E. A., Balkwill F. R., Rethinking ovarian cancer II: Reducing mortality from high-grade serous ovarian cancer. Nat. Rev. Cancer 15, 668–679 (2015). - PMC - PubMed
-
- Kraman M., Bambrough P. J., Arnold J. N., Roberts E. W., Magiera L., Jones J. O., Gopinathan A., Tuveson D. A., Fearon D. T., Suppression of antitumor immunity by stromal cells expressing fibroblast activation protein-α. Science 330, 827–830 (2010). - PubMed
-
- Feig C., Jones J. O., Kraman M., Wells R. J. B., Deonarine A., Chan D. S., Connell C. M., Roberts E. W., Zhao Q., Caballero O. L., Teichmann S. A., Janowitz T., Jodrell D. I., Tuveson D. A., Fearon D. T., Targeting CXCL12 from FAP-expressing carcinoma-associated fibroblasts synergizes with anti-PD-L1 immunotherapy in pancreatic cancer. Proc. Natl. Acad. Sci. U.S.A. 110, 20212–20217 (2013). - PMC - PubMed
-
- Cremasco V., Astarita J. L., Grauel A. L., Keerthivasan S., MacIsaac K., Woodruff M. C., Wu M., Spel L., Santoro S., Amoozgar Z., Laszewski T., Migoni S. C., Knoblich K., Fletcher A. L., LaFleur M., Wucherpfennig K. W., Pure E., Dranoff G., Carroll M. C., Turley S. J., FAP delineates heterogeneous and functionally divergent stromal cells in immune-excluded breast tumors. Cancer Immunol. Res. 6, 1472–1485 (2018). - PMC - PubMed
-
- Tejchman A., Lamerant-Fayel N., Jacquinet J. C., Bielawska-Pohl A., Mleczko-Sanecka K., Grillon C., Chouaib S., Ugorski M., Kieda C., Tumor hypoxia modulates podoplanin/CCL21 interactions in CCR7+ NK cell recruitment and CCR7+ tumor cell mobilization. Oncotarget 8, 31876–31887 (2017). - PMC - PubMed

