. 2024 Apr 17;16(743):eadi0077.
doi: 10.1126/scitranslmed.adi0077. Epub 2024 Apr 17.

Placental senescence pathophysiology is shared between peripartum cardiomyopathy and preeclampsia in mouse and human

Collaborators, Affiliations

Placental senescence pathophysiology is shared between peripartum cardiomyopathy and preeclampsia in mouse and human

Jason D Roh et al. Sci Transl Med. .

Abstract

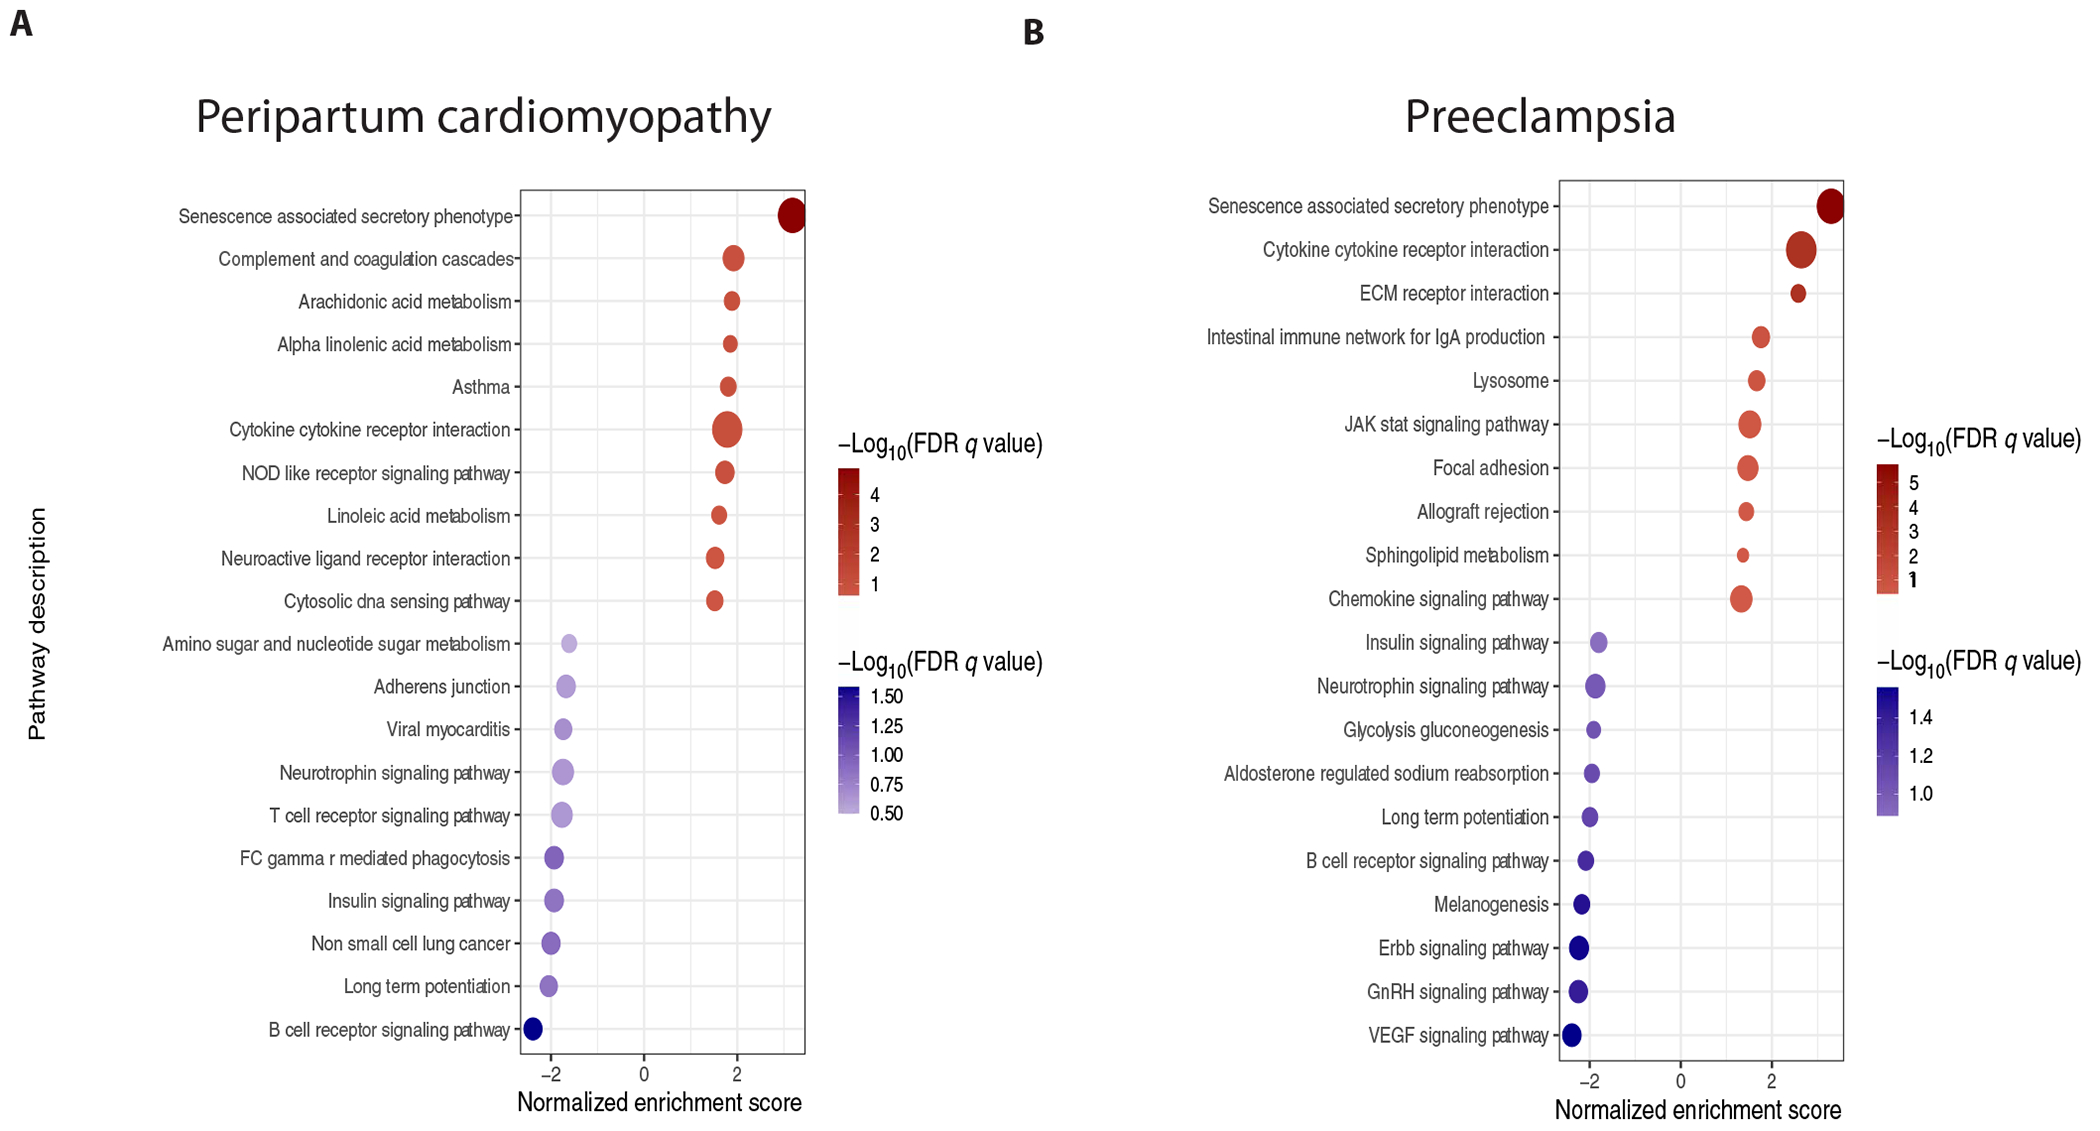
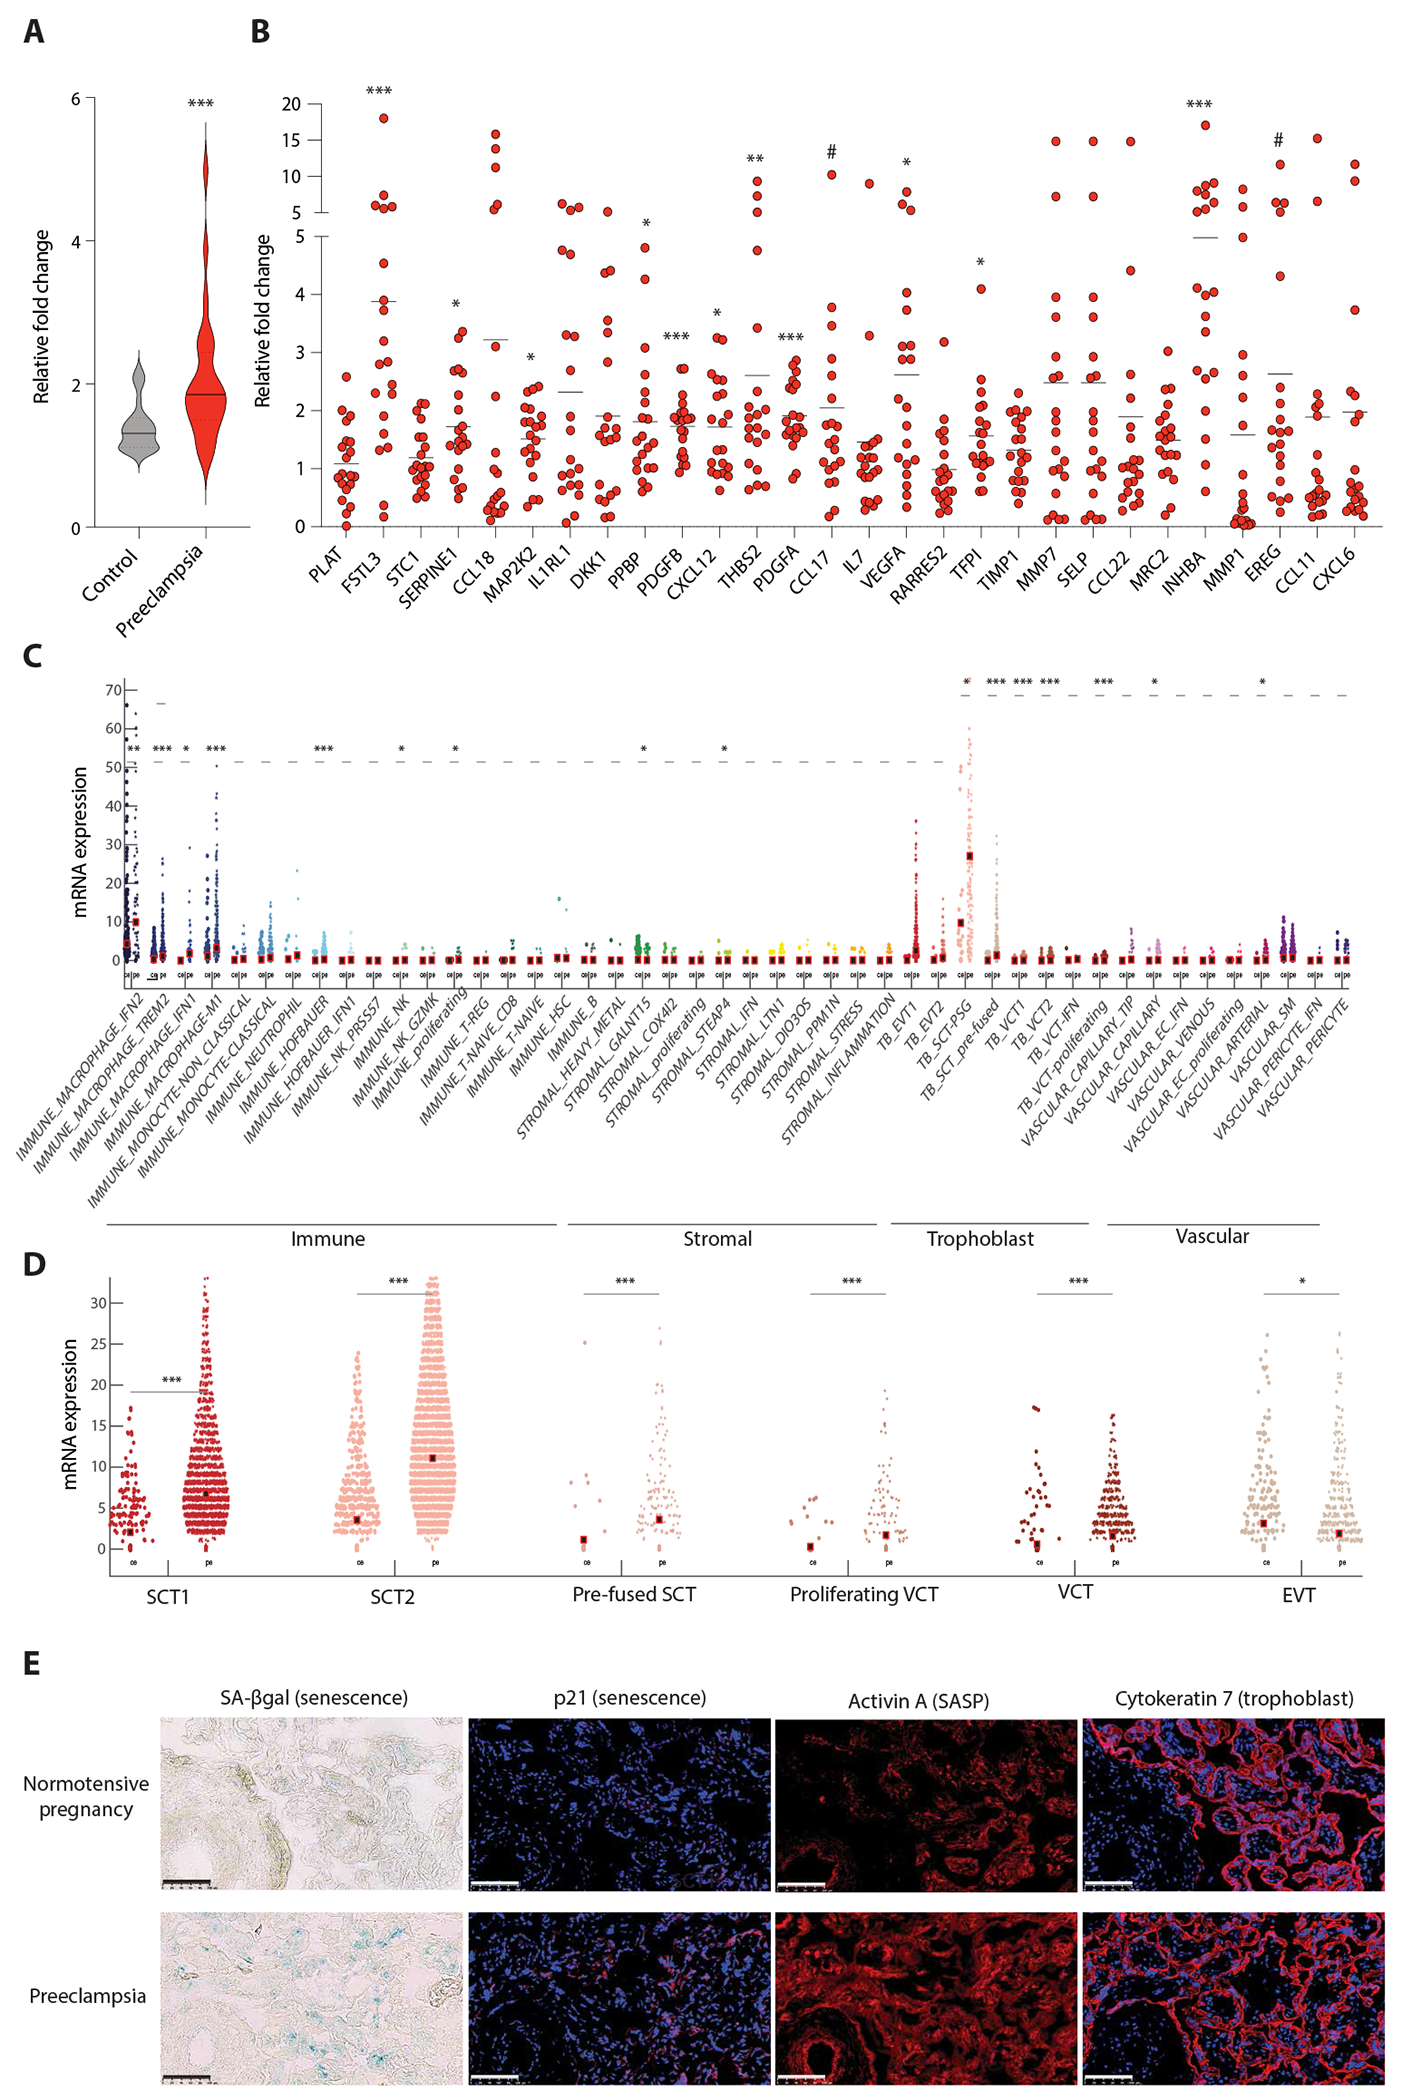
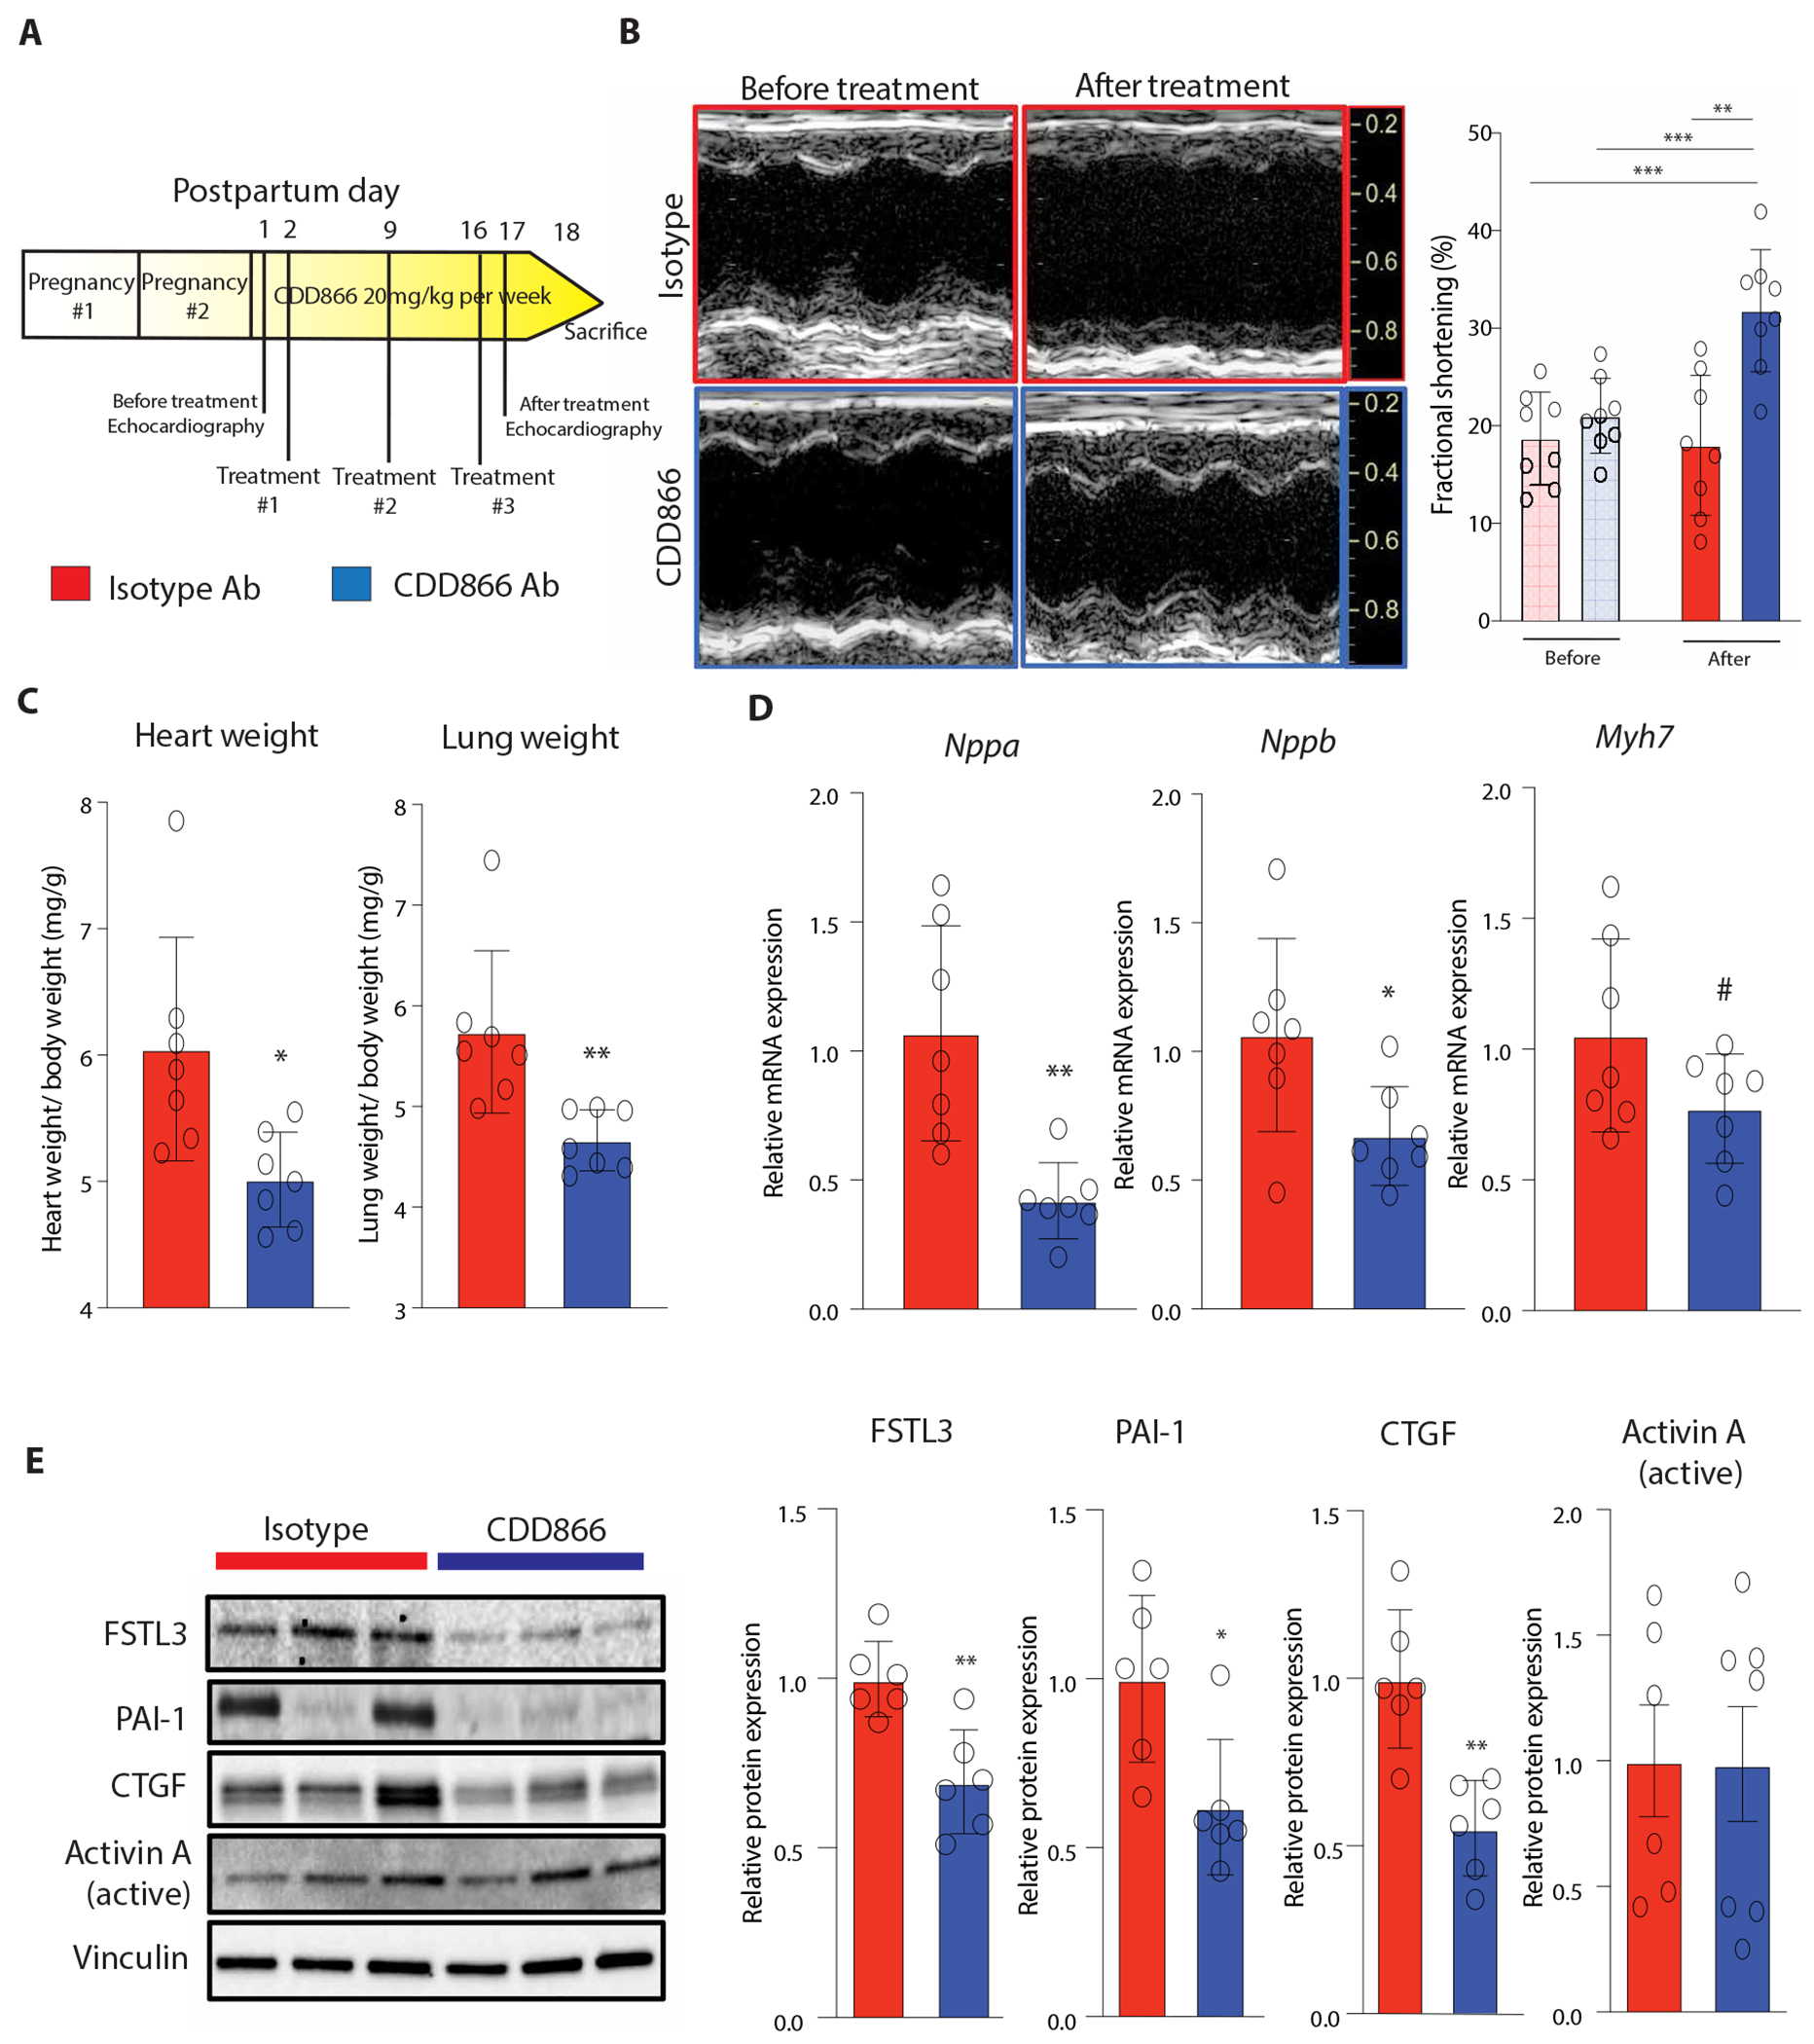
Peripartum cardiomyopathy (PPCM) is an idiopathic form of pregnancy-induced heart failure associated with preeclampsia. Circulating factors in late pregnancy are thought to contribute to both diseases, suggesting a common underlying pathophysiological process. However, what drives this process remains unclear. Using serum proteomics, we identified the senescence-associated secretory phenotype (SASP), a marker of cellular senescence associated with biological aging, as the most highly up-regulated pathway in young women with PPCM or preeclampsia. Placentas from women with preeclampsia displayed multiple markers of amplified senescence and tissue aging, as well as overall increased gene expression of 28 circulating proteins that contributed to SASP pathway enrichment in serum samples from patients with preeclampsia or PPCM. The most highly expressed placental SASP factor, activin A, was associated with cardiac dysfunction or heart failure severity in women with preeclampsia or PPCM. In a murine model of PPCM induced by cardiomyocyte-specific deletion of the gene encoding peroxisome proliferator-activated receptor γ coactivator-1α, inhibiting activin A signaling in the early postpartum period with a monoclonal antibody to the activin type II receptor improved heart function. In addition, attenuating placental senescence with the senolytic compound fisetin in late pregnancy improved cardiac function in these animals. These findings link senescence biology to cardiac dysfunction in pregnancy and help to elucidate the pathogenesis underlying cardiovascular diseases of pregnancy.


Conflict of interest statement

J.D.R. and A.R. are coinventors on patents (WO-2018175460-A1; Methods for Preventing and Treating Heart Disease and 11834508; Method of treating structural and/or functional cardiac abnormalities by administering an anti-ActRII receptor antibody). J.D.R. reports research support from Amgen, Keros, and Genentech. A.R. reports consulting fees from Keros and Versanis as well as serving as a scientific cofounder and equity owner of Thryv Therapeutics. M.C.H. reports research support from Genentech, consulting fees from CRISPR Therapeutics, and advisory board service for Miga Health. S.R. reports serving as a consultant to Roche and Thermo Fisher Scientific and has received funding from Roche and Siemens for studies related to the use of angiogenic factors in pregnancy, which is unrelated to the present work. J.B. reports research support from Zoll, CVRx, Abiomed, Norgine, and Roche and honoraria for lectures/consulting from Novartis, Vifor, Bayer, Pfizer, Boehringer Ingelheim, AstraZeneca, Cardior, CVRx, BMS, Amgen, Corvia, Norgine, Edwards, and Roche. P.T.E. reports research support from Bayer AG, Novo-Nordisk, Bristol Myers Squibb and Pfizer and has served on advisory boards or consulted for Bayer AG and MyoKardia. K.J.G. has served as a consultant to Illumina, Aetion, Roche, and BillionToOne. S.A.K. reports research support from Thermo Fisher Scientific, Roche, Siemens, and Beckman Coulter and serves as a consultant for Thermo Fisher Scientific, Roche, and Siemens. S.A.K. has financial interest in Aggamin Pharmaceuticals and Comanche Biopharma and has multiple patents on angiogenic biomarkers that have been outlicensed to multiple companies. All reported research support and consulting are unrelated to this work.

Figures

Fig. 1.
Fig. 1.. Senescence-associated secretory phenotype enrichment in PPCM and preeclampsia.
Pathway analysis on SOMAscan serum proteomic profiles from (A) women with PPCM (n = 13) versus healthy pregnant controls (n = 10) and (B) women with preeclampsia (n = 11) versus normotensive pregnant controls (n = 11). Gene set enrichment analysis using SASP protein set and KEGG pathway database. Only significant pathways [false discovery rate (FDR) <0.25] are displayed.
Fig. 2.
Fig. 2.. Activin A is a dominant placental SASP protein in preeclampsia.
(A) Violin plot of the composite fold change in relative gene expression of the 28 SASP proteins in placental tissue from preeclamptic versus normotensive pregnancy. n = 20 per group. Solid line is median. Dashed line is quartiles. Mann-Whitney test. P = 0.0004. (B) Relative gene expression of individual SASP proteins. Mean fold change (black bar) and individual data points from the 20 individuals with preeclampsia are displayed. See table S2 for individual data. Student’s t test or Mann-Whitney test. #P ≤ 0.1, *P < 0.05, **P < 0.01, ***P < 0.001. (C) Violin plot of gene expression of INHBA (gene encoding activin A) from placental scRNAseq of early preeclampsia (pe, n = 10) versus uncomplicated preterm delivery (ce, n = 3). Wilcoxon or Mann-Whitney rank sum test. *P < 0.01, **P < 0.001, ***P < 0.0001. (D) Violin plot of INHBA expression from snRNAseq from five distinct trophoblast subtypes (SCT, syncytiotrophoblast; VCT, villous cytotrophoblast; EVT, extravillous trophoblast). Wilcoxon or Mann-Whitney rank sum test. *P < 0.01, **P < 0.001, ***P < 0.0001. Analysis for (C) and (D) was done on datasets acquired by Admati and colleagues (27). Dots represent single cells (c) or single nuclei (D). Black square is mean. (E) SA-βgal (blue, senescence) and immunofluorescence images of p21 (senescence), activin A (SASP), and cytokeratin-7 (trophoblast) in placenta from a patient with preeclampsia versus a patient with normotensive pregnancy. Scale bar, 100 μm. Blue, DAPI (nuclei); red, target antigen.
Fig. 3.
Fig. 3.. Association of SASP protein, activin A, with cardiac dysfunction and HF severity in human preeclampsia and PPCM.
(A) Violin plot of third trimester serum activin A concentration in women with preeclampsia (n = 21), compared with maternal- and gestational-age–matched individuals with gestational hypertension (n = 19) or normotensive pregnancy (n = 18). Bold line is median. Dashed line is quartile. See table S3 for individual data. Pairwise comparisons with Wilcoxon rank sum test. Normotensive control versus gestational hypertension (P = 0.01), normotensive control versus preeclampsia (P < 0.001). (B) Violin plot of postpartum serum activin A concentration in women with PPCM (n = 82) compared with matched healthy pregnant (n = 8), healthy nonpregnant (n = 11), and nonpregnant nonischemic cardiomyopathy (NICM; n = 13) controls. See table S4 for individual data. Pairwise comparisons with Wilcoxon rank sum test. Healthy pregnant versus PPCM (P < 0.001), healthy nonpregnant versus PPCM (P < 0.001), and NiCM versus PPCM (P = 0.08). (C) Cardiac gene expression of downstream activin A targets in individuals with severe PPCM (n = 3) versus control individuals without HF (n = 13). Bar graphs show means ± SD with individual data points displayed. Mann-Whitney or Student’s t test. FSTL3 (P = 0.005), SERPINE1 (P = 0.04), CCN2 (P = 0.0009). (D and E) Pearson correlations of serum activin A with left ventricle (LV) systolic function metrics. Global longitudinal strain (GLS) in the preeclampsia cohort (n = 57), r = 0.6, P < 0.001 (D), and PPCM cohort (n = 94), r = 0.5, P < 0.001 (E), cohorts. More negative GLS indicates better systolic function. Correlation of LV ejection fraction in PPCM cohort (n = 111), r = −0.5; P < 0.001 (E). (F) Association of serum activin A with HF severity metrics in patients with PPCM. Brain natriuretic protein (BNP), Pearson correlation, r = 0.3; P = 0.04, n = 46. New York Heart Association (NYHA) functional class, (I, n = 11; II, n = 35; III, n = 23; IV, n = 13), displayed as violin plot (bold line, median; dashed line, quartiles). One-way analysis of variance (ANOVA) with post hoc Tukey’s test. #P ≤ 0.1, *P < 0.05, **P < 0.01, ***P < 0.001.
Fig. 4.
Fig. 4.. Fisetin attenuates placental senescence and activin A expression in a mouse model of PPCM.
During their first pregnancy, PGC1α KO mice were treated with the senolytic fisetin (20 mg/kg per day) versus DMSO vehicle from gestational day 13 (GD13) to GD17. n = 6 per group. Pregnant floxed (fl/fl) littermate controls (n = 7) treated with DMSO vehicle from GD13 to GD17 were also included to assess for placental differences between healthy and PPCM mice. (A) Representative Western blot images and quantification of senescence markers (p16, p21, and p53) and activin family SASP proteins (activin A, FSTL3, and PAI-1) in placental tissue at GD18. Protein amounts normalized to vinculin. One-way ANOVA with post hoc Tukey’s test. #P ≤ 0.1, *P < 0.05, **P < 0.01, ***P < 0.001. (B) Representative images of SA-βgal and immunofluorescence stains of trophoblast (cytokeratin 7) and stromal cell (vimentin) markers in placental tissue at GD18. Placental decidua (D), labyrinth (L), and junctional zone (J) displayed. Scale bar, 100 μm. For SA-βgal: blue, senescence. For immunofluorescence: blue, DAPi (nuclei); red, target antigen. (C) Relative quantification of SA-βgal intensity per total placenta area or specific anatomical areas. One-way ANOVA with post hoc Tukey’s test. #P ≤ 0.1, *P < 0.05, **P < 0.01. Bar graphs show means ± SD with individual data points displayed.
Fig. 5.
Fig. 5.. Fisetin partially rescues cardiac dysfunction in a mouse model of PPCM.
(A) Schematic of fisetin treatment study in PGC1α KO mice during their first pregnancy. DMSO = vehicle control. n = 6 per group. (B) Representative echocardiography images of the LV before treatment and after treatment. Quantification of LV FS (metric of systolic function). Two-way ANOVA with post hoc Šidák’s test. Posttreatment LV FS, DMSO versus fisetin, P = 0.009. (C) Heart and lung weights normalized to body weight. Student’s t test. Lung weight to body weight, P = 0.09. (D) Pathologic gene expression profile in cardiac tissue. Student’s t test. Nppa (P = 0.04) and Myh7 (P = 0.06). (E) Representative Western blot images and quantification of activin A and ActRii downstream targets (FSTL3, PAI-1, and CTGF) in cardiac tissue at GD18. Student’s t test. FSTL3 (P = 0.07), CTGF (P = 0.008), activin A (P = 0.02). Bar graphs show means ± SD with individual data points displayed. #P ≤ 0.1, *P < 0.05, **P < 0.01, ***P < 0.001.
Fig. 6.
Fig. 6.. Postpartum activin type II receptor inhibition improves cardiac dysfunction in severe PPCM.
(A) Schematic of CDD866 treatment study. PGC1α KO mice were subjected to two serial pregnancies to induce severe PPCM, after which they were treated with weekly injections of CDD866 (ActRIIA/B blocking Ab) versus isotype control Ab for 2 weeks (n = 8 per group). One mouse died in each group before the final time point for tissue collection. (B) Representative echocardiography images and quantification of LV FS before and after treatment. Two-way ANOVA with post hoc Šidák’s test. **P < 0.01, ***P < 0.001. (C) Heart and lung weights normalized to body weight. Student’s t test used for heart weight (P = 0.01). Mann-Whitney test used for lung weight (P = 0.001). (D) Pathologic gene expression profile in hearts. Student’s t test. Nppa (P = 0.002), Nppb (P = 0.03), and Myh7 (P = 0.1). (E) Representative Western blot images and quantification of activin A and downstream ActRII targets. Student’s t test or Mann-Whitney test. FSTL3 (P = 0.003), PAI-1 (P = 0.02), and CTGF (P = 0.001). Bar graphs show means ± SD with individual data points displayed. #P ≤ 0.1, *P < 0.05, **P < 0.01, ***P < 0.001.

Similar articles

Cited by

References

    1. Say L, Chou D, Gemmill A, Tuncalp O, Moller AB, Daniels J, Gulmezoglu AM, Temmerman M, Alkema L, Global causes of maternal death: A WHO systematic analysis. Lancet Glob. Health 2, e323–e333 (2014). - PubMed
    1. Mehta LS, Warnes CA, Bradley E, Burton T, Economy K, Mehran R, Safdar B, Sharma G, Wood M, Valente AM, Volgman AS, American Heart Association Council on Clinical Cardiology, Council on Arteriosclerosis, Thrombosis and Vascular Biology, Council on Cardiovascular and Stroke Nursing; and Stroke Council, Cardiovascular Considerations in Caring for Pregnant Patients: A Scientific Statement From the American Heart Association. Circulation 141, e884–e903 (2020). - PubMed
    1. Hoes MF, Arany Z, Bauersachs J, Hilfiker-Kleiner D, Petrie MC, Sliwa K, van der Meer P, Pathophysiology and risk factors of peripartum cardiomyopathy. Nat. Rev. Cardiol 19, 555–565 (2022). - PubMed
    1. Demakis JG, Rahimtoola SH, Peripartum cardiomyopathy. Circulation 44, 964–968 (1971). - PubMed
    1. Hilfiker-Kleiner D, Kaminski K, Podewski E, Bonda T, Schaefer A, Sliwa K, Forster O, Quint A, Landmesser U, Doerries C, Luchtefeld M, Poli V, Schneider MD, Balligand JL, Desjardins F, Ansari A, Struman I, Nguyen NQ, Zschemisch NH, Klein G, Heusch G, Schulz R, Hilfiker A, Drexler H, A cathepsin D-cleaved 16 kDa form of prolactin mediates postpartum cardiomyopathy. Cell 128, 589–600 (2007). - PubMed

Publication types

Substances

LinkOut - more resources