. 2024 Jul:241:106521.
doi: 10.1016/j.jsbmb.2024.106521. Epub 2024 Apr 16.

Upregulation of coagulation factor V by glucocorticoid in the preovulatory follicles of zebrafish

Affiliations

Upregulation of coagulation factor V by glucocorticoid in the preovulatory follicles of zebrafish

Jing Huang et al. J Steroid Biochem Mol Biol. 2024 Jul.

Abstract

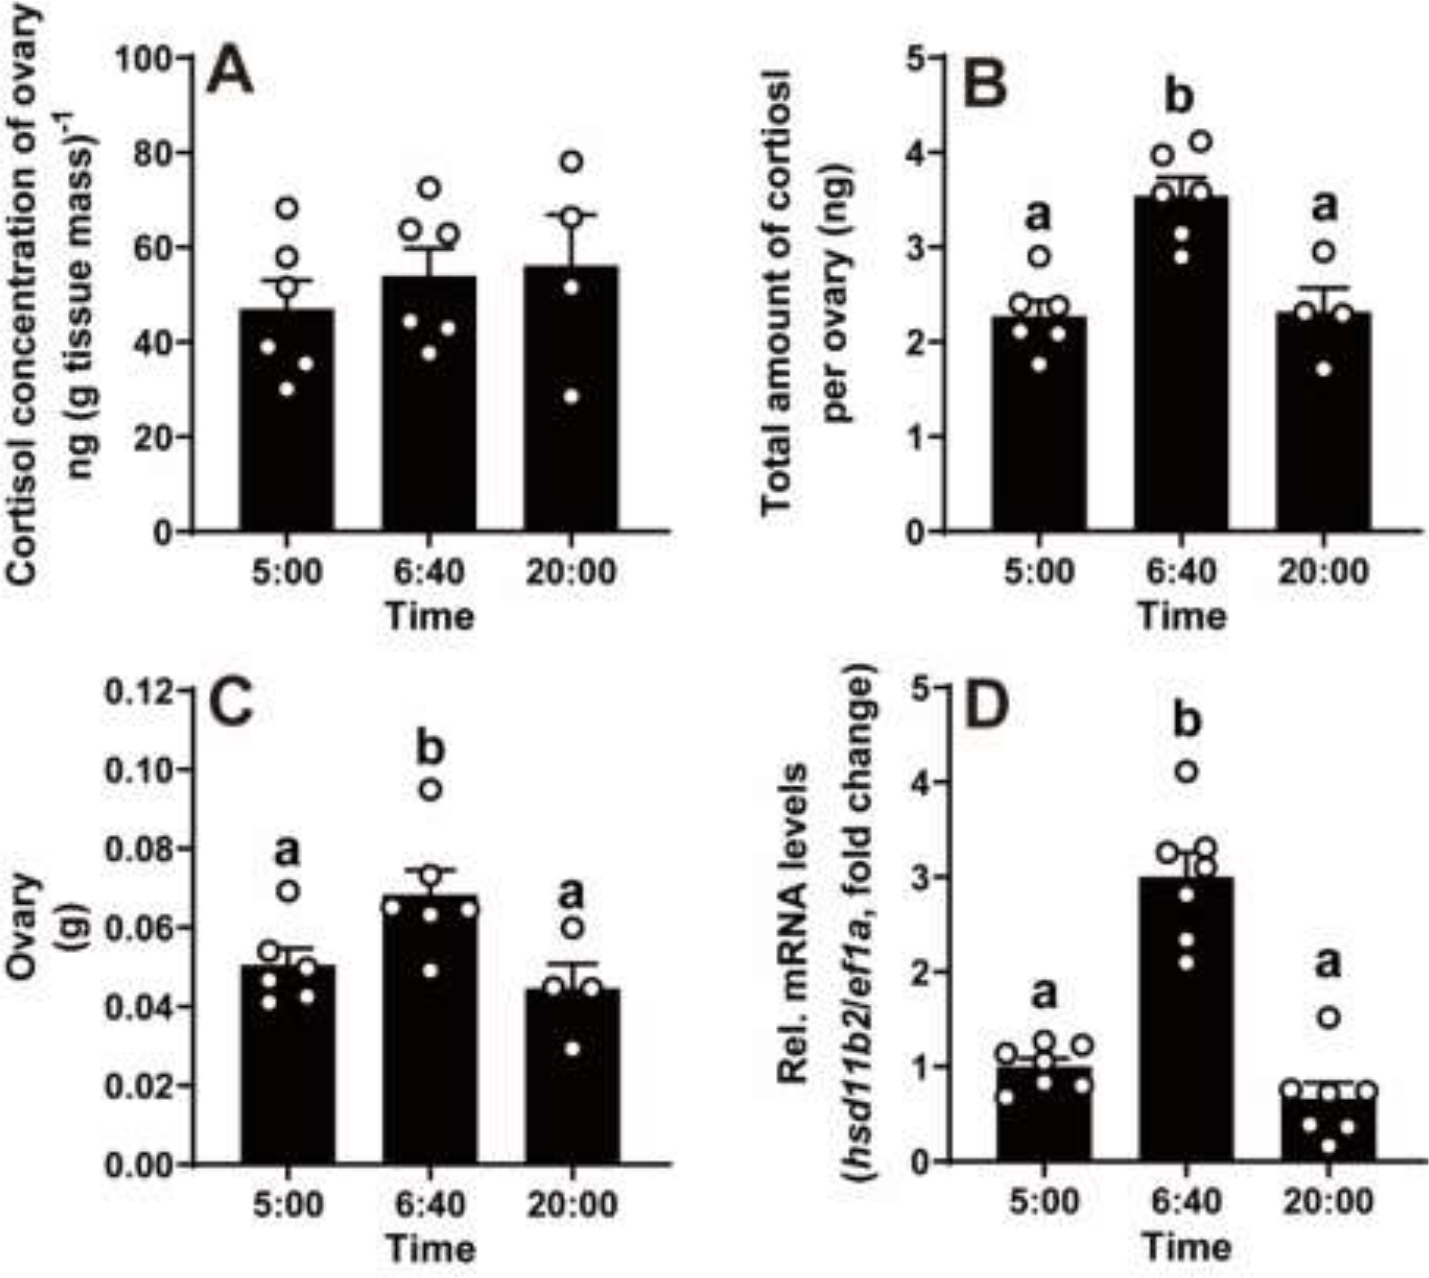
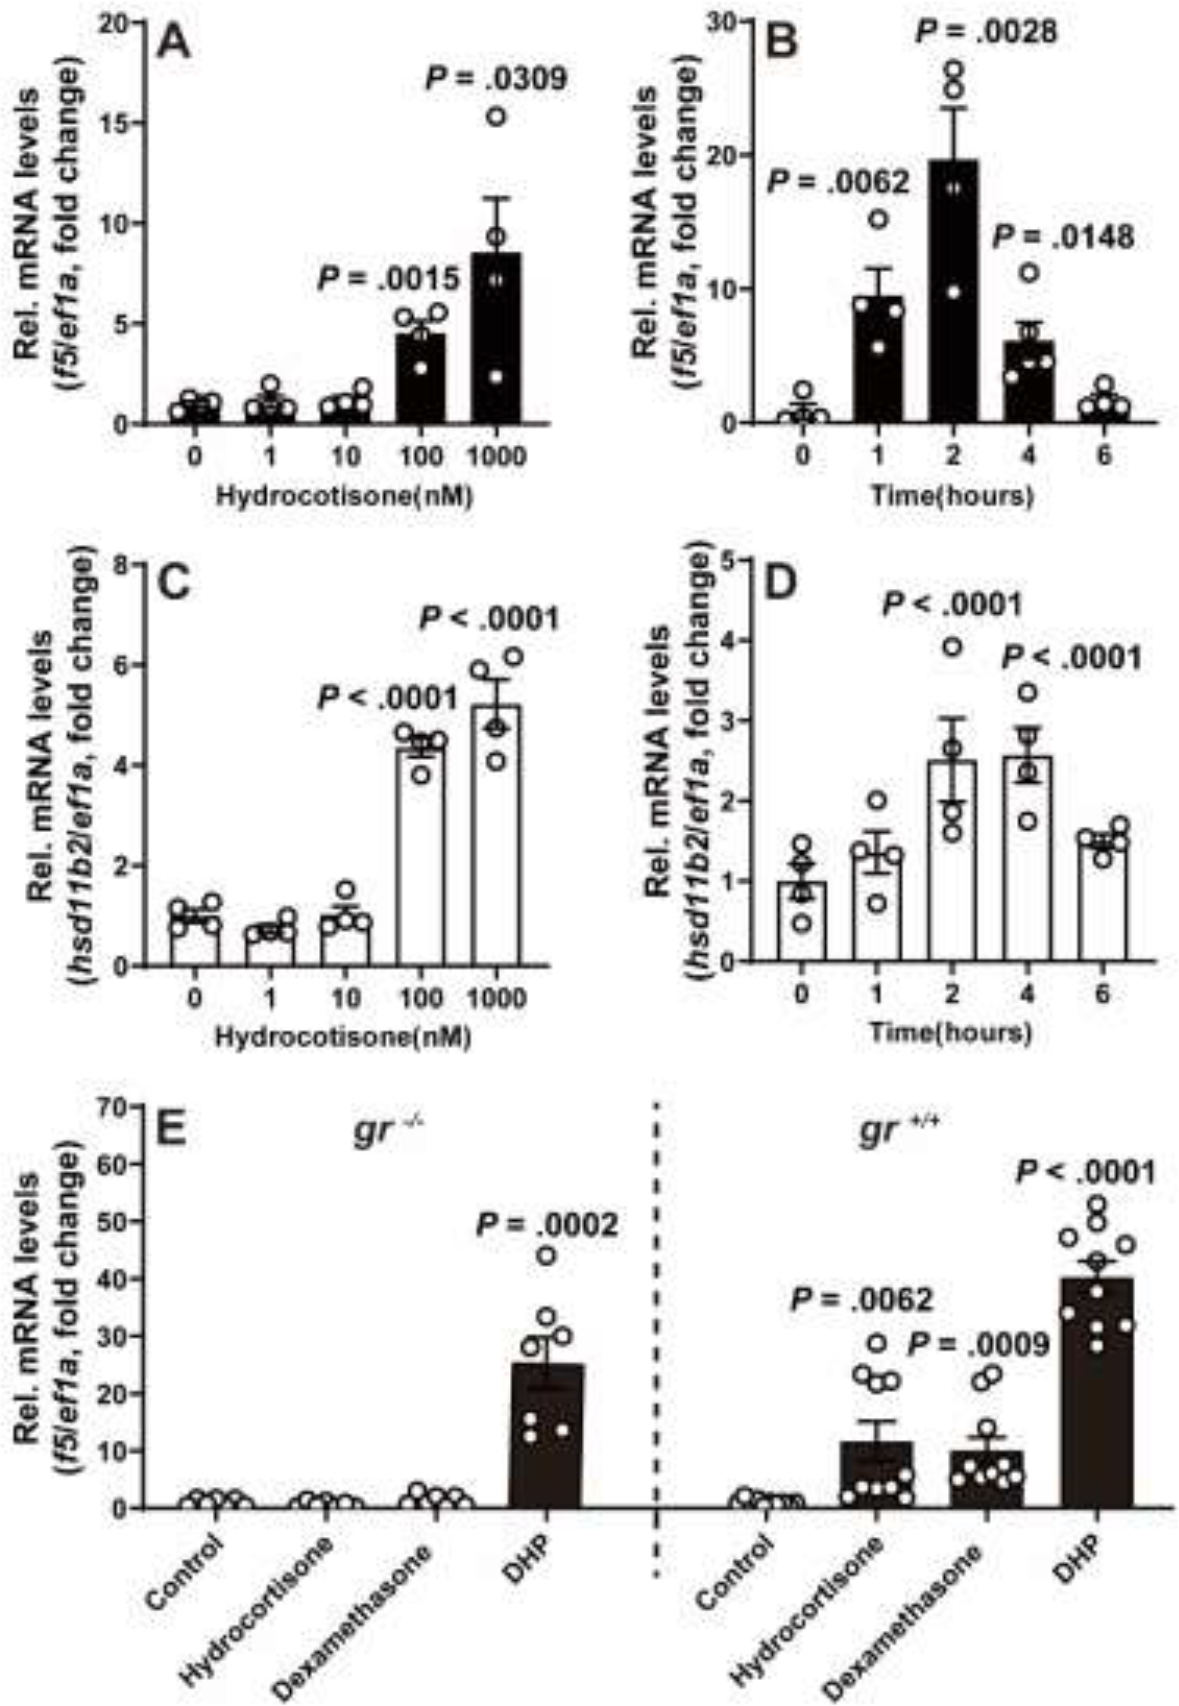
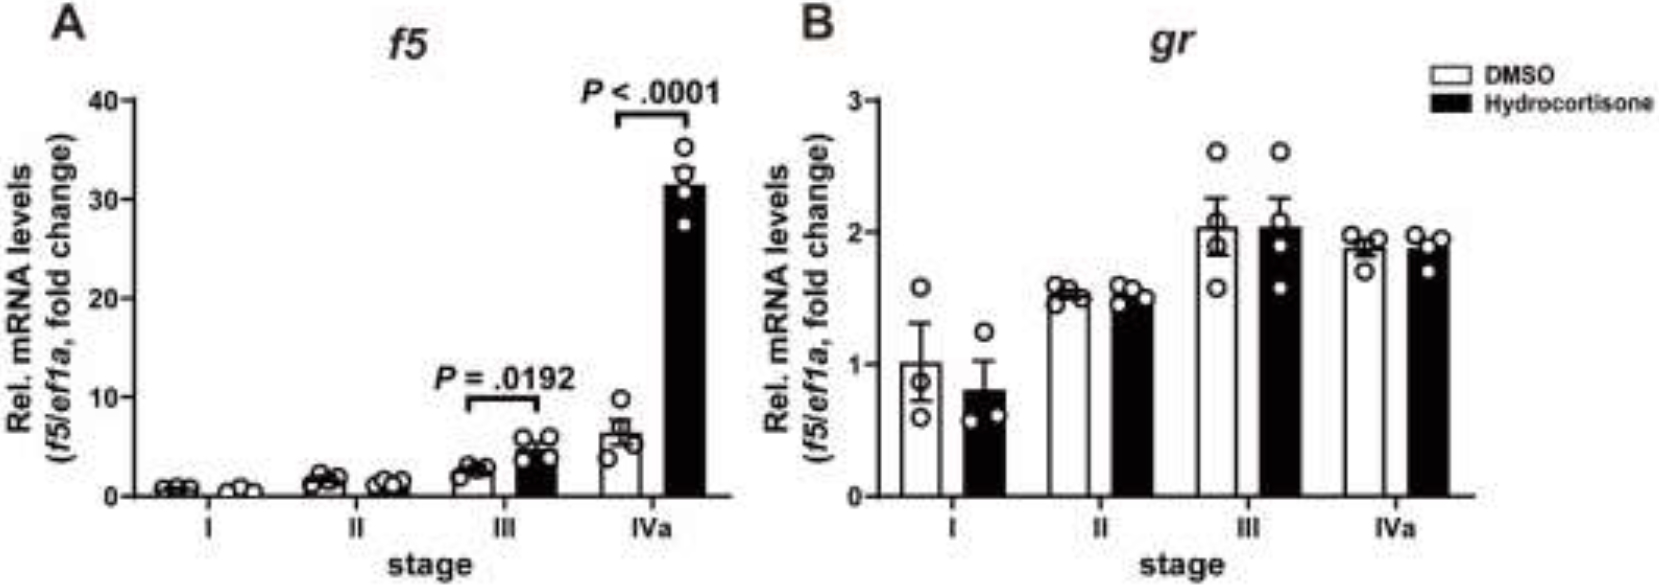
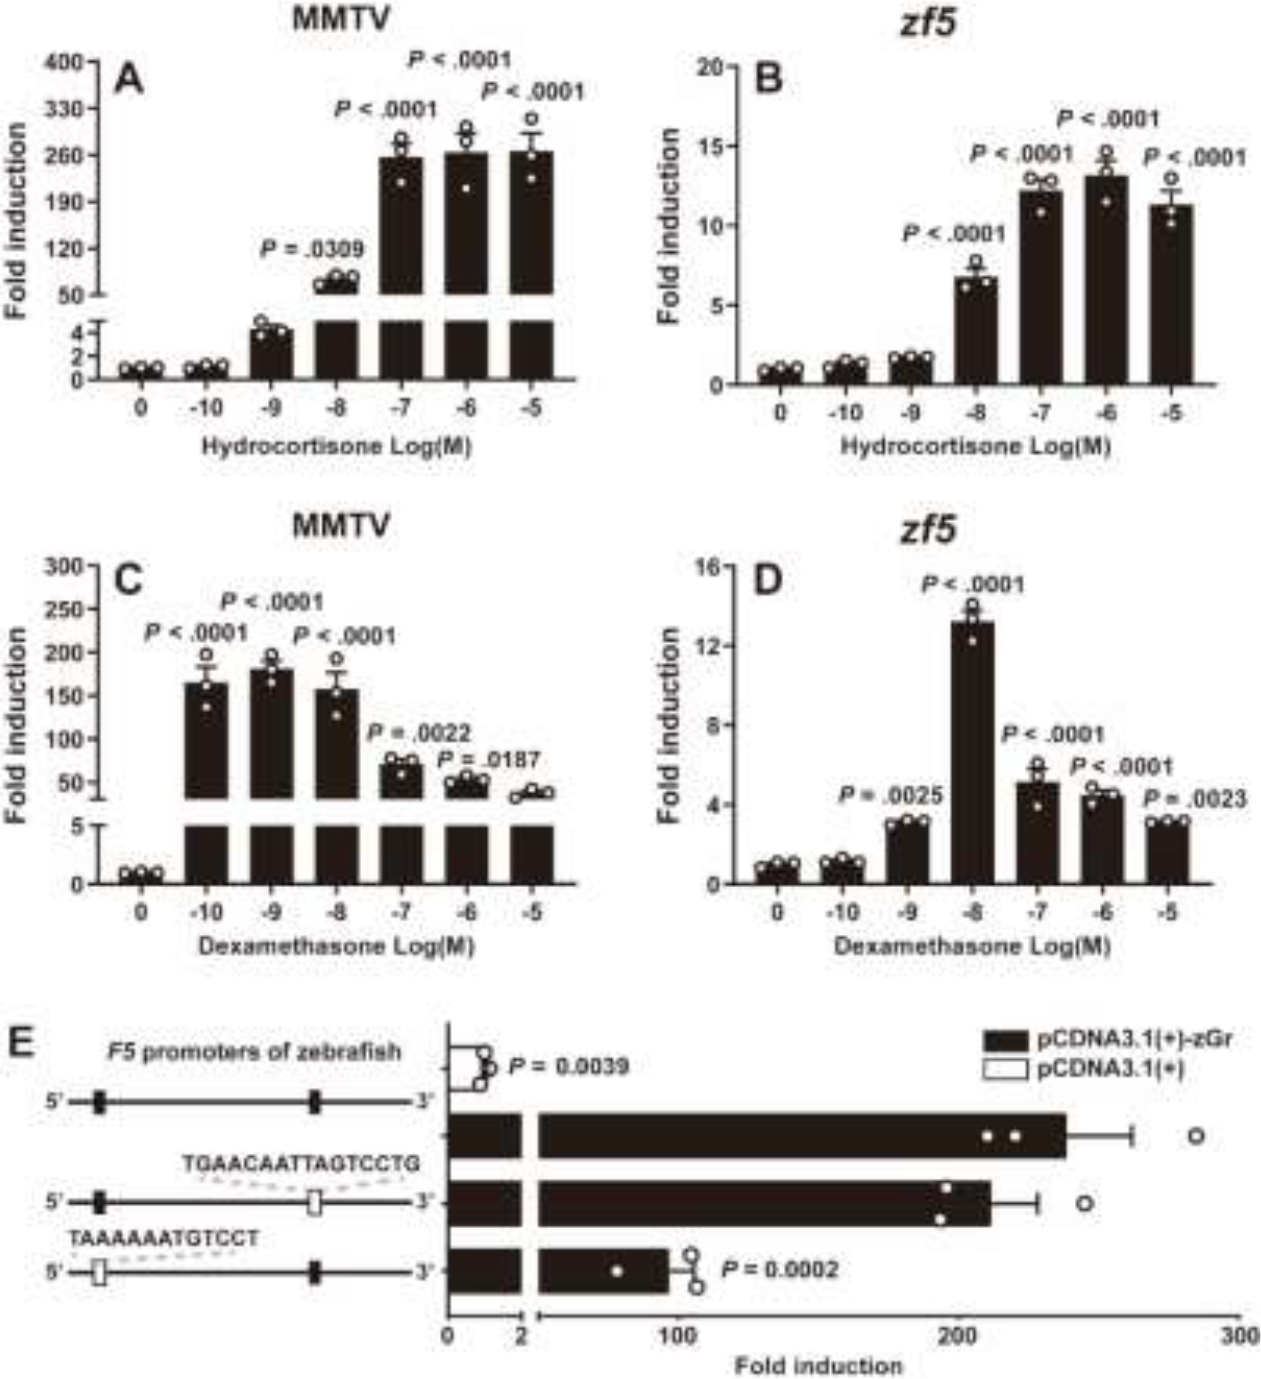
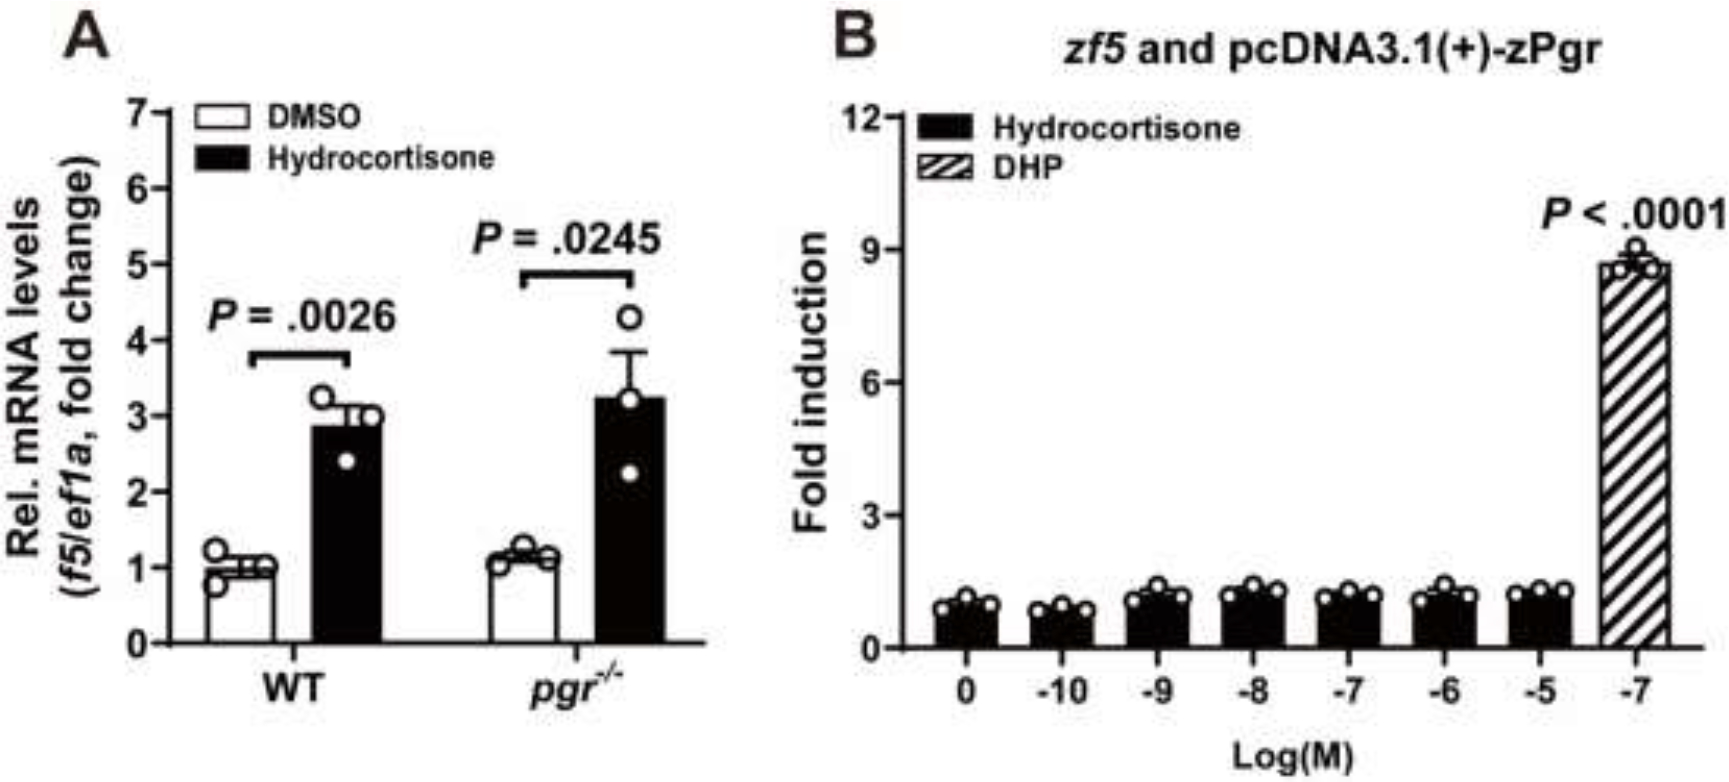
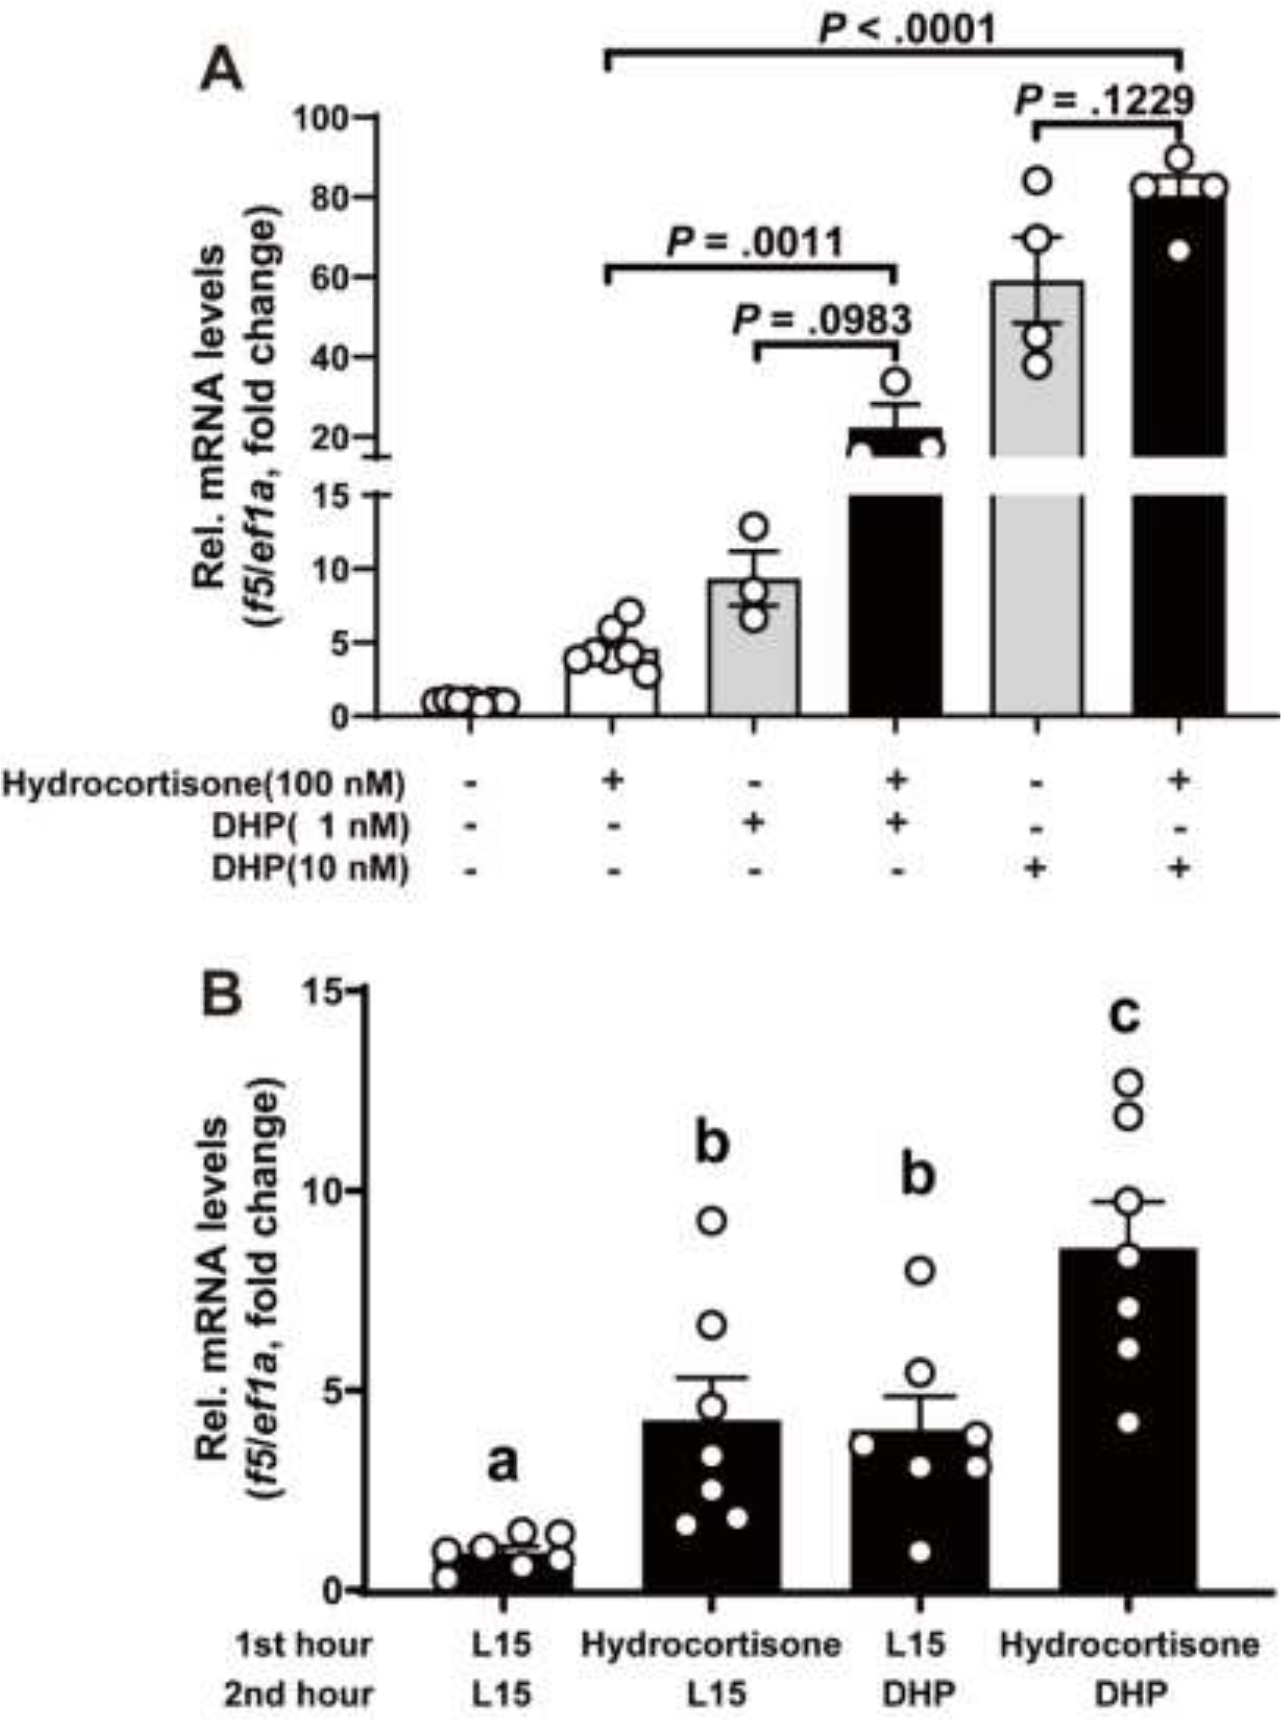
Increased cortisol levels in the preovulatory follicular fluid suggests a role of glucocorticoid in human ovulation. However, the mechanisms through which cortisol regulates the ovulatory process remain poorly understood. In this study, we examined the upregulation of f5 mRNA by glucocorticoid and its receptor (Gr) in the preovulatory follicles of zebrafish. Our findings demonstrate a significant increase in 11β-hydroxysteroid dehydrogenase type 2 (hsd11b2), a cortisol response gene, in preovulatory follicles. Additionally, hydrocortisone exerts a dose- and time-dependent upregulation of f5 mRNA in these follicles. Importantly, this stimulatory effect is Gr-dependent, as it was completely abolished in gr-/- mutants. Furthermore, site-directed mutagenesis identified a glucocorticoid response element (GRE) in the promoter of zebrafish f5. Interestingly, successive incubation of hydrocortisone and the native ovulation-inducing steroid, progestin (17α,20β-dihydroxy-4-pregnen-3-one, DHP), further enhanced f5 expression in preovulatory follicles. Overall, our results indicate that the dramatic increase of f5 expression in preovulatory follicles is partially attributable to the regulation of glucocorticoid and Gr.

Keywords: Coagulation factor; Glucocorticoid; Glucocorticoid receptor; Ovarian follicles.


Conflict of interest statement

Declaration of Competing Interest The authors declare no conflict of interest.

Figures

Figure 1.
Figure 1.. Changes in ovarian cortisol levels and hsd11b2 transcript in stage IV follicles during a daily spawning cycle in vivo in zebrafish.
Samples were collected at three representative time points: 05:00 (prior to oocyte maturation), 06:40 (after oocyte maturation but prior to ovulation), and 20:00 (12 hours after lights on). The whole ovary was weighed and collected for cortisol analysis using ELISA. Fully grown ovarian follicles (stage IVa or IVb) were collected for gene expression analysis. A, The cortisol concentration in the ovary did not change during a daily spawning cycle. B, The total amount of cortisol per ovary peaked at 06:40. C, The ovary weight peaked at 06:40. Data are presented as mean ± SEM (N ≥ 4). D, An increase of hsd11b2 mRNA in preovulatory follicles during a daily spawning cycle in vivo. Expression of hsd11b2 mRNA was determined by qPCR and normalized to an internal control (ef1α). Data are expressed as mean ± SEM (N = 7) relative to the respective transcript levels of hsd11b2 in IVa follicles collected at 05:00. Bar maked with different letters indicated significant differences between each other (P < 0.05, Student’s unpaired t test).
Figure 2.
Figure 2.. Transient increase of f5 and hsd11b2 mRNA expression in preovulatory follicles in response to stimulation of hydrocortisone in vitro.
A-D, Expression levels of f5 (A, B) and hsd11b2 (C, D) mRNA in response to treatment with various doses of hydrocortisone (2 hours exposure) (A, C), and hydrocortisone (100 nM) at various time points (B, D) in preovulatory follicles (IVa) in vitro. E, Effect of hydrocortisone (100 nM), dexamethasone (100 nM), and DHP (10 nM) on f5 expression in the mutants (gr/, left side of C panel) or their gr+/+ siblings (right side of C panel). The relative expression of f5 mRNA was determined by qPCR and normalized to an internal control (ef1α). Data are presented as mean ± SEM (N ≥ 3) relative to the respective transcript levels of target gene measured in 0 time point or vehicle treatment group. P values were calculated by Student’s unpaired t test against respective controls (0 time point or vehicle treatment group).
Figure 3.
Figure 3.. Transcripts of f5 showed stage-specific response to hydrocortisone in ovarian follicles.
Follicles at different stages were incubated with hydrocortisone (100 nM) for 2 hours in vitro, with DMSO treatment as the control group. The relative expression of f5 (A) or gr (B) mRNA expression was determined by qPCR and normalized to an internal control (ef1α). Data are presented as mean ± SEM (N = 3) relative to the transcript levels of the target gene measured in the follicle at stage I with DMSO treatment. P values were calculated by Student’s unpaired t test.
Figure 4.
Figure 4.. Glucocorticoids enhance promoter activity of f5 via Gr.
HEK293T cells were transiently co-transfected with a firefly luciferase reporter vector containing putative Gr binding elements, a pRL-TK vector containing the Renilla luciferase reporter gene (as a control for transfection efficiency), and a Gr expression vector. In the presence of zebrafish Gr (zGr), both hydrocortisone (A, B) and dexamethasone (C, D) significantly increased the activities of mouse mammary tumor virus (MMTV) and zebrafish f5 promoter. E, Site-directed mutagenesis of two likely GREs decreased the zf5 promoter activity. HEK293T cells were incubated for 24 hours with increasing concentrations of glucocorticoids (hydrocortisone or dexamethasone: 100 pM to 1 μM). Luciferase activity was then assayed in cell extracts. Values are shown relative to the luciferase activity of the vehicle treatment group. Data are presented as mean ± SEM (N = 3). P values were calculated by one-tailed, one-way analysis of variance followed by the Dunnett test against respective controls (vehicle controls or 0 dose).
Figure 5.
Figure 5.. Hydrocortisone-induced upregulation of f5 mRNA independent of Pgr.
A, Hydrocortisone upregulated the expression of f5 mRNA in the stage IVa follicles from pgr/ mutants. Stage IVa follicles (from WT and pgr/ zebrafish) were incubated with hydrocortisone (100 nM) for 2 hours in vitro. The expression of f5 transcript was determined by qPCR and normalized to an internal control (ef1α). Data are expressed as mean ± SEM (N = 3) relative to the transcript levels of target gene measured in the vehicle treatment group. P values were calculated by Student’s unpaired t test. B, Hydrocortisone did not enhance promoter activity of f5 via Pgr. HEK293T cells were transiently co-transfected with a firefly luciferase reporter vector containing zebrafish f5 promoter, a pRL-TK vector containing the Renilla luciferase reporter gene (as a control for transfection efficiency), and a Pgr expression vector. After 24 hours of incubation with increasing concentrations of hydrocortisone (100 pM to 10 μM) or DHP (100 nM), luciferase activity was assayed in the HEK293T cell extracts. The values are shown relative to the luciferase activity of the vehicle treatment group. Data are presented as mean ± SEM (N = 3). P values were calculated by one-tailed, one-way analysis of variance followed by the Dunnett test against vehicle treatment control. P values were calculated by Student’s unpaired t test.
Figure 6.
Figure 6.. Effect of co-incubation of hydrocortisone and DHP on the f5 mRNA expression in preovulatory follicles.
A, Stage IVa follicles were incubated with hydrocortisone (100 nM), and DHP (1nM or 10nM) alone or together for 2 hours. B, stage IVa follicles were treated successively treated with hydrocortisone (100 nM for 1 hour) and DHP (10 nM for 1 hour). The expression of f5 transcript was determined by qPCR and normalized to an internal control (ef1α). Data are presented as mean ± SEM (N ≥ 3) relative to the transcript levels of target gene measured in the vehicle treatment group. P values were calculated by Student’s unpaired t test (A). Different letters on the bar indicated significant differences between each other (P < 0.05, Student’s unpaired t test) (B).

Similar articles

References

    1. Duffy DM, Ko C, Jo M, Brannstrom M, Curry TE. Ovulation: Parallels With Inflammatory Processes. Endocr Rev. 2019;40(2):369–416. - PMC - PubMed
    1. Ramamoorthy S, Cidlowski JA. Corticosteroids Mechanisms of Action in Health and Disease. Rheumatic Disease Clinics of North America. 2016;42(1):15-+. - PMC - PubMed
    1. Hillier SG, Tetsuka M. An anti-inflammatory role for glucocorticoids in the ovaries? J Reprod Immunol. 1998;39(1–2):21–27. - PubMed
    1. Jeon H, Choi Y, Brannstrom M, Akin JW, Curry TE, Jo M. Cortisol/glucocorticoid receptor: a critical mediator of the ovulatory process and luteinization in human periovulatory follicles. Hum Reprod. 2023;38(4):671–685. - PMC - PubMed
    1. Caimari F, Valassi E, Garbayo P, Steffensen C, Santos A, Corcoy R, Webb SM. Cushing’s syndrome and pregnancy outcomes: a systematic review of published cases. Endocrine. 2017;55(2):555–563. - PubMed

Publication types

MeSH terms

LinkOut - more resources