. 2024 Apr 17;12(4):e008606.
doi: 10.1136/jitc-2023-008606.

Tumor-targeted therapy with BRAF-inhibitor recruits activated dendritic cells to promote tumor immunity in melanoma

Affiliations

Tumor-targeted therapy with BRAF-inhibitor recruits activated dendritic cells to promote tumor immunity in melanoma

Florian Hornsteiner et al. J Immunother Cancer. .

Abstract

Background: Tumor-targeted therapy causes impressive tumor regression, but the emergence of resistance limits long-term survival benefits in patients. Little information is available on the role of the myeloid cell network, especially dendritic cells (DC) during tumor-targeted therapy.

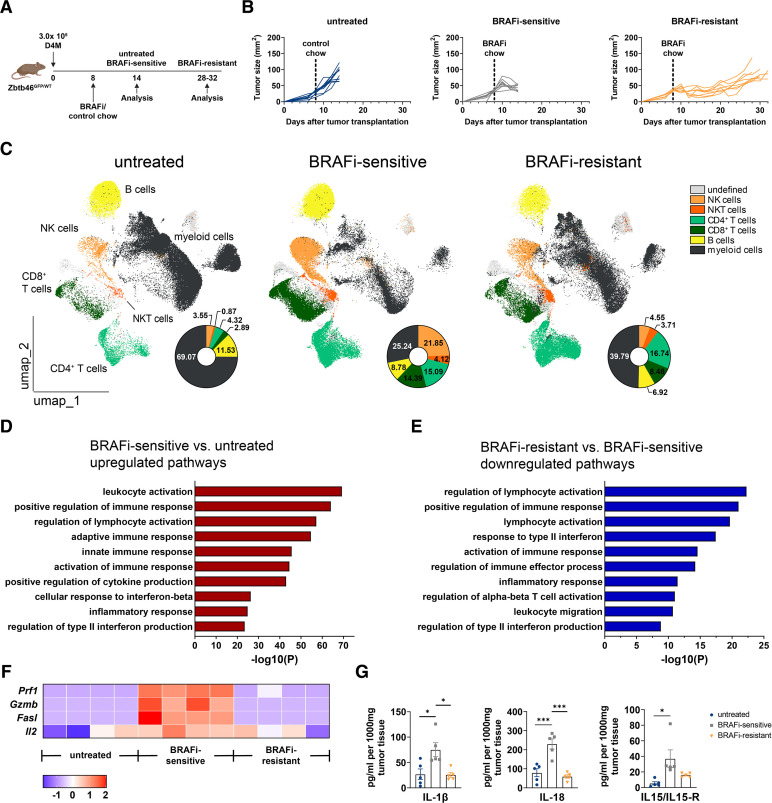
Methods: Here, we investigated therapy-mediated immunological alterations in the tumor microenvironment (TME) and tumor-draining lymph nodes (LN) in the D4M.3A preclinical melanoma mouse model (harboring the V-Raf murine sarcoma viral oncogene homolog B (BRAF)V600E mutation) by using high-dimensional multicolor flow cytometry in combination with multiplex immunohistochemistry. This was complemented with RNA sequencing and cytokine quantification to characterize the immune status of the tumors. The importance of T cells during tumor-targeted therapy was investigated by depleting CD4+ or CD8+ T cells in tumor-bearing mice. Tumor antigen-specific T-cell responses were characterized by performing in vivo T-cell proliferation assays and the contribution of conventional type 1 DC (cDC1) to T-cell immunity during tumor-targeted therapy was assessed using Batf3-/- mice lacking cDC1.

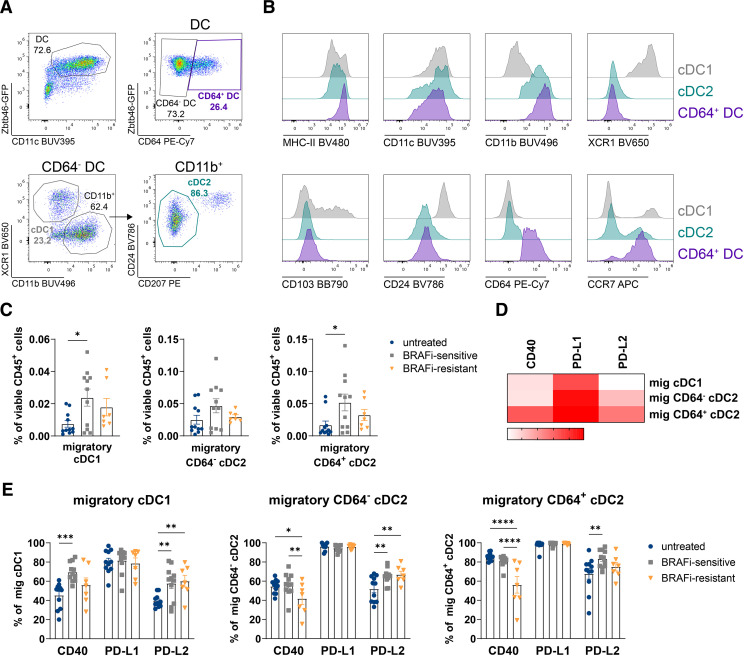
Results: Our findings reveal that BRAF-inhibitor therapy increased tumor immunogenicity, reflected by an upregulation of genes associated with immune activation. The T cell-inflamed TME contained higher numbers of activated cDC1 and cDC2 but also inflammatory CCR2-expressing monocytes. At the same time, tumor-targeted therapy enhanced the frequency of migratory, activated DC subsets in tumor-draining LN. Even more, we identified a cDC2 population expressing the Fc gamma receptor I (FcγRI)/CD64 in tumors and LN that displayed high levels of CD40 and CCR7 indicating involvement in T cell-mediated tumor immunity. The importance of cDC2 is underlined by just a partial loss of therapy response in a cDC1-deficient mouse model. Both CD4+ and CD8+ T cells were essential for therapy response as their respective depletion impaired therapy success. On resistance development, the tumors reverted to an immunologically inert state with a loss of DC and inflammatory monocytes together with the accumulation of regulatory T cells. Moreover, tumor antigen-specific CD8+ T cells were compromised in proliferation and interferon-γ-production.

Conclusion: Our results give novel insights into the remodeling of the myeloid landscape by tumor-targeted therapy. We demonstrate that the transient immunogenic tumor milieu contains more activated DC. This knowledge has important implications for the development of future combinatorial therapies.

Keywords: Dendritic cells; Immune modulatory; Myeloid cells; Skin Cancer; Tumor immunity; Tumor-targeted therapy.


Conflict of interest statement

Competing interests: None declared.

Figures

Figure 1
Figure 1
BRAFi treatment mediates the strong immunomodulatory activity. (A) Experimental design: 3×10⁵ D4M melanoma cells were subcutaneously injected into the flank skin of Zbtb46GFP/WT mice. When tumors reached a size of 30–35 mm2 on day 8 after transplantation, mice received either BRAFi-containing or control chow. On day 14, untreated and BRAFi-sensitive D4M tumors were analyzed. Another group of mice kept on the BRAFi-containing diet started to regrow tumors due to BRAFi-resistance (analyzed on days 28–32 after transplantation when tumors were comparable in size to untreated ones, BRAFi-resistant). (B) Individual D4M tumor growth of three independent experiments is shown (n≥9/group). (C) Relative abundance of tumor-infiltrating NK cells, NKT cells, CD4+ T cells, CD8+ T cells, B cells and myeloid cells from untreated, BRAFi-sensitive and BRAFi-resistant tumors was measured by flow cytometry analysis. Shown is a UMAP dimensionality reduction of three representative mice per group. (D,E) Gene Set Enrichment Analysis was performed on bulk RNA sequencing data from untreated, BRAFi-sensitive and BRAFi-resistant tumor tissue. Barplots report the log-scaled p values of the most enriched terms in BRAFi-sensitive tumors compared with untreated tumors (D) and BRAFi-sensitive tumors compared with BRAFi-resistant tumors (E) based on differential expression analysis. (F) The heatmap depicts normalized and relative expression levels (z-score) for a selection of genes important for immune cell-related cytotoxicity. (G) Protein levels for the cytokines IL-1β, IL-18 and IL-15/IL-15R were measured in tumor lysates (n=5/group). For (D–F), results from four mice/group are shown. Statistical significance was determined using one-way analysis of variance followed by Tukey’s multiple comparison test or Kruskal-Wallis test followed by Dunn’s multiple comparison test. Graphs show the mean±SEM. *p<0.05; ***p<0.001. BRAFi, V-Raf murine sarcoma viral oncogene homolog B inhibitors; IL, interleukin; NK, natural killer; NKT, natural killer T; UMAP, Uniform Manifold Approximation and Projection.
Figure 2
Figure 2
BRAFi treatment creates a T cell-inflamed tumor microenvironment. (A) Representative multicolor staining of tumor sections with a T cell panel including DAPI (blue), CD3 (green), CD8 (purple), CD4 (cyan), PD-1 (red), FoxP3 (yellow), and granzyme B (magenta). Scale bar indicates 50 µm. (B) Representative sections of untreated, BRAFi-sensitive and BRAFi-resistant tumors, demonstrating the localization of CD3+ T cells (green). Scale bar indicates 1 mm. (C) Densities (cells/mm2) were assessed for CD3+ T cells, CD4+ CD3+ T cells and CD8+ CD3+ T cells. (D) Densities (cells/mm2) of CD4+ and CD8+ T cells positive for GrzB. (E) Proportions of CD4+ and CD8+ T cells positive for GrzB. (F) Densities (cells/mm2) of CD4+ T cells positive for FoxP3. (G) Flow cytometry analysis to determine Treg in untreated, BRAFi-sensitive, and BRAFi-resistant tumors. (H) Flow cytometry analysis to calculate the ratio of Treg to CD8+ T cells. For (C–F) results from ≥4 mice/group are shown. For (G–H) summary graphs of two independent experiments are shown (n≥6/group). Statistical significance was determined using one-way analysis of variance followed by Tukey’s multiple comparison test or Kruskal-Wallis test followed by Dunn’s multiple comparison test. Graphs show the mean±SEM. *p<0.05; **p<0.01; ***p<0.001; ****p<0.0001. BRAFi, V-Raf murine sarcoma viral oncogene homolog B inhibitors; DAPI, 4′,6-Diamidin-2-phenylindol, DAPI; PD-1, Programmed Cell Death Protein-1; FoxP3, Forkhead-Box-Protein P3; GrzB, granzyme B; Treg, regulatory T cells.
Figure 3
Figure 3
BRAFi treatment profoundly remodels the myeloid landscape in tumors. (A) Flow cytometry data from untreated, BRAFi-sensitive and -resistant tumors derived from Zbtb46GFP/WT mice was concatenated. FlowSOM unsupervised clustering of viable CD45+ CD3 NK1.1 CD19 myeloid cells. Left: UMAP of all cells and all groups (untreated, BRAFi-sensitive and BRAFi-resistant tumors). Right: heatmap displaying the expression of several myeloid markers on identified clusters across all three groups. (B) UMAPs of each treatment group showing three representative mice per group, displaying the changes in frequencies of the different identified myeloid cell clusters in tumors. (C) Cell numbers of tumor-infiltrating myeloid subtypes per gram tumor tissue in untreated, BRAFi-sensitive and BRAFi-resistant tumors. (D) Representative histograms showing the surface expression of several myeloid markers on moncytes subsets. (E) Percentages of CD40+Mono(ACT) in tumors. (F) The heatmap depicts normalized and relative expression levels (z-score) for several selected interferon-associated genes (n=4 mice/group). For (C,E) results from three independent experiments are shown (n≥8 mice/group). Statistical significance was determined using one-way analysis of variance followed by Tukey’s multiple comparison test or Kruskal-Wallis test followed by Dunn’s multiple comparison test. Graphs show the mean±SEM. *p<0.05; **p<0.01; ***p<0.001; ****p<0.0001. BRAFi, V-Raf murine sarcoma viral oncogene homolog B inhibitors; cDC, conventional DC; DC, dendritic cells; DN, double negative; MHC, major histocompatibility complex; pDC, plasmacytoid DC; PD-L1, Programmed Cell Death-Ligand 1; UMAP, Uniform Manifold Approximation and Projection; TAM, tumor-associated macrophages.
Figure 4
Figure 4
BRAFi treatment causes a transient infiltration of activated DC subtypes to D4M tumors. (A) Cell numbers of cDC1 and cDC2 per gram tumor tissue from untreated, BRAFi-sensitive and BRAFi-resistant tumors are shown. (B) Representative histogram for CD64 expression on the different myeloid cell clusters in D4M tumors. (C) Percentages of CD64+ cDC2. (D–F) Summary graphs depicting percentages of CD40, CCR7, PD-L1 and PD-L2 positive cDC1, CD64 cDC2 and CD64+ cDC2. (G) RNA sequencing analysis of D4M tumor tissue from untreated, BRAFi-sensitive and BRAFi-resistant tumors. The heatmap depicts normalized and relative expression levels (z-score) of several DC-related cytokines and chemokines (n=4 mice/group). For (A,C–F) results from three independent experiments are shown (n≥8 mice/group). Statistical significance was determined using one-way analysis of variance followed by Tukey’s multiple comparison test or Kruskal-Wallis test followed by Dunn’s multiple comparison test. Graphs show the mean±SEM. *p<0.05; **p<0.01; ***p<0.001. BRAFi, V-Raf murine sarcoma viral oncogene homolog B inhibitors; cDC, conventional DC; DC, dendritic cells; pDC, plasmacytoid DC; PD-L1, Programmed Cell Death-Ligand 1; TAM, tumor-associated macrophages.
Figure 5
Figure 5
BRAFi increases the percentage of activated, migratory DC in tumor-draining LN. (A) Representative flow cytometry plots for the identification of CD64+ DC, cDC1 and cDC2 after exclusion of dead cells, natural killer cells, NKT cells, T cells, B cells, pDC, monocytes and neutrophils (for gating strategy see online supplemental figure 4a). Zbtb46-GFP and CD11c expression was used for correct DC-discrimination from other myeloid cell populations. (B) Representative histograms showing surface expression of myeloid markers on the different DC populations in tumor-draining LN. (C) Percentages of migratory DC subsets in tumor-draining LN of untreated, BRAFi-sensitive and BRAFi-resistant tumors. (D) Heatmap displaying the percentage of CD40, PD-L1 and PD-L2 expression on migratory DC. (E) Phenotypical characterization of migratory DC subsets in tumor-draining LN by analyzing the expression of CD40, PD-L1 and PD-L2. For (C–E) results from three independent experiments are shown (n≥7 mice/group). Statistical significance was determined using one-way analysis of variance followed by Tukey’s multiple comparison test or Kruskal-Wallis test followed by Dunn’s multiple comparison test. Graphs show the mean±SEM. *p<0.05; **p<0.01; ***p<0.001; ****p<0.0001. BRAFi, V-Raf murine sarcoma viral oncogene homolog B inhibitors; cDC, conventional DC; DC, dendritic cells; LN, lymph nodes; mig DC, migratory DC; NKT, natural killer T; pDC, plasmacytoid DC; PD-L1, Programmed Cell Death-Ligand 1.
Figure 6
Figure 6
Resistance to tumor-targeted therapy impairs antitumor CD8+ T-cell response. (A) Individual D4M tumor growth in CD4+ or CD8+ T-cell depleted C57BL/6 mice during BRAFi treatment compared with isotype control. (B) Experimental design of the in vivo antigen-specific T-cell assay. 3×10⁵ D4M-OVA melanoma cells were s.c. injected into the flank skin of C57BL/6 mice. CTV-labeled CD4+ OT-II or CD8+ OT-I T cells were adoptively transferred into separate untreated, BRAFi-sensitive and BRAFi-resistant animals. Proliferation and activation of antigen-specific CD8+ T cells was analyzed by flow cytometry 3 days after transfer, antigen-specific CD4+ T cells were analyzed 5 days after transfer. (C) Percentages of proliferating and CD44+ antigen-specific OT-I T cells in the tumor-draining LN. (D) Results for IFN-y ELISA after in vitro restimulation of tumor-draining LN cells with 1 µM OVA257-264 peptide for 48 hours. (E) Percentages of proliferating and CD44+ antigen-specific OT-II T cells in the tumor-draining LN. (F) Results for IFN-y ELISA after in vitro restimulation of tumor-draining LN cells with 1 µM OVA323-339 peptide for 48 hours. (G,H) D4M tumor growth in Batf3−/− or C57BL/6 mice. Individual D4M tumor growth (G) and Kaplan-Meier survival curve (H) is shown (n≥7/group). For (C–F) results from two independent experiments are shown (n≥6 mice/group). For (D,F) the fold change over negative controls is shown. As negative controls, CTV-labeled CD4+ OT-II or CD8+ OT-I T cells were adoptively transferred into separate tumor-free C57BL/6 mice. Statistical significance was determined using one-way analysis of variance followed by Tukey’s multiple comparison test or Kruskal-Wallis test followed by Dunn’s multiple comparison test. Graphs show the mean±SEM. *p<0.05; **p<0.01; ***p<0.001.BRAF, V-Raf murine sarcoma viral oncogene homolog B inhibitors; CTV, CellTrace Violet; IFN, interferon; LN, lymph nodes; OVA, ovalbumin.

References

    1. Flaherty KT, Hodi FS, Fisher DE. From genes to drugs: targeted strategies for melanoma. Nat Rev Cancer 2012;12:349–61. 10.1038/nrc3218 - DOI - PubMed
    1. Davies H, Bignell GR, Cox C, et al. . Mutations of the BRAF gene in human cancer. Nature 2002;417:949–54. 10.1038/nature00766 - DOI - PubMed
    1. Chapman PB, Hauschild A, Robert C, et al. . Improved survival with vemurafenib in melanoma with BRAF V600E mutation. N Engl J Med 2011;364:2507–16. 10.1056/NEJMoa1103782 - DOI - PMC - PubMed
    1. Hauschild A, Grob J-J, Demidov LV, et al. . Dabrafenib in BRAF-mutated metastatic melanoma: a multicentre, open-label, phase 3 randomised controlled trial. Lancet 2012;380:358–65. 10.1016/S0140-6736(12)60868-X - DOI - PubMed
    1. Luke JJ, Flaherty KT, Ribas A, et al. . Targeted agents and immunotherapies: optimizing outcomes in melanoma. Nat Rev Clin Oncol 2017;14:463–82. 10.1038/nrclinonc.2017.43 - DOI - PubMed

LinkOut - more resources