. 2024 Apr 17;12(4):e007268.
doi: 10.1136/jitc-2023-007268.

Germline homozygosity and allelic imbalance of HLA-I are common in esophagogastric adenocarcinoma and impair the repertoire of immunogenic peptides

Affiliations

Germline homozygosity and allelic imbalance of HLA-I are common in esophagogastric adenocarcinoma and impair the repertoire of immunogenic peptides

Maria Alejandra Garcia-Marquez et al. J Immunother Cancer. .

Abstract

Background: The individual HLA-I genotype is associated with cancer, autoimmune diseases and infections. This study elucidates the role of germline homozygosity or allelic imbalance of HLA-I loci in esophago-gastric adenocarcinoma (EGA) and determines the resulting repertoires of potentially immunogenic peptides.

Methods: HLA genotypes and sequences of either (1) 10 relevant tumor-associated antigens (TAAs) or (2) patient-specific mutation-associated neoantigens (MANAs) were used to predict good-affinity binders using an in silico approach for MHC-binding (www.iedb.org). Imbalanced or lost expression of HLA-I-A/B/C alleles was analyzed by transcriptome sequencing. FluoroSpot assays and TCR sequencing were used to determine peptide-specific T-cell responses.

Results: We show that germline homozygosity of HLA-I genes is significantly enriched in EGA patients (n=80) compared with an HLA-matched reference cohort (n=7605). Whereas the overall mutational burden is similar, the repertoire of potentially immunogenic peptides derived from TAAs and MANAs was lower in homozygous patients. Promiscuity of peptides binding to different HLA-I molecules was low for most TAAs and MANAs and in silico modeling of the homozygous to a heterozygous HLA genotype revealed normalized peptide repertoires. Transcriptome sequencing showed imbalanced expression of HLA-I alleles in 75% of heterozygous patients. Out of these, 33% showed complete loss of heterozygosity, whereas 66% had altered expression of only one or two HLA-I molecules. In a FluoroSpot assay, we determined that peptide-specific T-cell responses against NY-ESO-1 are derived from multiple peptides, which often exclusively bind only one HLA-I allele.

Conclusion: The high frequency of germline homozygosity in EGA patients suggests reduced cancer immunosurveillance leading to an increased cancer risk. Therapeutic targeting of allelic imbalance of HLA-I molecules should be considered in EGA.

Keywords: Antigen Presentation; Antigens; Computational Biology; Gastrointestinal Neoplasms; Tumor Escape.


Conflict of interest statement

Competing interests: MvB-B: Honoraria for advisory boards, for invited talks from BMS and financial support for research projects from Astellas, Roche and MSD. HAS: Financial support for research projects from Astra Zeneca. All other authors declare no conflicts of interest.

Figures

Figure 1
Figure 1
Esophagogastric adenocarcinoma (EGA) patients exhibit bias toward homozygosity at human leucocyte antigen-I loci. Differences in the frequency of homozygosity in EGA patients (n=80) and HLA-matched healthy controls (HC, n=7615) were calculated with the one-sided Fisher’s exact test. Exact p values are given in the table. In the graph, the dot indicates the OR, and the width of the horizontal lines represents the 95% CI for each condition. Intervals of the OR were computed using the Baptista-Pike method. Significant differences are indicated by asterisks. *p≤0.05, **p≤0.01, ***p≤0.001.
Figure 2
Figure 2
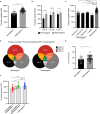
Esophagogastric adenocarcinoma (EGA) patients with HLA homozygosity have a reduced repertoire of good binding peptides (percentile rank ≤3) derive from tumor-associated antigens (TAAs). (A) Number of total predicted good binding peptides derived from TAAs in homozygous (n=28) and heterozygous patients (n=52). (B) Number of total predicted good binding peptides derived from TAAs that bind each individual HLA-I locus in homozygous (n=28) and heterozygous patients (n=52). (C) Number of total predicted good binding peptides derived from TAAs in patients who are homozygous at one allele only (HLA-A n=17, HLA-B n=3, HLA-C n=3) or at more than one allele simultaneously (n=5) compared with heterozygous patients (n=52). (D) Overlay of all predicted peptides binding the three HLA-I loci in homozygous (n=28) and heterozygous patients (n=52). Venn diagrams show peptides binding only to HLA-A (black), HLA-B (dark gray), HLA-C (red), HLA-A and B (light gray), HLA-A and C (yellow), HLA-C and B (orange) or HLA-A, HLA-B and HLA-C (green) in homozygous and heterozygous patients. The numbers in each category represent the mean of predicted peptides in each cohort binding to each HLA-A, HLA-B and HLA-C or the combination. (E) Percentage of good binding peptides predicted to be presented in more than one HLA class I molecule in homozygous (n=28) and heterozygous patients (n=52). (F) In silico modeling of the size of repertoires of predicted good binding peptides derived from TAAs in homozygous patients (n=28) with real and artificial genotypes and heterozygous patients (n=52). Significant differences calculated with one-tailed Mann-Whitney test (A, E), two-way ANOVA with Sidak’s multiple comparison (B), Kruskal-Wallis test with Dunn’s correction (C, F) are indicated by asterisks. *p≤0.05, **p≤0.01, ****p≤0.0001. When appropriate, mean±SD is indicated. ANOVA, analysis of variance.
Figure 3
Figure 3
Tumor mutational landscape. Waterfall plot displaying the landscapes of the top 50 most frequently mutated genes identified in esophagogastric adenocarcinoma samples (n=38). Genes are ordered according to their mutation frequency within this cohort (synonymous mutations marked in red and non-synonymous in blue). Mutation types are color-coded as indicated.
Figure 4
Figure 4
Esophagogastric adenocarcinoma (EGA) patients with HLA homozygosity have reduced repertoires of MANAs. (A) Tumor mutational burden (TMB) in homozygous (n=16) and heterozygous patients (n=22) represented by bar charts. (B) Number of potentially immunogenic mutations that produce neoantigens in homozygous (n=16) and heterozygous EGA patients (n=22). (C) Number of predicted unique neoantigens calculated per expressed single nucleotide variant (SNV) in homozygous (n=16) and heterozygous EGA patients (n=22). (D) Number of potentially immunogenic mutations normalized to expressed SNV that produce neoantigens binding each individual HLA allele in homozygous (n=16) and heterozygous patients (n=22). (E) Number of predicted neoantigens normalized to expressed SNV binding each individual HLA allele in homozygous (n=16) and heterozygous patients (n=22). In silico modeling of the size of repertoires of predicted neoantigens derived from expressed SNV in (F) homozygous patients with real, artificial and most common genotypes (n=16), (G) homozygous patients with artificial genotype (n=16) compared with heterozygous patients with real genotype (n=22), (H) heterozygous patients with real genotype and most common genotype (n=22). (I) Overlay of all predicted peptides among the three HLA-I loci in homozygous (n=16) and heterozygous patients (n=22). Venn diagrams show peptides binding only to HLA-A (black), HLA-B (dark gray), HLA-C (red), HLA-A and B (light gray), HLA-A and C (yellow), HLA-C and B (orange) or HLA-A, HLA-B and HLA-C (green) in homozygous patients with real, artificial and most common genotype and heterozygous patients with real genotype. The numbers inside the circles represent the mean of predicted peptides in each cohort binding to each particular HLA-A, HLA-B and HLA-C or the combination. Significant differences calculated with one-tailed Mann-Whitney test (A–C, G), two-way ANOVA with Sidak’s multiple comparison (D, E), Friedman test with Dunn’s multiple comparison test (F) and one-tailed Wilcoxon matched-paired test (H) are indicated by asterisks. *p≤0.05, **p≤0.01, ****p≤0.0001. When appropriate, mean±SD is indicated. ANOVA, analysis of variance; MANAs, mutation-associated neoantigens.
Figure 5
Figure 5
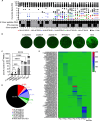
HLA-allelic imbalance is common in esophagogastric adenocarcinoma. (A) HLA-allelic imbalance was calculated in each HLA-I family (A–C) by comparing allele abundances in the tumor to the allele abundances of the corresponding normal tissue in 19 patients. Allele abundances >70.63% were considered imbalanced (red, patients numbers marked in green). Balanced allele frequencies (range 29.37%–70.63%) are depicted in gray (patients numbers marked in black). Patients with germline homozygosity for which only one allele with 100% abundance was detected are marked with an asterisk in the corresponding allele (red). Numbers of patients with combined allelic imbalance of HLA-A, HLA-B and HLA-C are marked with green and an asterisk. (B) Proportion of homozygous (black) or heterozygous (gray) patients who are balanced or imbalanced for at least one HLA-allele. Number of total predicted good binding peptides derived from (C) tumor-associated antigens (TAAs) or (D) somatic mutations calculated with the germline HLA genotype and with the expressed HLA alleles found in the tumor samples of patients with allelic imbalance (n=11, 2 homozygous, 6 heterozygous and three heterozygous with microsatellite instability (MSI)). Significant differences calculated with one-sided χ2 test (B) and one-tailed Wilcoxon matched-paired test (C, D) are indicated by asterisks. *p≤0.05, ***p≤0.001.
Figure 6
Figure 6
Reactivity to the NY-ESO-1 peptide pool is derived from responses to multiple peptides with distinct affinities to HLA-I alleles (A) The HLA genotype of a healthy donor was used for analyses of 43 overlapping peptides (15-mer with 11 amino acid (AA) overlap) derived from NY-ESO-1 to predict binding affinities. Dot plot shows all predicted peptides per sequence with color-coded HLA alleles for peptides with a percentile rank (PR)≤3. Heatmap shows in silico predicted (9–10 mers peptides PR≤3) and experimentally detected (IFN-γ) responses for the indicated 15-mer sequences. (B) NY-ESO-1-specific IFN-γ secretion was assessed by FluoroSpot assay in triplicates. Representative FluoroSpot pictures after co-culture of peripheral blood mononuclear cells (PBMCs) from a healthy donor without peptide ((−) peptides), with 43 overlapping peptides (15-mer with 11 aa overlap) derived from NY-ESO-1 (peptides 4 and 41 are shown as examples) or with the NY-ESO-1 peptide pool. A peptide pool of Cytomegalovirus, Epstein-Barr virus, and influenza virus (CEF) was used as biological positive control, while an antibody against CD3 was used as technical positive control. (C) The numbers of IFN-γ spots per 2×10⁵ cells in FluoroSpot analysis are shown (mean±SD). (D) Pie chart showing the fraction of peptides that are exclusively presented by each color-coded HLA allele. In black is shown the fraction of peptides that are presented by more than one HLA allele. (E) Heatmap showing abundance of T-cell receptor clonotypes after neoantigen-specific expansion of T cells from patient #31. Significant differences calculated with two-tailed multiple unpaired t-test are indicated by asterisks. ***p≤0.001, ****p≤0.0001.

Similar articles

Cited by

References

    1. Little AM, Stern PL. Does HLA type predispose some individuals to cancer? Mol Med Today 1999;5:337–42. 10.1016/s1357-4310(99)01524-5 - DOI - PubMed
    1. Matzaraki V, Kumar V, Wijmenga C, et al. . The MHC locus and genetic susceptibility to autoimmune and infectious diseases. Genome Biol 2017;18:76. 10.1186/s13059-017-1207-1 - DOI - PMC - PubMed
    1. Peng Y, Felce SL, Dong D, et al. . An immunodominant NP105–113-B*07:02 cytotoxic T cell response controls viral replication and is associated with less severe COVID-19 disease. Nat Immunol 2022;23:50–61. 10.1038/s41590-021-01084-z - DOI - PMC - PubMed
    1. Habel JR, Nguyen THO, van de Sandt CE, et al. . Suboptimal SARS-cov-2−specific CD8 + T cell response associated with the prominent HLA-A*02:01 phenotype . Proc Natl Acad Sci USA 2020;117:24384–91. 10.1073/pnas.2015486117 - DOI - PMC - PubMed
    1. Sampson JN, Wheeler WA, Yeager M, et al. . Analysis of heritability and shared heritability based on genome-wide association studies for thirteen cancer types. J Natl Cancer Inst 2015;107:djv279. 10.1093/jnci/djv279 - DOI - PMC - PubMed