. 2024 May 15;34(4):620-632.
doi: 10.1101/gr.278598.123.

Probabilistic association of differentially expressed genes with cis-regulatory elements

Affiliations

Probabilistic association of differentially expressed genes with cis-regulatory elements

Brian S Roberts et al. Genome Res. .

Abstract

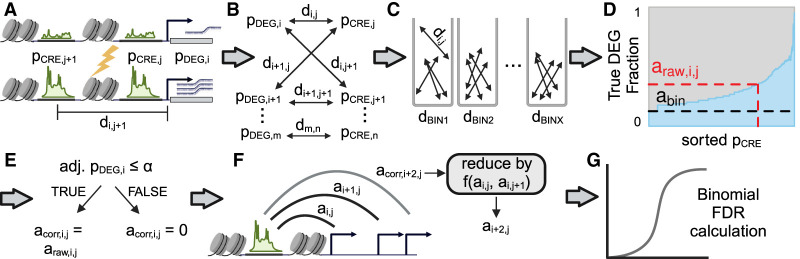
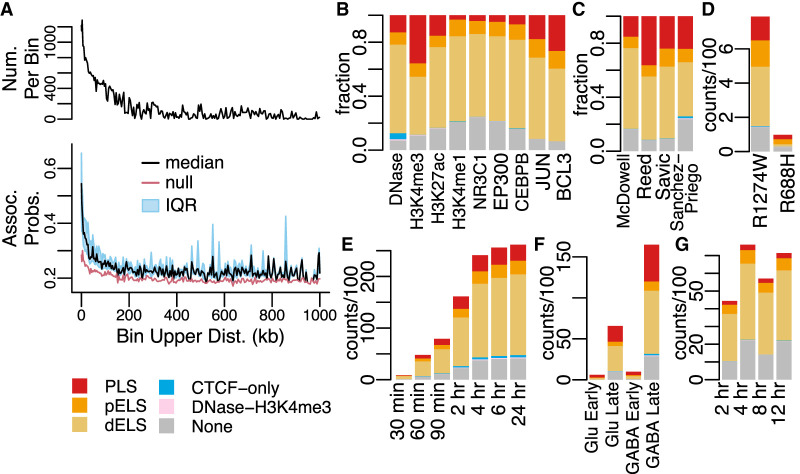
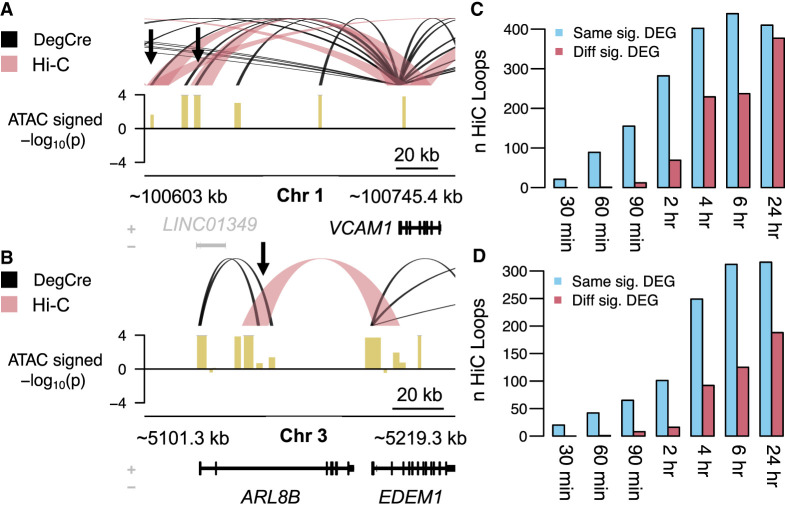
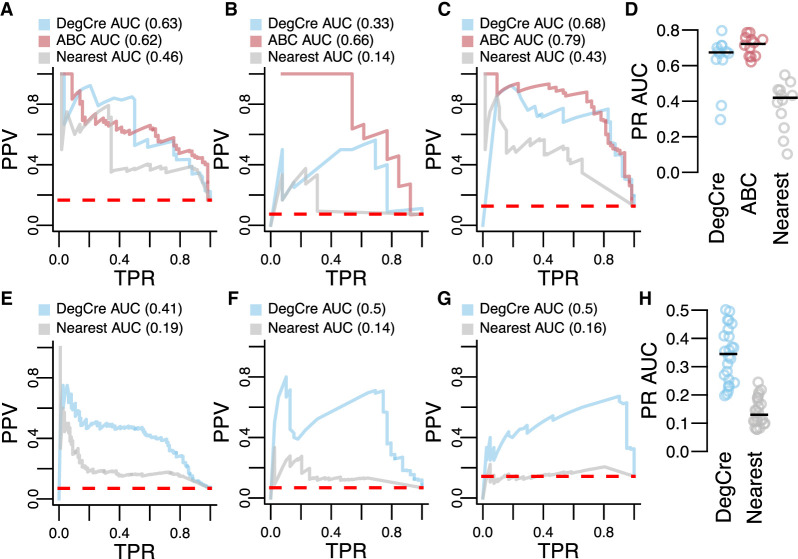
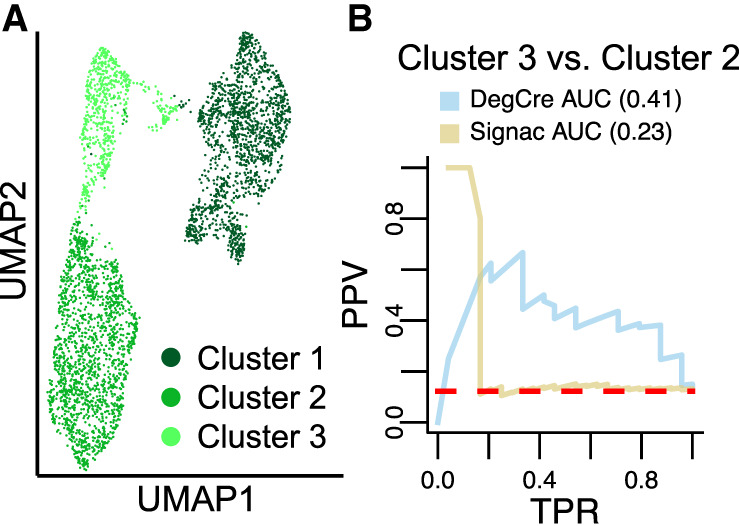
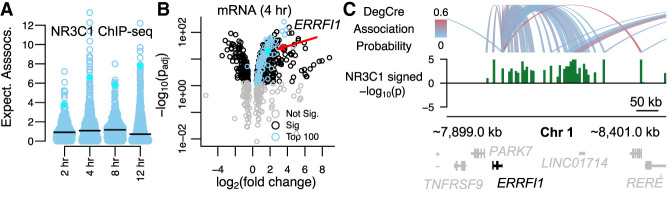
Differential gene expression in response to perturbations is mediated at least in part by changes in binding of transcription factors (TFs) and other proteins at specific genomic regions. Association of these cis-regulatory elements (CREs) with their target genes is a challenging task that is essential to address many biological and mechanistic questions. Many current approaches rely on chromatin conformation capture techniques or single-cell correlational methods to establish CRE-to-gene associations. These methods can be effective but have limitations, including resolution, gaps in detectable association distances, and cost. As an alternative, we have developed DegCre, a nonparametric method that evaluates correlations between measurements of perturbation-induced differential gene expression and differential regulatory signal at CREs to score possible CRE-to-gene associations. It has several unique features, including the ability to use any type of CRE activity measurement, yield probabilistic scores for CRE-to-gene pairs, and assess CRE-to-gene pairings across a wide range of sequence distances. We apply DegCre to six data sets, each using different perturbations and containing a variety of regulatory signal measurements, including chromatin openness, histone modifications, and TF occupancy. To test their efficacy, we compare DegCre associations to Hi-C loop calls and CRISPR-validated CRE-to-gene associations, establishing good performance by DegCre that is comparable or superior to competing methods. DegCre is a novel approach to the association of CREs to genes from a perturbation-differential perspective, with strengths that are complementary to existing approaches and allow for new insights into gene regulation.


Figures

Figure 1.
Figure 1.
Graphical overview of the DegCre algorithm. (A) DegCre requires as inputs differential P-values for CRE signal and differential gene expression (pCRE and pDEG). DegCre also needs genomic distances between CREs and TSSs (d) as input. The lightning bolt indicates a perturbation has occurred to yield the lower depiction. (B) DegCre defines all possible associations between each CRE and TSS within a specified maximum distance. (C) DegCre bins associations by their distance (d) according to a heuristic that balances resolution versus maintaining the pCRE distribution (Methods). (D) DegCre calculates a raw association probability, araw,i,j, for a given pCRE,j by finding the fraction of expected true DEGs in the set of associations in the same distance bin and with a pCRE equal to or less than (more significant) pCRE,i. Plot shows actual data from ATAC-seq at 120 min from Reed et al. (2022). (E) DegCre corrects the raw association probability if the association does not involve a true DEG. (F) For CREs with multiple associations (nearly all CREs), associations across larger genomic distances are penalized by the probabilities that the CRE is associated to nearer DEGs. (G). The false-discovery rate (FDR) of the association is calculated based on a binomial distribution that uses the bin null association probability, abin, as the success probability. Created with BioRender (https://www.biorender.com).
Figure 2.
Figure 2.
Characteristics of DegCre associations. (A) The black line in the upper panel half displays the number of DegCre associations per bin that pass FDR less than 0.05. The bottom panel displays the per bin DegCre association probability. The common x-axis shows for each bin the association distance from TSS to CRE. Each bin comprises a range of distances with the upper bound of that range plotted here. The black line indicates the median value for each bin, and the blue region indicates the interquartile range (IQR). The red line shows the per bin probability considering only the bin distance, used as the null in the DegCre FDR calculation (Methods). DegCre associations are shown from the ATAC-seq data at 2 h from Reed et al. (BG) Bars show the counts or fractions of ENCODE cCRE annotation overlaps for tested CREs having at least one significant (FDR less than 0.05) DegCre association. (B) Fractions are from McDowell et al. at 8 h for the indicated data types. (C) Fractions are shown for H3K27ac ChIP-seq data from McDowell et al. at 8 h, Reed et al. at 2 h, Savic et al. at 24 h, and Sanchez-Priego et al. (Cut and Run) from the H1 GABA late time point. (D) Counts for ZMYM3 CETCh-seq (discordant associations) from Hiatt et al. R1274W is a likely pathogenic mutation, and R688H is likely benign. (E–G) Counts of associations by time point are shown for ATAC-seq data from Reed et al. (E), ATAC-seq data from Sanchez-Priego et al. (F), and NR3C1 ChIP-seq data from McDowell et al. (G). Abbreviations for ENCODE cCREs are as follows: (PLS) promoter like sequence, (pELS) proximal enhancer-like sequence, and (dELS) distal enhancer like sequence.
Figure 3.
Figure 3.
Comparison of DegCre associations to Hi-C loops. (A) For ATAC-seq data from Reed et al. at the 120-min time point, DegCre associations with an FDR ≤ 0.05 and an association distance >20 kb are shown in black. Hi-C loops with an FDR ≤ 0.05 and a loop distance <1 Mb are shown in light red. Gene names in black indicate significant differential expression. Black arrows indicate distal CREs that both DegCre and Hi-C link to the VCAM1 TSS. The signal track (yellow) shows the −log10 of the differential ATAC signal multiplied by the sign of the log fold-change. (B) Same plotting conventions as A but the black arrow indicates a group of CREs for which DegCre and Hi-C assign the TSSs of different significant DEGs. (C) For ATAC-seq data, the blue bars indicate the number of Hi-C loops that have one anchor in a CRE with a significant (FDR < 0.05) DegCre association and that link to the TSS of the same DEG as the DegCre association. Red bars indicate the number of Hi-C loops that have one anchor in a CRE with a significant DegCre association and that link to the TSS of a different DEG from the DegCre association. (D) Same plotting conventions as C but for H3K27ac ChIP-seq data.
Figure 4.
Figure 4.
Evaluation of DegCre associations with CRISPR perturbations. (A–C) Precision-recall (PR) plots are presented with CRISPR data from Nasser et al. as the standard. (PPV) Positive predictive value (precision), (TPR) true-positive rate (recall). Dashed red line indicates “zero skill” performance. Predictions based on DegCre and ABC are shown in the indicated colors. A model in which a CRE is assigned to the nearest DEG (passing adjusted P-value cutoff), “nearest,” is shown in gray. DegCre and nearest predictions are based on data from Reed et al. H3K27ac ChIP-seq at 2 h (A), Savic et al. H3K27ac ChIP-seq at 48 h (B), and Reed et al. ATAC-seq at 2 h (C). (D) PR areas under curve (AUCs) are shown for each method for all data sets with greater than or equal to 25 associations positive by CRISPR. (EG) PR plots are presented with CRISPR data from Gasperini et al. as the standard with same conventions as A–C. Predictions are based on data from Reed et al. H3K27ac ChIP-seq at 2 h (E), Sanchez-Priego et al. H3K27ac Cut and Run from H1 GABA late (F), and Hiatt et al. ZMYM3 CETCh-seq with R1274W variant using anticorrelated analysis (G). (H) Same as D but for Gasperini et al. data.
Figure 5.
Figure 5.
Comparison of DegCre associations from single-nucleus multiomics to Signac. (A) UMAP representation of single-nucleus RNA-seq and ATAC-seq from neuronal precursor cell differentiation time course from Rogers et al. (B) PR curve using Gasperini et al. CRISPR data as the standard. (PPV) Positive predictive value (precision), (TPR) true-positive rate (recall). Dashed red line indicates “zero skill” performance. DegCre associations were calculated on pseudobulked RNA and ATAC data. Signac (Stuart et al.) was applied to single-nucleus data to generate linkage scores.
Figure 6.
Figure 6.
Identification of dexamethasone target genes with DegCre. (A) The boxplot shows the distribution of expected DegCre associations per significant DEG (FDR ≤ 0.05) based on NR3C1 ChIP-seq data from McDowell et al. The black line shows the median expected DegCre associations per DEG. The cyan points show values for ERRFI1. (B) The volcano plot shows the −log10 of the adjusted (Bonferroni) differential expression P-value versus the log2 fold-change. Blue dots indicate genes whose expected number of associations is in the top 100 of all significant DEGs. (C) The browser view shows DegCre associations (top panel) and NR3C1 ChIP-seq signal at 4 h for an established glucocorticoid pathway target gene, ERRFI1. The NR3C1 signal is plotted as –log10 of the differential P-value multiplied by the sign of the log fold-change. Regions of NR3C1 signal have been merged in some cases for better visibility at browser scale.

Similar articles

Cited by

References

    1. Adamson B, Norman TM, Jost M, Cho MY, Nuñez JK, Chen Y, Villalta JE, Gilbert LA, Horlbeck MA, Hein MY, et al. 2016. A multiplexed single-cell CRISPR screening platform enables systematic dissection of the unfolded protein response. Cell 167: 1867–1882.e21. 10.1016/j.cell.2016.11.048 - DOI - PMC - PubMed
    1. Bardy C, van den Hurk M, Eames T, Marchand C, Hernandez RV, Kellogg M, Gorris M, Galet B, Palomares V, Brown J, et al. 2015. Neuronal medium that supports basic synaptic functions and activity of human neurons in vitro. Proc Natl Acad Sci USA 112: E2725–E2734. 10.1073/pnas.1504393112 - DOI - PMC - PubMed
    1. Cao Q, Anyansi C, Hu X, Xu L, Xiong L, Tang W, Mok MTS, Cheng C, Fan X, Gerstein M, et al. 2017. Reconstruction of enhancer–target networks in 935 samples of human primary cells, tissues and cell lines. Nat Genet 49: 1428–1436. 10.1038/ng.3950 - DOI - PubMed
    1. Carleton JB, Ginley-Hidinger M, Berrett KC, Layer RM, Quinlan AR, Gertz J. 2020. Regulatory sharing between estrogen receptor α bound enhancers. Nucleic Acids Res 48: 6597–6610. 10.1093/nar/gkaa454 - DOI - PMC - PubMed
    1. Cholico GN, Nault R, Zacharewski TR. 2022. Genome-wide ChIPseq analysis of AhR, COUP-TF, and HNF4 enrichment in TCDD-treated mouse liver. Int J Mol Sci 23: 1558. 10.3390/ijms23031558 - DOI - PMC - PubMed

Publication types

MeSH terms