. 2024 Apr 17;7(7):e202402609.
doi: 10.26508/lsa.202402609. Print 2024 Jul.

Frataxin deficiency shifts metabolism to promote reactive microglia via glucose catabolism

Affiliations

Frataxin deficiency shifts metabolism to promote reactive microglia via glucose catabolism

Francesca Sciarretta et al. Life Sci Alliance. .

Abstract

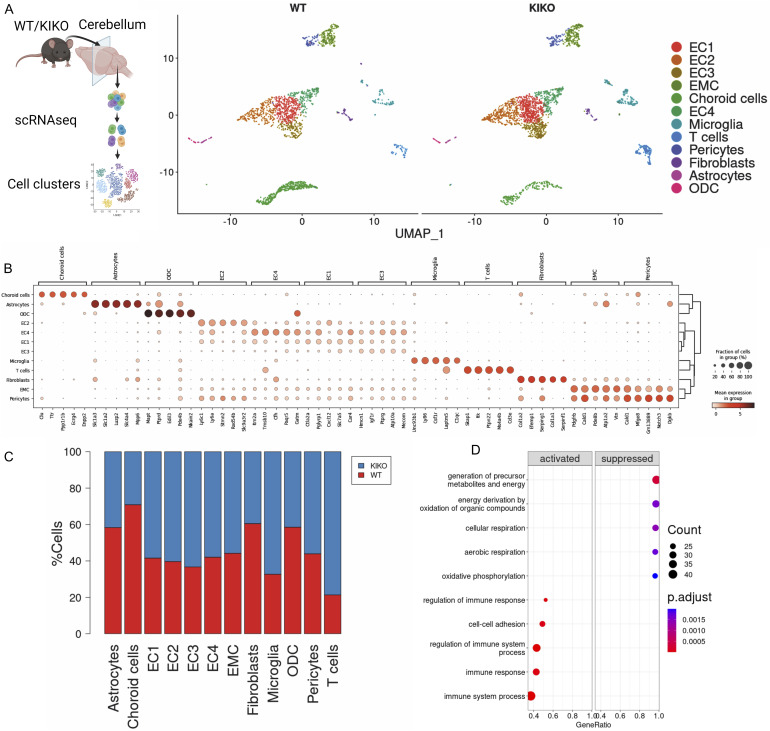
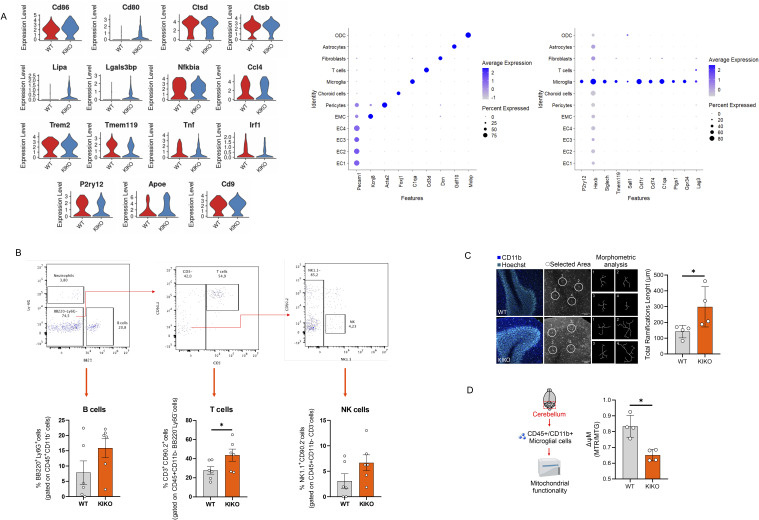
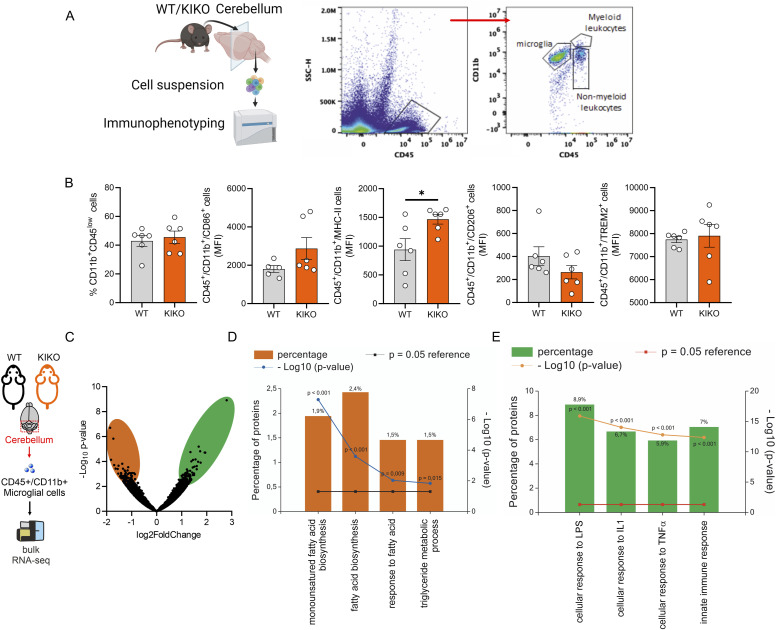
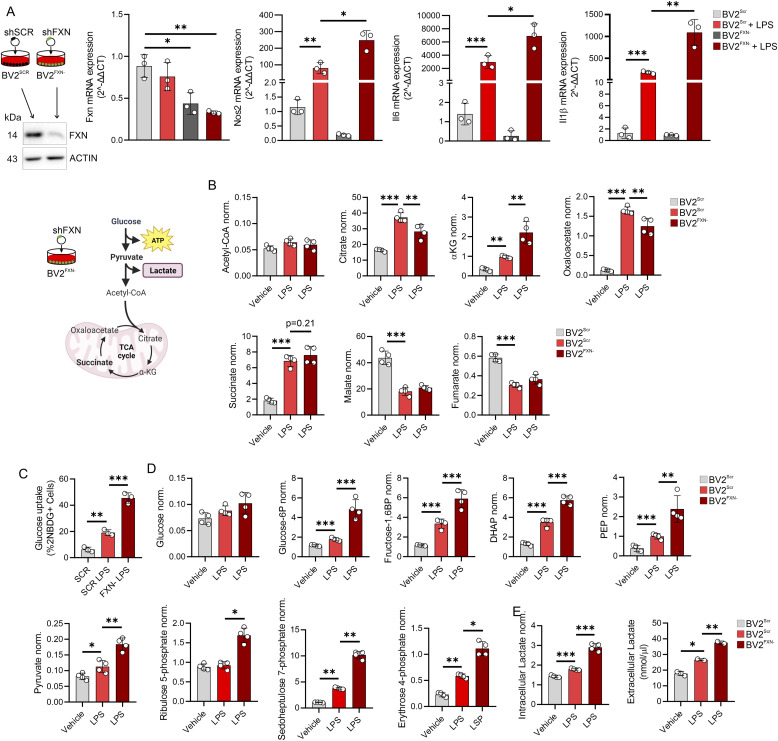
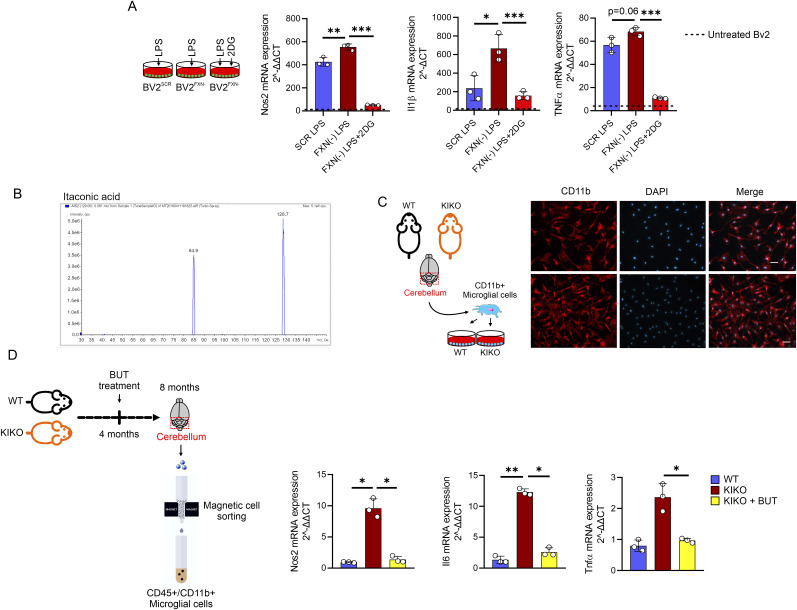
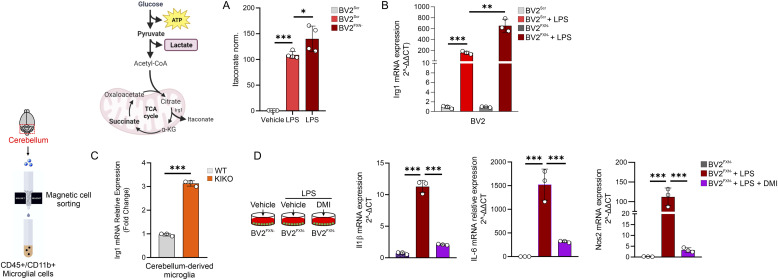
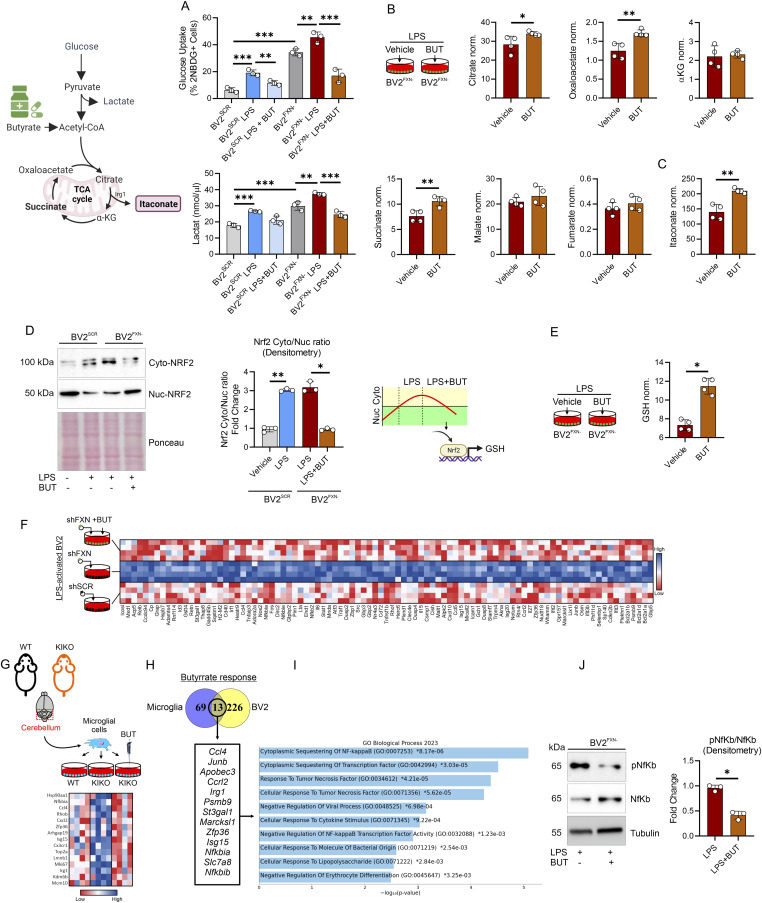
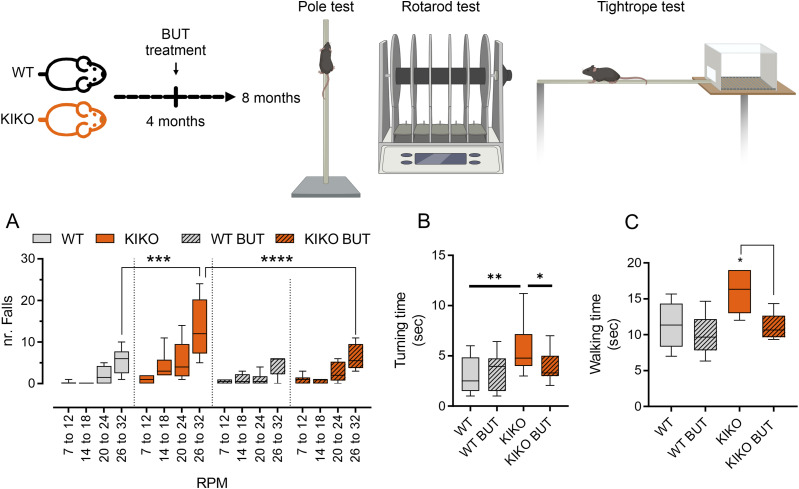
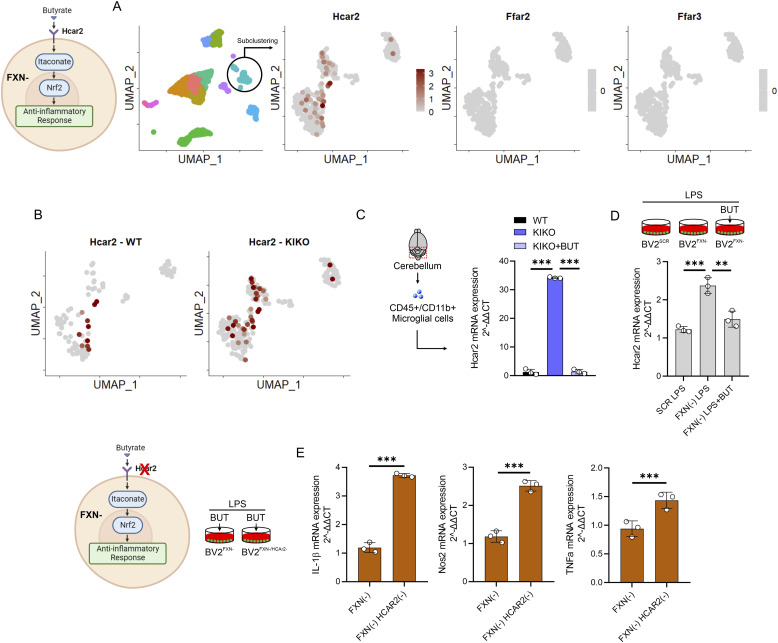
Immunometabolism investigates the intricate relationship between the immune system and cellular metabolism. This study delves into the consequences of mitochondrial frataxin (FXN) depletion, the primary cause of Friedreich's ataxia (FRDA), a debilitating neurodegenerative condition characterized by impaired coordination and muscle control. By using single-cell RNA sequencing, we have identified distinct cellular clusters within the cerebellum of an FRDA mouse model, emphasizing a significant loss in the homeostatic response of microglial cells lacking FXN. Remarkably, these microglia deficient in FXN display heightened reactive responses to inflammatory stimuli. Furthermore, our metabolomic analyses reveal a shift towards glycolysis and itaconate production in these cells. Remarkably, treatment with butyrate counteracts these immunometabolic changes, triggering an antioxidant response via the itaconate-Nrf2-GSH pathways and suppressing the expression of inflammatory genes. Furthermore, we identify Hcar2 (GPR109A) as a mediator involved in restoring the homeostasis of microglia without FXN. Motor function tests conducted on FRDA mice underscore the neuroprotective attributes of butyrate supplementation, enhancing neuromotor performance. In conclusion, our findings elucidate the role of disrupted homeostatic function in cerebellar microglia in the pathogenesis of FRDA. Moreover, they underscore the potential of butyrate to mitigate inflammatory gene expression, correct metabolic imbalances, and improve neuromotor capabilities in FRDA.


Conflict of interest statement

The authors declare that they have no conflict of interest.

Figures

Figure 1.
Figure 1.. Cerebellum in knock-in knock-out (KIKO) exhibits an immunometabolic disturbance.
(A) Cell clusters identified by single-cell RNA-seq of total cell fraction (TCF) isolated from cerebellum of WT and KIKO of 6-mo-old mice (TCF: pool from cerebellum of n = 4 mice/group). (B) Dot plots reporting gene markers for cell type identified by single-cell RNA-seq of TCF isolated from cerebellum of WT and KIKO of 6-mo-old mice (TCF: pool from cerebellum of n = 4 mice/group). (C) Bar plots reporting cell types identified by single-cell RNA-seq of TCF isolated from cerebellum of WT and KIKO of 6-mo-old mice (TCF: pool from cerebellum of n = 4 mice/group). (D) Gene Ontology terms for biological processes of differentially expressed genes revelated by single-cell RNA-seq of TCF isolated from cerebellum of WT and KIKO of 6-mo-old mice (TCF: pool from cerebellum of n = 4 mice/group).
Figure S1.
Figure S1.. Microglia-derived from cerebellum of knock-in knock-out (KIKO) mice show a reactive phenotype.
(A) Violin plots (left panel) and dot plots (right panel) reporting inflammatory gene expression in macrophages/microglia by single-cell RNA-seq of cerebellum of WT and KIKO of 6-mo-old mice (TCF: pool from cerebellum of n = 4 mice/group). (B) High dimension flow cytometry of T, B, and NK cell markers in cerebellum of WT and KIKO of 6-mo-old mice (n = 4/6 mice/group). Data were reported as mean ± SD. t test *P < 0.05. (C) Representative immunofluorescence image of CD11b+ cells in cerebellum of WT and KIKO of 6-mo-old mice (left panel). Ramifications lengths were measured by Sholl analysis, a plugin of ImageJ and mean value of 2/3 slide for mice was reported by histograms (right panel). Data were reported as mean ± SD. t test *P < 0.05. (D) Mitochondrial membrane potential in CD45+/CD11b+ cells isolated from WT and KIKO of 6-mo-old mice. Data were reported as mean ± SD. t test *P < 0.05.
Figure 2.
Figure 2.. Microglia-derived from cerebellum of knock-in knock-out (KIKO) mice shows an inflammatory phenotype.
(A, B) High dimensional flow cytometry of pro-inflammatory (CD86 and MHC-II) and anti-inflammatory (CD206 and Trem2) markers in microglial cells (CD4low+/CD11b+) isolated from cerebellum of WT and KIKO of 6-mo-old mice (n = 5/6 mice/group). Data were reported as mean ± SD. t test *P < 0.05. (C) Volcano plot of differentially expressed genes: −0.75 > Log2FC > +0.75; P < 0.05 in microglia isolated from 6-mo-old KIKO and WT mice (n = 4 mice/group). (D, E) Functional enrichment analysis for biological processes of down-regulated genes ((D) orange bars) and up-regulated genes ((E) green bars) in microglia isolated from 6-mo-old KIKO and WT mice (n = 4 mice/group).
Figure 3.
Figure 3.. Decreased frataxin increases glucose catabolism in microglial cells.
(A) BV2 cells were infected with lentiviral particles delivering shRNA against Fxn or Scr sequence and gene expression level of inflammatory genes (Nos2, Il6, and Il1β) were analyzed by qPCR. LPS (500 ng/ml for 16 h) was used to activate BV2 cells. Data were reported as mean ± SD. ANOVA test *P < 0.05; **P < 0.01; ***P < 0.001. (B) BV2 were cells infected with lentiviral particles delivering Fxn or Scr sequence and metabolites tracking TCA cycle were measured by LC-MS. LPS (500 ng/ml for 16 h) was used to activate BV2 cells. Data were reported as mean ± SD. ANOVA test **P < 0.01; ***P < 0.001. (C) BV2 cells infected with lentiviral particles delivering Fxn or Scr sequence were loaded 2NBDG for 30 min. Glucose uptake calculated as 2-NBDG+ cells by flow cytometry. LPS (500 ng/ml for 16 h) was used to activate BV2 cells. Data were reported as mean ± SD. ANOVA test **P < 0.01; ***P < 0.001. (D) BV2 were cells infected with lentiviral particles with shRNA against Fxn or Scr sequence and metabolites tracking glycolysis and pentose phosphate pathway were measured by LC-MS. LPS (500 ng/ml for 16 h) was used to activate BV2 cells. Data were reported as mean ± SD. ANOVA test *P < 0.05; **P < 0.01; ***P < 0.001. (E) BV2 were cells infected with lentiviral particles with shRNA against Fxn or Scr sequence and lactate production was measured by LC-MS (intracellular) or spectrophotometer (extracellular). LPS (500 ng/ml for 16 h) was used to activate BV2 cells. Data were reported as mean ± SD. ANOVA test *P < 0.05; **P < 0.01; ***P < 0.001.
Figure S2.
Figure S2.. Inhibition of glycolysis or butyrate treatment limit inflammatory response in microglia down-regulating frataxin.
(A) BV2 cells were infected with lentiviral particles delivering Scr or Fxn sequence and the inflammatory gene expression was analyzed by qPCR. LPS (500 ng/ml for 16 h) was used to activate BV2 cells. 2-deoxyglucose (2DG, 0.8 mM) was added 3 h before LPS treatment and maintained throughout the experiment. Data were reported as mean ± SD. ANOVA test *P < 0.05; **P < 0.01; ***P < 0.001. (B) MS/MS spectra and parameters setting on the instrument for itaconic acid MS/MS spectrum: declustering potential: −15.91 V; collision energy: −13.14 V; collision cell exit potential: −7.46 V; entrance potential: −4.72 V. (C) Representative fluorescence images of knock-in knock-out cerebellar microglia in culture stained with anti-Cd11b (red). Nuclei are marker with DAPI (blue). Scale bar, 20 μm. (D) Male WT and knock-in knock-out mice, aged 4 mo, were either maintained on a standard diet or supplemented with BUT for a duration of 16 wk, until they reached 8 mo of age. CD45+/CD11b+ cells isolated from cerebellum and the inflammatory gene expression was analyzed by qPCR. Data were reported as mean ± SD. ANOVA test *P < 0.05; **P < 0.01.
Figure 4.
Figure 4.. Itaconate overproduction restrains the inflammatory phenotype in Friedreich’s ataxia microglial cells.
(A, B) BV2 cells were infected with lentiviral particles delivering Fxn or Scr sequence and itaconate production (A) and Irg1 mRNA expression (B) were analyzed by LC-MS and qPCR, respectively. LPS (500 ng/ml for 16 h) was used to activate BV2 cells. Data were reported as mean ± SD. ANOVA test *P < 0.05; **P < 0.01; ***P < 0.001. (C) Microglial cells were isolated from cerebellum of 6-mo-old knock-in knock-out or WT mice by magnetic cell sorting (CD45+/CD11b+ cells) and Irg1 mRNA expression was analyzed by qPCR. Data were reported as mean ± SD. t test ***P < 0.001. (D) BV2 cells were infected with lentiviral particles delivering Fxn sequence and the inflammatory gene expression was analyzed by qPCR. LPS (500 ng/ml for 16 h) was used to activate BV2 cells. Dimethylitaconate (100 M) was added 3 h before LPS treatment and maintained throughout the experiment. Data were reported as mean ± SD. ANOVA test ***P < 0.001.
Figure 5.
Figure 5.. Butyrate rewires the immunometabolism of microglia with down-regulated frataxin (FXN).
(A) BV2 cells were infected with lentiviral particles delivering Fxn or Scr sequence and glucose uptake (upper panel) and lactate production (bottom panel) were measured by flow cytometry and spectrofluorometer, respectively. LPS (500 ng/ml for 16 h) was used to activate BV2 cells. Sodium butyrate (BUT, 500 μM) was added 3 h before LPS treatment and maintained throughout the experiment. Data were reported as mean ± SD. ANOVA test **P < 0.01; ***P < 0.001. (B, C) BV2 cells were infected with lentiviral particles delivering Fxn sequence and metabolites tracking TCA cycle (B) and itaconate (C) were measured by LC-MS. LPS (500 ng/ml for 16 h) was used to activate BV2 cells. Sodium butyrate (BUT, 500 μM) was added 3 h before LPS treatment and maintained throughout the experiment. Data were reported as mean ± SD. t test *P < 0.05; **P < 0.01. (D) BV2 cells were infected with lentiviral particles delivering Fxn or Scr sequence and cytosolic/nuclear fractions of NRF2 were analyzed by Western blot (left panel). Densitometry was calculated as Cyto-NRF2/Nuc-NRF2 (right panel). LPS (500 ng/ml for 16 h) was used to activate BV2 cells. Sodium butyrate (BUT, 500 μM) was added 3 h before LPS treatment and maintained throughout the experiment. Ponceau staining was used as loading control. (E) BV2 cells were infected with lentiviral particles delivering Fxn sequence and GSH and GSSG levels were measured by LC-MS. LPS (500 ng/ml for 16 h) was used to activate BV2 cells. Sodium butyrate (BUT, 500 μM) was added 3 h before LPS treatment and maintained throughout the experiment. Data were reported as mean ± SD. t test *P < 0.05. (F) Heat map of differentially expressed genes (P < 0.05) in BV2 cells infected with lentiviral particles delivering Fxn or scramble (Scr) sequence. LPS (500 ng/ml for 16 h) was used to activate BV2 cells. Sodium butyrate (BUT, 500 μM) was added 3 h before LPS treatment and maintained throughout the experiment. (G) Heat map of differentially expressed genes (P < 0.05) in microglia isolated from the cerebellum of WT and knock-in knock-out mice. Sodium butyrate (BUT, 500 μM) was added to the culture medium for 16 h. (H, I) Venn diagram of butyrate-responsive genes in LPS-stimulated BV2 and microglia isolated from knock-in knock-out mice (H) and the functional enrichment analysis of the overlapping genes was analyzed by EnrichR (I). (J) BV2 cells were infected with lentiviral particles delivering Fxn sequence and pospho-active and basal forms of NfKb were analyzed by Western blot (left panel). Densitometry was calculated as pNfKb/NfKb (right panel). Tubulin was used as loading control. LPS (500 ng/ml for 16 h) was used to activate BV2 cells. Sodium butyrate (BUT, 500 μM) was added 3 h before LPS treatment and maintained throughout the experiment.
Figure 6.
Figure 6.. Butyrate supplementation enhances neuromotor performance in knock-in knock-out mice.
Male WT and knock-in knock-out mice, aged 4 mo, were either maintained on a standard diet or supplemented with butyrate (BUT) for a duration of 16 wk, until they reached 8 mo of age. (A) Rotarod test performance, expressed by the number of falls, across various speeds. (B) Duration taken for the mice to turn during pole test atop the pole. (C) Time of walking during the tightrope test. Data are presented as mean ± SD. ANOVA *P < 0.05, **P < 0.01, ***P < 0.001, ****P < 0.0001 (n = 6 mice/group).
Figure 7.
Figure 7.. Hcar2 mediates the butyrate responses in the Friedreich’s ataxia microglia.
(A) Cerebellar microglial cells analyzed by scRNA-seq were subclustered and Hcar2, Ffar2, and Ffar3 expression levels were analyzed (pool of n = 4 mice/group). (B) Hcar2 expression levels in cerebellar microglia of 6-mo-old WT and knock-in knock-out (KIKO) mice (pool of n = 4 mice/group). (C) Microglia were isolated from cerebellum of WT, KIKO, or KIKO mice fed with butyrate and Hcar2 expression level was measured by qPCR (n = 3 mice/group). Data were reported as mean ± SD. ANOVA test ***P < 0.00. (D) BV2 cells were infected with lentiviral particles delivering Fxn or Scr sequence and mRNA expression of Hcar2 was measured by qPCR. LPS (500 ng/ml for 16 h) was used to activate BV2 cells. Sodium butyrate (BUT, 500 μM) was added 3 h before LPS treatment and maintained throughout the experiment. Data were reported as mean ± SD. ANOVA test **P < 0.01; ***P < 0.001. (E) BV2 FXN cells were infected with lentiviral particles delivering scramble (Scr) or Hcar2 RNAi sequence. Hcar2 expression levels and inflammatory cytokines expression level was measured by qPCR. Data were reported as mean ± SD. ANOVA test **P < 0.01; ***P < 0.001.

References

    1. Abdel-Haq R, Schlachetzki JCM, Glass CK, Mazmanian SK (2019) Microbiome-microglia connections via the gut-brain axis. J Exp Med 216: 41–59. 10.1084/jem.20180794 - DOI - PMC - PubMed
    1. Al-Mahdawi S, Pinto RM, Varshney D, Lawrence L, Lowrie MB, Hughes S, Webster Z, Blake J, Cooper JM, King R, et al. (2006) GAA repeat expansion mutation mouse models of Friedreich ataxia exhibit oxidative stress leading to progressive neuronal and cardiac pathology. Genomics 88: 580–590. 10.1016/j.ygeno.2006.06.015 - DOI - PMC - PubMed
    1. Anzovino A, Lane DJ, Huang ML, Richardson DR (2014) Fixing frataxin: ‘Ironing out’ the metabolic defect in Friedreich’s ataxia. Br J Pharmacol 171: 2174–2190. 10.1111/bph.12470 - DOI - PMC - PubMed
    1. Apolloni S, Parisi C, Pesaresi MG, Rossi S, Carri MT, Cozzolino M, Volonte C, D’Ambrosi N (2013) The NADPH oxidase pathway is dysregulated by the P2X7 receptor in the SOD1-G93A microglia model of amyotrophic lateral sclerosis. J Immunol 190: 5187–5195. 10.4049/jimmunol.1203262 - DOI - PubMed
    1. Apolloni S, Milani M, D’Ambrosi N (2022) Neuroinflammation in Friedreich’s ataxia. Int J Mol Sci 23: 6297. 10.3390/ijms23116297 - DOI - PMC - PubMed