. 2024 Apr 17;7(7):e202402659.
doi: 10.26508/lsa.202402659. Print 2024 Jul.

Autocrine VEGF drives neural stem cell proximity to the adult hippocampus vascular niche

Affiliations

Autocrine VEGF drives neural stem cell proximity to the adult hippocampus vascular niche

Tyler J Dause et al. Life Sci Alliance. .

Abstract

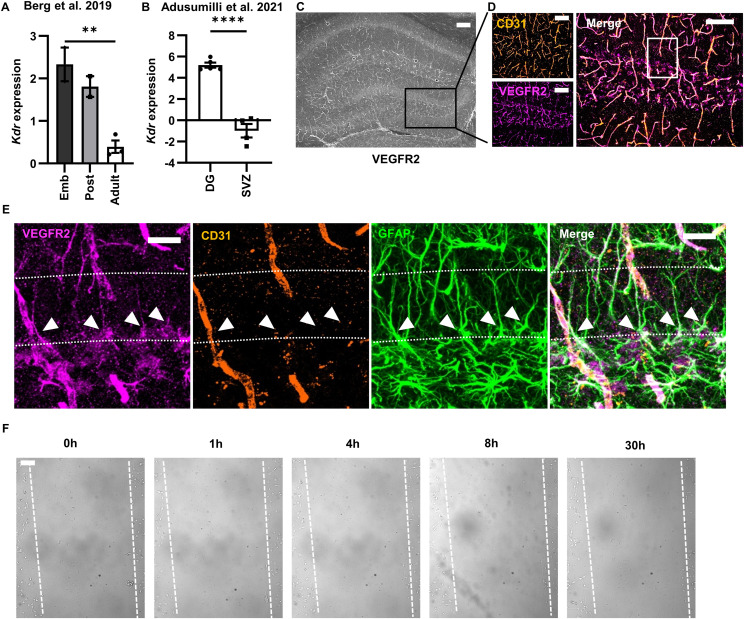
The vasculature is a key component of adult brain neural stem cell (NSC) niches. In the adult mammalian hippocampus, NSCs reside in close contact with a dense capillary network. How this niche is maintained is unclear. We recently found that adult hippocampal NSCs express VEGF, a soluble factor with chemoattractive properties for vascular endothelia. Here, we show that global and NSC-specific VEGF loss led to dissociation of NSCs and their intermediate progenitor daughter cells from local vasculature. Surprisingly, though, we found no changes in local vascular density. Instead, we found that NSC-derived VEGF supports maintenance of gene expression programs in NSCs and their progeny related to cell migration and adhesion. In vitro assays revealed that blockade of VEGF receptor 2 impaired NSC motility and adhesion. Our findings suggest that NSCs maintain their own proximity to vasculature via self-stimulated VEGF signaling that supports their motility towards and/or adhesion to local blood vessels.


Conflict of interest statement

The authors declare that they have no conflict of interest.

Figures

Figure 1.
Figure 1.. DG NSPCs and astrocytes express VEGF.
(A) Diagram of VEGF-GFP mouse model. (B) Representative immunofluorescent images of GFP, GFAP, and SOX2 in the DG. Dashed line shows granule cell layer. Solid box shows origin of subset images to the right of GFP+/GFAP+/SOX2+ RGL-NSCs (arrowhead), GFP+/GFAP/SOX2+ IPCs (chevron) and GFP+/GFAP+/SOX2+ astrocytes (arrow). (C) Percent of GFP+ cells of each phenotype: Astrocytes, RGL-NSCs, IPCs and other. N = 11 mice. (D) Percent of Astrocytes, NSCs, IPCs, and NB/IN that were GFP+. N = 11 mice. (E) Representative immunofluorescent image of GFP and Nestin immunolabeling in the DG of VEGF-GFP mice. Lower images show detail within box outlined in top images. Dashed line shows granule cell layer. (F) Vegfa in situ hybridization co-labeled with GFAP antibody in adult mouse DG. Subset images of Vegfa in situ hybridization co-labeled with GFAP antibody in adult mouse DG on the right. (G) Mean Vegfa RNA per cell in RGL-NSCs and astrocytes. N = 4 mice. Mean ± SEM plus individual mice shown throughout. Scale bars represent (B, E) 20 μm, (F) 50 μm, subset 10 μm *P < 0.05; **P < 0.01.
Figure S1.
Figure S1.. Vegfa expression across DG cell types and vessel association of random cells after VEGF iKD.
(A) Heat map of Vegfa expression from independently published RNA sequencing datasets (Hochgerner et al, 2018; Batiuk et al, 2020; Walker et al, 2020). (B) Vegfa expression across development in Hopx+ NSCs isolated from mouse DG and quantified via bulk RNA sequencing originally published in Berg et al (2019). N = 2–3 mice. (C) Vegfa expression of NesGFP+ NSPCs in the DG or SVZ quantified via bulk RNA sequencing originally published in Adusumilli et al (2021). N = 4–5 mice.
Figure 2.
Figure 2.. NSPC proximity to vessels is disrupted by broad shRNA-mediated VEGF knockdown.
(A) Diagram of experimental design. (B) Representative images of Scramble or Vegfa shRNA infection (GFP+) in the DG (Hoechst shows cell nuclei) 21 d after viral infusion. (C) Representative immunofluorescent images of shRNA expressing (GFP+) GFAP+SOX2+ RGL-NSCs and GFAP-SOX2+ IPCs and their association with the CD31+ vasculature 21 d after viral infusion. White dashes outline GFP+ RGL-NSCs, arrowheads indicate GFP+ IPCs. SGZ midline shown as grey dashed line. (D, E) Distance from nearest CD31+ vessel for WT or iKD GFP+ or GFP GFAP+SOX2+ RGL-NSCs (D) or GFAPSOX2+ IPCs (E) 21 d after viral infusion. Bars start at average distance for a random SGZ cell. N = 8 mice/group. Mean ± SEM plus individual mice shown. (F) Representative immunofluorescent images of CD31+ endothelia in the DG subregions. Dashed lines indicate borders between subregions. (G) Comparison of CD31 percent area in the DG subregions in scramble shRNA and Vegfa shRNA infused mice 21 d after surgery. Scale bars represent (B) 200 μm, (C) 10 μm, (F) 50 μm. ML, molecular layer; GCL, granule cell layer; SGZ, subgranular zone; HL, hilus. ***P < 0.001.
Figure 3.
Figure 3.. NSPC proximity to vessels is disrupted by induced NSPC-VEGF loss.
(A) Diagram of experimental design and timeline. (B) Diagram of vascular distance measurements in NSCs and progeny. (C) Distance from nearest CD31+ vessel for WT or iKD RGL-NSCs in SGZ. Bars start at average distance for a random SGZ cell. (D) Distance from nearest CD31+ vessel for WT or iKD IPCs in SGZ. Bars start at average distance for a random SGZ cell. (E) Representative immunofluorescent images of GFAP+EYFP+ RGL-NSCs (white dashed outline) and CD31+ endothelia 21 d after NSPC-VEGF knockdown. (F) Representative immunofluorescent images of MCM2+EYFP+ IPCs (arrowheads) and CD31+ endothelia 21 d after NSPC-VEGF knockdown. (G) Distance from nearest CD31+ vessel for WT or iKD BrdU+EYFP+ cells in SGZ. Bars start at average distance for a random SGZ cell. (H) Representative immunofluorescent images of BrdU+EYFP+ cells and CD31+ endothelia 21 d after NSPC-VEGF knockdown. Chevrons indicate BrdU+EYFP+ cells. (I) Comparison of the percent of RGL-NSCs with a radial process contacting the vasculature. (J) Representative immunofluorescent image of GFAP+EYFP+ RGL-NSC radial process contacting CD31+ endothelia in a WT mouse. White * indicate points of putative contact. Arrow indicates vascular contact. (K) Representative immunofluorescent images of DCX+EYFP+ neuroblasts (NB, horizontal morphology, arrows), immature neurons (IN, dendritic morphology, arrowheads) and CD31+ endothelia 21 d after NSPC-VEGF knockdown. (L) Distance from nearest CD31+ vessel for WT or iKD DCX+ NBs in SGZ. Bars start at average distance for a random SGZ cell. (M) Distance from nearest CD31+ vessel for WT or iKD DCX+ INs in SGZ. Bars start at average distance for a random SGZ cell. Mean ± SEM plus individual mice shown throughout. N = 10 WT, 12 iKD. Scale bars all represent 10 μm. *P < 0.05. (E, F, H, K) Grey dashed line indicates SGZ midline.
Figure 4.
Figure 4.. NSPC-VEGF knockdown does not detectably alter the DG vasculature.
(A) Representative immunofluorescent images of MCM2+ cells and CD31+ endothelia in WT and iKD mice. Dashed lines represent granular cell layer. (B) Representative immunofluorescent images of aCas3+ cells and CD31+ endothelia in WT and iKD mice. Arrowheads indicate aCas3+ cell. Dashed lines represent granular cell layer. (C) Representative immunofluorescent images of CD31+ endothelia in the DG subregions after NSPC-VEGF knockdown. Hoechst used to label cell bodies. Dashed lines indicate borders between subregions. (D) Comparison of CD31 percent area in the DG subregions in WT and iKD mice 21 d after TAM. (E) Representative immunofluorescent images of occludin+CD31+ endothelia in the DG subregions 21 d after TAM. Dashed lines indicate borders between subregions. (F) Comparison of percent of CD31+ area occupied by occludin labeling in the DG subregions in WT and iKD mice 21 d after TAM. Mean ± SEM shown throughout. N = 10 WT, 12 iKD mice. Scale bars represent 20 μm.
Figure 5.
Figure 5.. NSPC-VEGF regulates genes related to cell adhesion in vivo.
(A) Diagram of experimental design and timeline. N = 5 mice/genotype were pooled and sorted. (B) UMAP of WT and iKD cells yielded 11 subpopulations. Clusters are represented by different colors and phenotypes were assigned by gene expression and GO analysis of DEGs between clusters. (C) Dot plot visualization of average expression and percent of cells expressing genes related to quiescence, the cell cycle, neurogenic, and gliogenic fate. Average expression is a z-score. (D) UMAP showing clusters that included NSCs or IPCs, with WT and iKD cells shown as separate colors (left). GO biological process clusters that were differentially expressed in VEGF iKD NSC and IPC containing clusters (right). (E) Heat map of expression levels of top down-regulated genes associated with cell-substrate junction organization in WT and iKD NSC and IPC containing clusters. Values are log2 fold change of the average normalized transcript count in a group over the cluster average.
Figure S2.
Figure S2.. NSCs express VEGFR2.
(A) Kdr expression across development in Hopx+ NSCs isolated from mouse DG and quantified via bulk RNA sequencing originally published in Berg et al (2019). N = 2–3 replicates; mean ± SEM. **P < 0.01 in Berg et al original DEG analysis. (B) Kdr expression of NesGFP+ NSPCs in the DG or SVZ quantified via bulk RNA sequencing originally published in Adusumilli et al (2021). N = 4–5 replicates; mean ± SEM. ****P < 0.0001. (C) Representative image of VEGFR2 immunolabeling in the hippocampus of a wild-type adult mouse at low magnification. (D) Box shows the area detailed in (D). (D) Representative image of VEGFR2 and CD31 immunofluorescent co-labeling in the DG. (C) This is a higher magnification image of the same slice shown in (C). (E) Box shows the area detailed in (E). (E) Representative image of VEGFR2, CD31 and GFAP co-labeling in the DG. (D) This is an optical zoom-in of the same slice shown in (D). Arrowheads point to examples of GFAP+ VEGFR2+ overlap. Dashed line shows granule cell layer. (F) Representative images of NSCs maintained in quiescent conditions for 4 d after a scratch. Scratch borders are shown as dashed lines. Hours after scratch are shown above. Scale bars represent (C, D) 100 μm, (E) 20 μm, and (F) 100 μm.
Figure 6.
Figure 6.. NSC-VEGF regulates cell motility and attachment in vitro.
(A) Representative immunofluorescent image of VEGFR2 immunolabeling with Nestin. (B) Diagram of scratch assay experimental design in proliferative conditions. (C) Representative bright field images of NSC migration into scratch after SU5416 treatment or control after 1 and 8 h. Red line = scratch border. (D) Comparison of NSC ingression into scratch. Data normalized to initial scratch size such that 0 is no ingression and 1 is complete closure of the scratch area. N = 3 wells/experiment, three experiments. Mean ± SEM shown. Post hoc comparison between SU5416 and veh wells within time point shown as **. (E) Diagram of attachment assay in proliferative conditions. (F) Percent of cells remaining after accutase treatment in veh or SU5416-treated NSCs in proliferative conditions. Points are individual wells. Mean ± SEM also shown. N = 2–4 wells/treatment/experiment, three experiments. Main effect of treatment across experiments shown as **. (G) Representative Hoechst+ cell nuclei before and after accutase in vehicle and SU5416-treated wells. (H) Diagram of attachment assay after transition to quiescent conditions. (I) Percent of cells remaining after trypsin treatment in veh or SU5416-treated NSCs in quiescent conditions. Points are individual wells. Mean ± SEM also shown. Main effect of treatment across experiments shown as **. (J) Representative Hoechst+ cell nuclei before and after trypsin in vehicle and SU5416-treated wells. N = 4 wells/treatment/experiment, three experiments. Scale bars represent (A, C) 100 μm, (G, J) 1 mm. *P < 0.05, **P < 0.01.

Similar articles

Cited by

References

    1. Adusumilli VS, Walker TL, Overall RW, Klatt GM, Zeidan SA, Zocher S, Kirova DG, Ntitsias K, Fischer TJ, Sykes AM, et al. (2021) ROS dynamics delineate functional states of hippocampal neural stem cells and link to their activity-dependent exit from quiescence. Cell Stem Cell 28: 300–314.e6. 10.1016/j.stem.2020.10.019 - DOI - PMC - PubMed
    1. Babu H, Claasen J-H, Kannan S, Rünker AE, Palmer T, Kempermann G (2011) A protocol for isolation and enriched monolayer cultivation of neural precursor cells from mouse dentate gyrus. Front Neurosci 5: 89. 10.3389/fnins.2011.00089 - DOI - PMC - PubMed
    1. Batiuk MY, Martirosyan A, Wahis J, de Vin F, Marneffe C, Kusserow C, Koeppen J, Viana JF, Oliveira JF, Voet T, et al. (2020) Identification of region-specific astrocyte subtypes at single cell resolution. Nat Commun 11: 1220. 10.1038/s41467-019-14198-8 - DOI - PMC - PubMed
    1. Berg DA, Su Y, Jimenez-Cyrus D, Patel A, Huang N, Morizet D, Lee S, Shah R, Ringeling FR, Jain R, et al. (2019) A common embryonic origin of stem cells drives developmental and adult neurogenesis. Cell 177: 654–668.e15. 10.1016/j.cell.2019.02.010 - DOI - PMC - PubMed
    1. Bindea G, Mlecnik B, Hackl H, Charoentong P, Tosolini M, Kirilovsky A, Fridman W-H, Pagès F, Trajanoski Z, Galon J (2009) ClueGO: A cytoscape plug-in to decipher functionally grouped gene ontology and pathway annotation networks. Bioinformatics 25: 1091–1093. 10.1093/bioinformatics/btp101 - DOI - PMC - PubMed

MeSH terms