. 2024 Apr 17;10(1):180.
doi: 10.1038/s41420-024-01953-0.

PGC-1a mediated mitochondrial biogenesis promotes recovery and survival of neuronal cells from cellular degeneration

Affiliations

PGC-1a mediated mitochondrial biogenesis promotes recovery and survival of neuronal cells from cellular degeneration

Wenting You et al. Cell Death Discov. .

Abstract

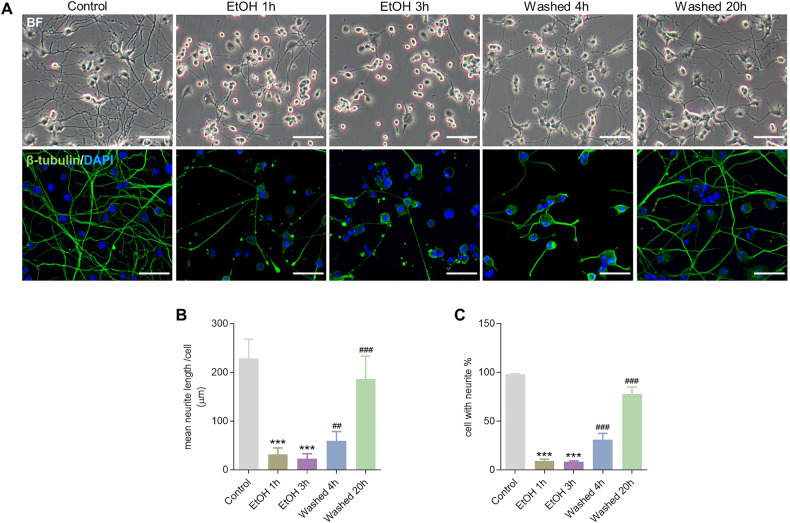
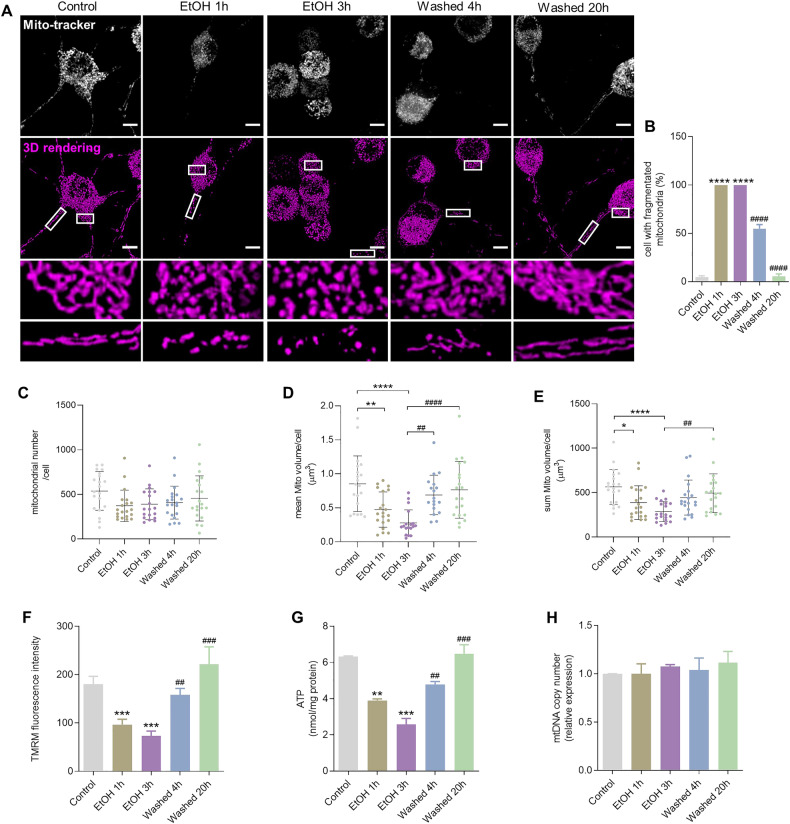
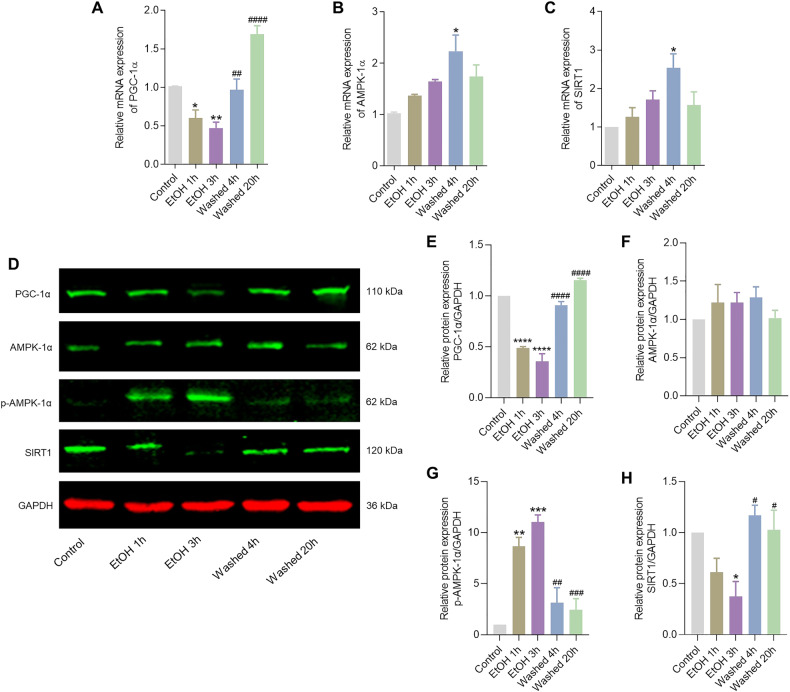
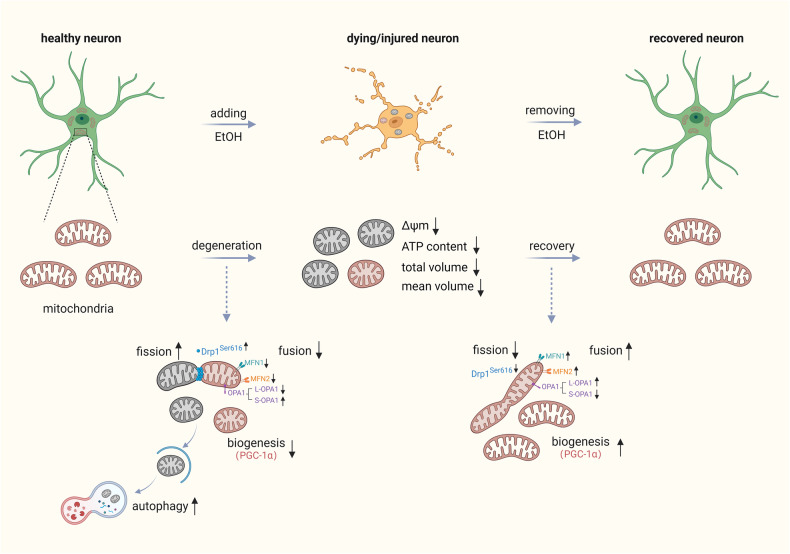
Neurodegenerative disorders are characterized by the progressive loss of structure and function of neurons, often including the death of the neuron. Previously, we reported that, by removing the cell death stimulus, dying/injured neurons could survive and recover from the process of regulated cell death, even if the cells already displayed various signs of cellular damage. Now we investigated the role of mitochondrial dynamics (fission/fusion, biogenesis, mitophagy) in both degeneration and in recovery of neuronal cells. In neuronal PC12 cells, exposure to ethanol (EtOH) induced massive neurite loss along with widespread mitochondrial fragmentation, mitochondrial membrane potential loss, reduced ATP production, and decreased total mitochondrial volume. By removing EtOH timely all these mitochondrial parameters recovered to normal levels. Meanwhile, cells regrew neurites and survived. Study of the mitochondrial dynamics showed that autophagy was activated only during the cellular degeneration phase (EtOH treatment) but not in the recovery phase (EtOH removed), and it was not dependent on the Parkin/PINK1 mediated mitophagy pathway. Protein expression of key regulators of mitochondrial fission, phospho-Drp1Ser616 and S-OPA1, increased during EtOH treatment and recovered to normal levels after removing EtOH. In addition, the critical role of PGC-1α mediated mitochondrial biogenesis in cellular recovery was revealed: inhibition of PGC-1α using SR-18292 after EtOH removal significantly impeded recovery of mitochondrial damage, regeneration of neurites, and cell survival in a concentration-dependent manner. Taken together, our study showed reversibility of mitochondrial morphological and functional damage in stressed neuronal cells and revealed that PGC-1α mediated mitochondrial biogenesis played a critical role in the cellular recovery. This molecular mechanism could be a target for neuroprotection and neurorescue in neurodegenerative diseases.


Conflict of interest statement

The authors declare no competing interests.

Figures

Fig. 1
Fig. 1. Reversible loss of neurites induced by EtOH in neuronal PC12 cells.
A Representative bright field (BF) and immunofluorescence images of 5% EtOH treatment (vol/vol, 1 and 3 h) induced neurite retraction, and its regeneration after washing EtOH (Washed, 4 and 20 h) in neuronal PC12 cells. Green: neuron-specific β-III tubulin; Blue: DAPI. Scale bar: 50 µm. B, C Quantification results of mean neurite length per cell and the percentage of cells with neurites. ***P < 0.001, vs. control group; ##P < 0.01, ###P < 0.001, vs. EtOH 3 h group. EtOH ethanol.
Fig. 2
Fig. 2. Reversible changes in mitochondrial morphology and function.
A Original fluorescence and 3D reconstruction images of Mito-tracker stained mitochondria in neuronal PC12 cells showed mitochondrial fragmentation induced by exposure to EtOH (5%, vol/vol, 1 and 3 h) and subsequent recovery of mitochondrial morphology after washing EtOH (Washed, 4 and 20 h). Scale bar: 20 µm. B Quantification result of the percentage of cells with mitochondrial fragmentation. Data are presented as mean ± SEM. ****P < 0.0001, vs. control group; ####P < 0.0001, vs. EtOH 3 h group. CE Quantification results of mitochondrial number, mean mitochondrial volume and total mitochondrial volume per cell. Data are presented as mean ± SD. *P < 0.05, **P < 0.01, ****P < 0.0001, vs. control group; ##P < 0.01, ####P < 0.0001, vs. EtOH 3 h group. F Quantification of mean fluorescence intensity stained with TMRM. Data are presented as mean ± SEM. ***P < 0.001, vs. control group; ##P < 0.01, ###P < 0.001, vs. EtOH 3 h group. G ATP content (nmol/mg protein) in neuronal PC12 cells. Data are presented as mean ± SEM. **P < 0.01, ***P < 0.001, vs. control group; ##P < 0.01, ###P < 0.001, vs. EtOH 3 h group. H The relative mtDNA copy number estimated with qPCR measurement. Data are presented as mean ± SEM. EtOH ethanol.
Fig. 3
Fig. 3. Ultrastructure of mitochondria revealed by transmission electron microscopy in neuronal PC12 cells.
A Representative images of mitochondrial ultrastructure of neuronal PC12 cells showed EtOH (5%, vol/vol, 1 and 3 h) induced mitochondrial changes such as fragmentation and swelling, and mitochondrial recovery after washing EtOH (Washed, 4 and 20 h). Scale bar: 0.5 µm. B The percentage of mitochondria which appeared as tubes or large and small globes in the sections. CE Quantification of mitochondria related parameters, including mitochondrial length, perimeter, and area per mitochondrion. At least 300 mitochondria were quantified in each group. Data are presented as mean ± SD. ***P < 0.001, vs. control group; ###P < 0.001, vs. EtOH 3 h group. EtOH ethanol.
Fig. 4
Fig. 4. Autophagy is activated during EtOH treatment, but not in the recovery process.
AD Protein expression of LC3-I/II, p62, Parkin, PINK1 in neuronal PC12 cells detected by western blot. GAPDH was used as a loading control. E Immunofluorescence images represent LC3 dots (green) and nuclei (blue) in neuronal PC12 cells. Scale bar: 10 µm. F, G Quantification of the number of LC3 dots per cell and the percentage of cells with LC3 dots. Data are presented as mean ± SEM. ****P < 0.0001, vs. control group. H Electron microscopy showed autophagy induced by EtOH (5%, vol/vol, 1 and 3 h) in neuronal PC12 cells. The arrows point to the autophagosome (double membrane) and autolysosome (single membrane). Scale bar: 1 µm. I, J Quantification of the number of LC3 dots per cell. Data are presented as mean ± SEM. ***P < 0.001, ****P < 0.0001, vs. control group. ####P < 0.000, vs. EtOH 1 h group. ^^P < 0.01, ^^^^P < 0.0001, vs. EtOH 3 h group. KN Quantification results of mean neurite length per cell, the percentage of cell with neurite, the percentage of cells with fragmented mitochondria, and TMRM mean fluorescence intensity, which show that the autophagy inhibitor 3-MA had no inhibitory effect on the cell recovery from EtOH induced damage. EtOH ethanol.
Fig. 5
Fig. 5. Changes in regulators of mitochondrial fusion/fission in the process of cellular degeneration and recovery.
AD mRNA expression of Drp1, OPA1, MFN1, and MFN2 measured by qPCR in neuronal PC12 cells. Data are presented as mean ± SEM. *P < 0.05, **P < 0.01, vs. control group; #P < 0.05, ##P < 0.01, ###P < 0.001, vs. EtOH 3 h group. EK Protein expression of Drp1, p-Drp1 (Ser616), p-Drp1 (Ser637), OPA1, MFN1, and MFN2 in neuronal PC12 cells detected by Western blot. Data are presented as mean ± SEM. *P < 0.05, **P < 0.01, ***P < 0.001, vs. control group; #P < 0.05, ##P < 0.01, ###P < 0.001, vs. EtOH 3 h group. L Immunofluorescence images showed that Drp1 signals were diffused in the cytosol before EtOH treatment. After applying EtOH for 3 h, the signals became more punctate and appeared to be translocated to the mitochondria. After removing EtOH by washing, the Drp1 signals were again diffused throughout the cytosol. Mitochondria and Drp1 were stained with TOM20 antibody (red) and Drp1 antibody (green) separately. Scale bar: 10 µm. EtOH ethanol.
Fig. 6
Fig. 6. Changes in PGC-1α mediated mitochondrial biogenesis in the process of cellular degeneration and recovery.
AC mRNA expression of PGC-1α, AMPK-1α, SIRT1 in neuronal PC12 cells measured by qPCR. Data are presented as mean ± SEM. *P < 0.05, **P < 0.01, vs. control group; ##P < 0.01, ####P < 0.0001, vs. EtOH 3 h group. DH Protein expression of PGC-1α, AMPK-1α, p-AMPK-1α, and SIRT1 in neuronal PC12 cells detected by western blot. Data are presented as mean ± SEM. *P < 0.05, **P < 0.01, ***P < 0.001, ****P < 0.0001, vs. control group; #P < 0.05, ##P < 0.01, ###P < 0.001, ####P < 0.0001, vs. EtOH 3 h group. EtOH ethanol.
Fig. 7
Fig. 7. The inhibition effect of SR-18292 on the cell survival and neurite regrowth from EtOH induced damage in neuronal PC12 cells.
Bright field images of neuronal PC12 cells with or without EtOH treatment for 3 h, and after washing EtOH then further culturing cells in fresh medium for another 4 or 20 h with or without different concentration of SR-18292 (50, 75, 100 µM). EtOH ethanol.
Fig. 8
Fig. 8. Inhibitory effect of SR-18292 on cell survival and recovery from EtOH induced damage in neuronal PC12 cells.
AC Quantification of cell viability, the percentage of cells with neurites, and the mean neurite length per cell in neuronal PC12 cells treated alone with different concentration of SR-18292 (50, 75, 100 µM) for 4 and 20 h. Data are presented as mean ± SEM. *P < 0.05, vs. control group. DF Quantification of cell viability, the percentage of cells with neurites, and the mean neurite length per cell in neuronal PC12 cells with corresponding treatment. Data are presented as mean ± SEM. ****P < 0.0001, vs. control group; ##P < 0.01, ####P < 0.0001, vs. EtOH 3 h group; ^^^^P < 0.0001, vs. Washed 4 h group; !!!!P < 0.0001, vs. Washed 20 h group. G, H Quantification of the percentage of cells with fragmented mitochondria and the TMRM mean fluorescence intensity in neuronal PC12 cells treated alone with different concentrations of SR-18292 (50, 75, 100 µM) for 4 and 20 h. I, J Quantification of cell viability, the percentage of cells with neurites, and the mean neurite length per cell in neuronal PC12 cells with corresponding treatment. Data are presented as mean ± SEM. ****P < 0.0001, vs. control group; ####P < 0.0001, vs. EtOH 3 h group; ^^^^P < 0.0001, vs. Washed 4 h group; !!!!P < 0.0001, vs. Washed 20 h group.
Fig. 9
Fig. 9. Illustration of mitochondrial dynamics during degeneration and recovery of neuronal PC12 cells.
EtOH treatment for 3 h already induced cellular changes and damage such as reactive oxygen species generation, elevation of intracellular Ca2+, phosphatidylserine exposure, nuclear shrinkage, DNA damage, mitochondrial fragmentation and mitochondrial membrane potential loss, and retraction of neurites [17]. These phenomena are often associated with regulated cell death. Importantly, after removing ethanol and further culturing the dying cells in fresh culture medium, cells recovered from all these cellular injuries and generated new neurites. In the phase of EtOH induced cellular degeneration, the expression of phospho-Drp1Ser616 and S-OPA1 that are related to mitochondrial fission were increased. The expression of MFN1, MFN2, L-OPA1, and PGC-1α that are related to mitochondrial fusion and biogenesis were decreased. Meanwhile, autophagy was activated. In the phase of cellular recovery after removing EtOH, mitochondrial fusion and biogenesis increased and recovered. Inhibiting mitochondrial biogenesis by PGC-1α inhibitor SR-18292 showed remarkable inhibition of not only recovery of mitochondria, but also of neurite regeneration and cell survival. These results indicate that PGC-1α mediated mitochondrial biogenesis may be a potential target for rescuing dying/injured neurons in neurodegenerative diseases.

References

    1. Nunnari J, Suomalainen A. Mitochondria: in sickness and in health. Cell. 2012;148:1145–59. doi: 10.1016/j.cell.2012.02.035. - DOI - PMC - PubMed
    1. Sokolova I. Mitochondrial adaptations to variable environments and their role in animals’ stress tolerance. Integr Comp Biol. 2018;58:519–31. doi: 10.1093/icb/icy017. - DOI - PubMed
    1. Quintana-Cabrera R, Scorrano L. Determinants and outcomes of mitochondrial dynamics. Mol Cell. 2023;83:857–76. doi: 10.1016/j.molcel.2023.02.012. - DOI - PubMed
    1. Kraus F, Roy K, Pucadyil TJ, Ryan MT. Function and regulation of the divisome for mitochondrial fission. Nature. 2021;590:57–66. doi: 10.1038/s41586-021-03214-x. - DOI - PubMed
    1. Pernas L, Scorrano L. Mito-morphosis: mitochondrial fusion, fission, and cristae remodeling as key mediators of cellular function. Annu Rev Physiol. 2016;78:505. doi: 10.1146/annurev-physiol-021115-105011. - DOI - PubMed