. 2024 Apr 17;15(4):273.
doi: 10.1038/s41419-024-06654-1.

TAK1 inhibition leads to RIPK1-dependent apoptosis in immune-activated cancers

Affiliations

TAK1 inhibition leads to RIPK1-dependent apoptosis in immune-activated cancers

Helene Damhofer et al. Cell Death Dis. .

Abstract

Poor survival and lack of treatment response in glioblastoma (GBM) is attributed to the persistence of glioma stem cells (GSCs). To identify novel therapeutic approaches, we performed CRISPR/Cas9 knockout screens and discovered TGFβ activated kinase (TAK1) as a selective survival factor in a significant fraction of GSCs. Loss of TAK1 kinase activity results in RIPK1-dependent apoptosis via Caspase-8/FADD complex activation, dependent on autocrine TNFα ligand production and constitutive TNFR signaling. We identify a transcriptional signature associated with immune activation and the mesenchymal GBM subtype to be a characteristic of cancer cells sensitive to TAK1 perturbation and employ this signature to accurately predict sensitivity to the TAK1 kinase inhibitor HS-276. In addition, exposure to pro-inflammatory cytokines IFNγ and TNFα can sensitize resistant GSCs to TAK1 inhibition. Our findings reveal dependency on TAK1 kinase activity as a novel vulnerability in immune-activated cancers, including mesenchymal GBMs that can be exploited therapeutically.


Conflict of interest statement

TH, PFH, and SS are co-founders of Eydisbio Inc, a startup company that has licensed the patents related to the HS-276 molecule, used in this study. SP is a co-founder and scientific advisor to Cellinta Ltd. KH is a co-founder of Dania Therapeutics, and a scientific advisor to Hannibal Innovation. BS is now employed as a Senior Bioinformatician at Zifo RnD solutions. TH, PFH, and SS are co-inventors of three US patent filings related to the HS-276 scaffold. The remaining authors declare no competing interests.

Figures
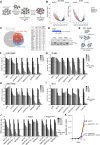
Fig. 1
Fig. 1. CRISPR/Cas9 knockout screens identify a MAP3K7/TAK1 dependency in a subset of GSCs.
A Schematic of drop-out screen using a custom lentiviral sgRNA Epi-library in glioma stem cells. B Volcano plot representing log2 fold change and −log10 adjusted p-value of each sgRNA abundance comparing final (day 38 or day 35) and reference (day 0) time point in U3013MG or G166 GSC. Positive (essential genes) and negative (non-targeting) control sgRNAs are colored in red and blue, respectively. Dotted lines indicate cut-off used for hit selection. C Venn diagram showing overlap of hits identified in the two GSC screens and common essential genes based on DepMap data (Archilles common essential, version 22Q1). Table shows log2 fold change depletion of best sgRNA of the 19 gene hits in GSCs not essential. Ranking was performed based on the median gene dependency score of CRISPR screens from all DepMap cell lines. D Western blot of U3013MG iCas9 cells showing loss of TAK1 protein 72 h after doxycycline(dox)-induced expression of Cas9. E Cartoon depicting experimental setup of competitive growth assay in iCas9 GSCs. FI Barplot of competitive growth assay in iCas9 GSCs. Percentage of BFP-positive cells in population was measured by flow cytometry and depicted relative to wells without Cas9 induction (- dox) at each passage. sgNC (non-targeting control sgRNA), sgCTR (targeting control sgRNA cutting outside a coding gene), sgPRMT5/sgMCM2 (essential gene positive control sgRNAs). J Competitive growth assay with complementation by overexpression of wild type TAK1, or catalytically inactive TAK1K36W mutant. K Cumulative growth assay in ctr (sgCTR) and TAK1 knockout cells (sgMAP3K7) with complementation by overexpression of wild type TAK1, or catalytically inactive TAK1K36W mutant.
Fig. 2
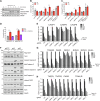
Fig. 2. MAP3K7 deletion leads to induction of RIPK1-dependent apoptosis via TNFR1 signaling.
A Representative western blots for the indicated proteins of time course experiment of sgMAP3K7_32 expressing U3013MG iCas9 cells upon induction of Cas9 by dox treatment for up to 7 days. BD Barplot of % Annexin V positive cells (B and D) or Caspase-FITC cells (C) quantified by flow cytometry 4 days after induction of TAK1 knockout (dox). E Competitive growth assays showing %TAK1 knockout cells over time in the population (measure by BFP abundance) in the presence of a second sgRNA targeting Caspases-1, -8, and -9. sgRNA including gene name is shown on the x-axis. Percentage of BFP-positive cells in population was measured by flow cytometry and depicted relative to wells without Cas9 induction (- dox) at each passage. Dotted line indicates the effect of TAK1 depletion on the population in the presence of a second non-targeting sgRNA (NC). Error bar indicating mean + SD for 3 biological replicates at each time point. F Western blots of different apoptosis markers 4 days after induction of Cas9 expression with doxycycline (dox) in sgCTR, sgMAP3K7_15 and sgMAP3K7_32 expressing cells. G, H Competitive growth assay as (E) with second sgRNAs targeting different apoptosis complex members (G) or death receptor genes (H).
Fig. 3
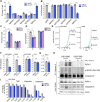
Fig. 3. TAK1-degradation leads to RIPK1-dependent apoptosis.
A Schematic cartoon of TAK1 depletion using a dTAG-TAK1 degradation system. B Western blots of time course experiment treating dTAG-TAK1 GSCs with 100 nM dTAGV-1 ligand for indicated amount of time. C Barplot of total % Annexin V positive cells quantified by flow cytometry after treatment with 100 nM dTAGV-1 ligand. 2 biological replicates at each time point are shown. Early apoptotic cells are defined as Annexin V + /DAPI- and late apoptotic cells as Annexin V + /DAPI+. D Western blot of apoptosis markers 24 h after treatment with 100 nM dTAGV-1 ligand. E Barplot of total % Annexin V positive cells quantified by flow cytometry after treatment with 100 nM dTAGV-1 ligand for 4 days in dTAG-TAK1 degron cells after knockout of indicated gene. F Barplot of competitive growth assay of dTAG-TAK1 cells expressing BFP and parental GSCs. Fold change of %BFP-positive cells in population after treatment with dTAGV-1 ligand for 7 days is shown relative to DMSO-treated control. G Cumulative growth assay in dTAG- TAK1 degron cells upon knockout of the second indicated gene by CRISPR and treatment with dTAGV-1 ligand. H Barplot depicting fold change of %BFP-positive dTAG-TAK1 cells in population after treatment with dTAGV-1 ligand for 7 days relative to DMSO-treated control and treatment with increasing concentrations of TNF ligand blocking antibody Etanercept. I Western blot of RIPK1 phosphorylation events after treatment with TNFα with or without TAK1 protein depletion. *denotes unspecific band. J Cartoon of molecular response to TAK1 inhibition in TAK1-dependent GSCs.
Fig. 4
Fig. 4. Pharmacological inhibition with novel selective TAK1 inhibitor HS-276 induces apoptosis in GSCs.
A, B Barplot of %Annexin V positive cells (A) and fold cell expansion (B) of U3013MG cells with knockout of TNFR pathway members upon 4 days treatment with DMSO or 3 µM HS-276. C, D Barplot of %Annexin V positive cells (C) and fold cell expansion (D) of U3013MG cells treated for 4 days with HS-276 or Takinib in combination with RIPK1 inhibitor Necrostatin-1s (Nec-1s). E Cumulative growth assay of U3013MG or G166 cells treated with DMSO, HS-276, or a combination of HS-276 and Nec-1s. F Barplot of fold cell expansion within 4 days of treatment with DMSO or 3 µM HS-276 in 4 different glioma stem cell lines (U3013MG, G166, U3017MG, and G14). G Barplot of fold cell expansion within 4 days of treatment with DMSO or 3 µM HS-276 in fetal neural stem cells (fNSC, U5). H Western blot of death complex IIb formation in GSCs upon treatment with TNFα and HS-276 for 2 or 4 h. I Barplot of cell viability relative to DMSO in U3013MG cells treated with indicated chemotherapeutic drugs in increasing concentrations alone or in combination with HS-276 for 4 days.
Fig. 5
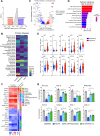
Fig. 5. TAK1 inhibitor sensitive GSCs are characterized by high cytokine/interferon signaling gene expression signatures.
A Heatmap showing % growth inhibition expressed as the relative reduction in cell numbers after 4 days of treatment with HS-276 relative to mean of DMSO-treated controls in 12 GSC lines. GSCs are classified as sensitive (red) or insensitive (blue) based on a significant difference between cell numbers in HS-276 and DMSO treatment conditions. Shown are representative results of 3 biological replicates. Heatmap to the right shows GSVA score of gene expression signature from cell line for mesenchymal, proneural, or classical GBM subtype. B Principal component analysis plot (PCA) of RNAseq data from GSC lines. HS-276 sensitive lines are shown in red, insensitive ones in blue. C Volcano plot of differentially expressed genes between sensitive and insensitive GSC lines (n = 6 in each group). Significantly higher expressed genes in sensitive GSCs are colored in red, lower expressed genes in blue, and unchanged in gray. Dotted lines indicate cut-off value used to determine deregulated genes (absolute log2 Fold Change of >1 and adjusted p-value of <0.1). D Barplot of the 12 most significantly enriched Hallmark gene signatures in GSCs sensitive to HS-276 treatment (gene set high, n = 513). E Box and wiskers plot of log2 normalized read counts of baseline expression of selected interferon-stimulated genes (ISGs) in sensitive (n = 6) and insensitive GSCs (n = 6) measured by RNAseq. Whiskers show minimum and maximum values within group. Boxes indicate median, upper, and lower quartiles. F ELISA of TNFα concentration in 7 days conditions GSCs supernatant (6 biological replicates). nd = not detected. G Barplot of IFNB1, IFNG, and TNF gene expression in GSCs measured by qPCR and normalized to RPLP0. H Barplot of fold cell expansion of U3013MG treated for 4 days with indicated drugs. I Heatmap of GSVA scores in GCGR-GSC lines. Samples were ranked based on sensitivity signature GSVA score. ID, GCGR patient ID. * indicates GSC lines selected for testing of responsiveness to HS-276 in vitro. J Scatter plot of % growth in 14 GCGR GSCs after 4 days of treatment with HS-276 relative to DMSO against the sensitivity signature GSVA score. Shown is the relative mean of 3 biological replicates (HS-276/DMSO treated). GSCs with significant reduction in cell numbers upon HS-276 treatment are indicated in red. Dotted line indicates separation based on GSVA score into predicted sensitive (positive score) and predicted insensitive (negative score) GSCs and 25% in growth reduction for sensitivity to TAK inhibition by HS-276 treatment. K Scatter plot of MAP3K7 gene knockout effect against sensitivity signature GSVA score from 59 DepMap glioma cell lines.
Fig. 6
Fig. 6. Combined IFNg and TNFa pathway activation is required to sensitize GSCs to TAK1 inhibition.
A CD44 surface staining of U3017MG treated for 3 days with indicated cytokines. B qPCR of ISGs, mesenchymal, or proneural marker gene expression after cytokine treatment. Error bar indicates mean +/− SD of 2 technical replicates. C, D Fold cell expansion of U3017MG cells pre-treated for 3 days with indicated cytokines followed by 4 days of DMSO or HS-276. E Effect of HS-276 treatment on fold cell expansion of 4 proneural GSCs after pre-treatment with indicated cytokines. F qPCR of ISG expression in U3013MG cells after 48 h of Ruxolitinib treatment. G Fold cell expansion and %Annexin V positive cells in U3013MG cells pre-treated with Ruxolitinib followed by 4 days of HS-276.
Fig. 7
Fig. 7. High immune signaling activation is a common feature of TAK1-dependent cancer cell lines.
A Histogram of MAP3K7 dependency gene score from 1070 cancer cell lines. Highlighted are lines most sensitive (red) or insensitive (blue) to MAP3K7 depletion. B Heatmap of cell line frequencies in sensitive, insensitive, or other group plotted over different primary disease categories. * indicates significant enrichment in group with p < 0.05 (Fisher’s exact test). C Volcano plot of differentially expressed genes between sensitive (n = 47) and insensitive (n = 51) cancer lines. Significantly higher expressed genes in sensitive cell lines are colored in red, lower expressed genes in blue, and unchanged in gray. Dotted lines indicate cut-off value used to determine deregulated genes (absolute log2 Fold Change of >1 and adjusted p-value of <0.1). D Barplot of the 10 most significantly enriched Hallmark gene signatures highly expressed in lines sensitive to MAP3K7 depletion (gene set high, n = 656). E Violin plot of selected genes differentially expressed between cancer cell lines sensitive and insensitive to MAP3K7 depletion. F Heatmap of HS-276 effect on cell growth in 23 cancer cell lines with DepMap gene dependency score and lineage information. G Barplot of fold cell expansion in 8 TAKi sensitive cell lines with Etanercept and Nec-1s cotreatment.

References

    1. Ostrom QT, Cioffi G, Gittleman H, Patil N, Waite K, Kruchko C, et al. CBTRUS statistical report: primary brain and other central nervous system tumors diagnosed in the United States in 2012-2016. Neuro Oncol. 2019;21:v1–v100. doi: 10.1093/neuonc/noz150. - DOI - PMC - PubMed
    1. Wen PY, Weller M, Lee EQ, Alexander BM, Barnholtz-Sloan JS, Barthel FP, et al. Glioblastoma in adults: a Society for Neuro-Oncology (SNO) and European Society of Neuro-Oncology (EANO) consensus review on current management and future directions. Neuro Oncol. 2020;22:1073–113. doi: 10.1093/neuonc/noaa106. - DOI - PMC - PubMed
    1. Aldape K, Brindle KM, Chesler L, Chopra R, Gajjar A, Gilbert MR, et al. Challenges to curing primary brain tumours. Nat Rev Clin Oncol. 2019;16:509–20. doi: 10.1038/s41571-019-0177-5. - DOI - PMC - PubMed
    1. Prager BC, Bhargava S, Mahadev V, Hubert CG, Rich JN. Glioblastoma stem cells: driving resilience through chaos. Trends Cancer. 2020;6:223–35. doi: 10.1016/j.trecan.2020.01.009. - DOI - PMC - PubMed
    1. Verhaak RG, Hoadley KA, Purdom E, Wang V, Qi Y, Wilkerson MD, et al. Integrated genomic analysis identifies clinically relevant subtypes of glioblastoma characterized by abnormalities in PDGFRA, IDH1, EGFR, and NF1. Cancer Cell. 2010;17:98–110. doi: 10.1016/j.ccr.2009.12.020. - DOI - PMC - PubMed

Publication types

MeSH terms

Substances