

Amygdalar neurotransmission alterations in the BTBR mice model of idiopathic autism
- PMID: 38632257
- PMCID: PMC11024334
- DOI: 10.1038/s41398-024-02905-z
Amygdalar neurotransmission alterations in the BTBR mice model of idiopathic autism
Abstract
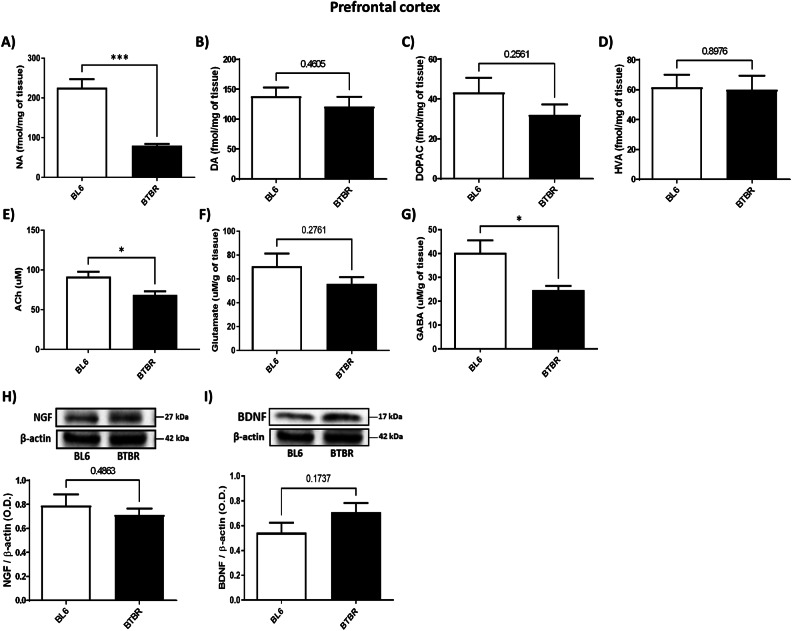
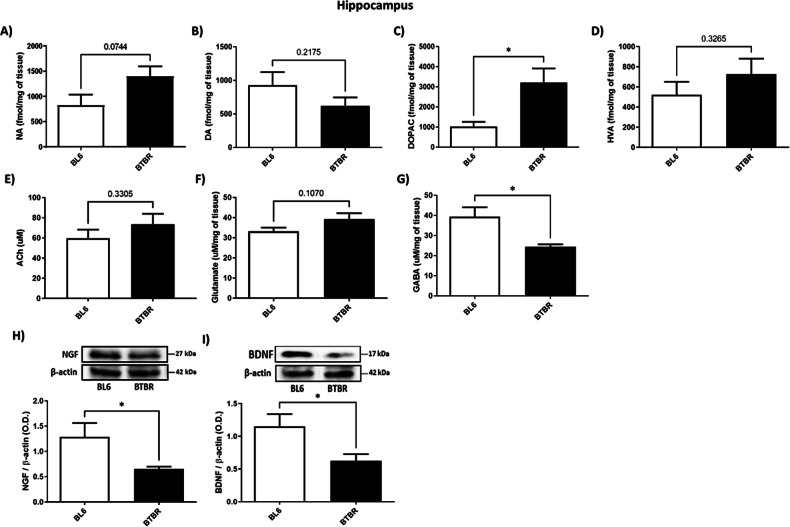
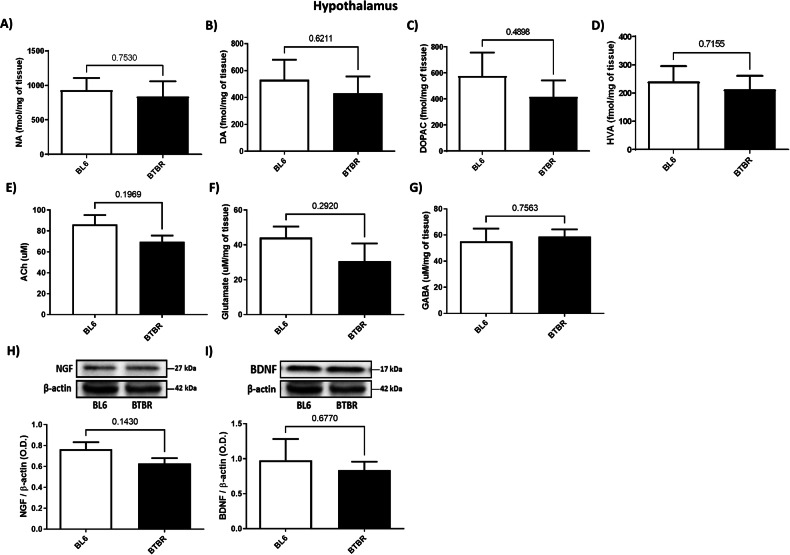
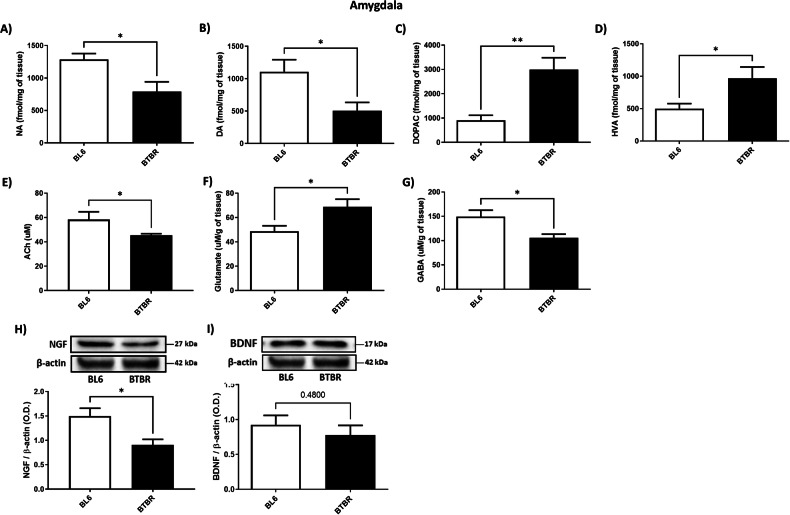
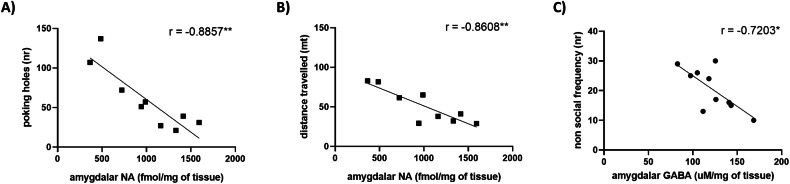
Autism Spectrum Disorders (ASD) are principally diagnosed by three core behavioural symptoms, such as stereotyped repertoire, communication impairments and social dysfunctions. This complex pathology has been linked to abnormalities of corticostriatal and limbic circuits. Despite experimental efforts in elucidating the molecular mechanisms behind these abnormalities, a clear etiopathogenic hypothesis is still lacking. To this aim, preclinical studies can be really helpful to longitudinally study behavioural alterations resembling human symptoms and to investigate the underlying neurobiological correlates. In this regard, the BTBR T+ Itpr3tf/J (BTBR) mice are an inbred mouse strain that exhibits a pattern of behaviours well resembling human ASD-like behavioural features. In this study, the BTBR mice model was used to investigate neurochemical and biomolecular alterations, regarding Nerve Growth Factor (NGF) and Brain-Derived Neurotrophic Factor (BDNF), together with GABAergic, glutamatergic, cholinergic, dopaminergic and noradrenergic neurotransmissions and their metabolites in four different brain areas, i.e. prefrontal cortex, hippocampus, amygdala and hypothalamus. In our results, BTBR strain reported decreased noradrenaline, acetylcholine and GABA levels in prefrontal cortex, while hippocampal measurements showed reduced NGF and BDNF expression levels, together with GABA levels. Concerning hypothalamus, no differences were retrieved. As regarding amygdala, we found reduced dopamine levels, accompanied by increased dopamine metabolites in BTBR mice, together with decreased acetylcholine, NGF and GABA levels and enhanced glutamate content. Taken together, our data showed that the BTBR ASD model, beyond its face validity, is a useful tool to untangle neurotransmission alterations that could be underpinned to the heterogeneous ASD-like behaviours, highlighting the crucial role played by amygdala.
© 2024. The Author(s).
Conflict of interest statement
The authors declare no competing interests.
Figures
Similar articles
-
Reduced social interaction, behavioural flexibility and BDNF signalling in the BTBR T+ tf/J strain, a mouse model of autism.Behav Brain Res. 2013 Aug 15;251:35-40. doi: 10.1016/j.bbr.2012.12.028. Epub 2012 Dec 25. Behav Brain Res. 2013. PMID: 23270976
-
Ketamine administration in early postnatal life as a tool for mimicking Autism Spectrum Disorders core symptoms.Prog Neuropsychopharmacol Biol Psychiatry. 2022 Jul 13;117:110560. doi: 10.1016/j.pnpbp.2022.110560. Epub 2022 Apr 20. Prog Neuropsychopharmacol Biol Psychiatry. 2022. PMID: 35460811
-
Dysfunctional dopaminergic neurotransmission in asocial BTBR mice.Transl Psychiatry. 2014 Aug 19;4(8):e427. doi: 10.1038/tp.2014.69. Transl Psychiatry. 2014. PMID: 25136890 Free PMC article.
-
The BTBR mouse model of idiopathic autism - Current view on mechanisms.Neurosci Biobehav Rev. 2017 May;76(Pt A):99-110. doi: 10.1016/j.neubiorev.2016.12.037. Epub 2017 Feb 3. Neurosci Biobehav Rev. 2017. PMID: 28167097 Free PMC article. Review.
-
Oxytocin, GABA, and dopamine interplay in autism.Endocr Regul. 2024 Apr 24;58(1):105-114. doi: 10.2478/enr-2024-0012. Print 2024 Jan 1. Endocr Regul. 2024. PMID: 38656256 Review.
Cited by
-
Unraveling the Connections: Eating Issues, Microbiome, and Gastrointestinal Symptoms in Autism Spectrum Disorder.Nutrients. 2025 Jan 29;17(3):486. doi: 10.3390/nu17030486. Nutrients. 2025. PMID: 39940343 Free PMC article. Review.
-
Quantifying social distance using deep learning-based video analysis: results from the BTBR mouse model of autism.Front Behav Neurosci. 2025 Jun 20;19:1602205. doi: 10.3389/fnbeh.2025.1602205. eCollection 2025. Front Behav Neurosci. 2025. PMID: 40620906 Free PMC article.
-
Anterior insular cortex regulates depression-like and ASD-like behaviors via the differential contribution of two subsets of microglia.Mol Psychiatry. 2025 Aug 6. doi: 10.1038/s41380-025-03139-1. Online ahead of print. Mol Psychiatry. 2025. PMID: 40770435
-
Molecular Pathways, Neural Circuits and Emerging Therapies for Self-Injurious Behaviour.Int J Mol Sci. 2025 Feb 24;26(5):1938. doi: 10.3390/ijms26051938. Int J Mol Sci. 2025. PMID: 40076564 Free PMC article. Review.
-
Gut microbiota and brain-resident CD4+ T cells shape behavioral outcomes in autism spectrum disorder.Nat Commun. 2025 Jul 11;16(1):6422. doi: 10.1038/s41467-025-61544-0. Nat Commun. 2025. PMID: 40645945 Free PMC article.
References
MeSH terms
Substances
Grants and funding
- PRIN2017 code 2017YZF7MA/Ministero dell'Istruzione, dell'Università e della Ricerca (Ministry of Education, University and Research)
- PRIN2020 code 2020SCBBN2/Ministero dell'Istruzione, dell'Università e della Ricerca (Ministry of Education, University and Research)
- PRIN2017 code 2017AY8BP4/Ministero dell'Istruzione, dell'Università e della Ricerca (Ministry of Education, University and Research)
- REFIN code OE9C2692/Regione Puglia (Puglia Region)
- MSCA4Ukraine code 1233369/Alexander von Humboldt-Stiftung (Alexander von Humboldt Foundation)
LinkOut - more resources
Full Text Sources
Medical
Research Materials
Miscellaneous
