. 2024 Apr 17;15(1):3056.
doi: 10.1038/s41467-024-46920-6.

Survival and rapid resuscitation permit limited productivity in desert microbial communities

Affiliations

Survival and rapid resuscitation permit limited productivity in desert microbial communities

Stefanie Imminger et al. Nat Commun. .

Abstract

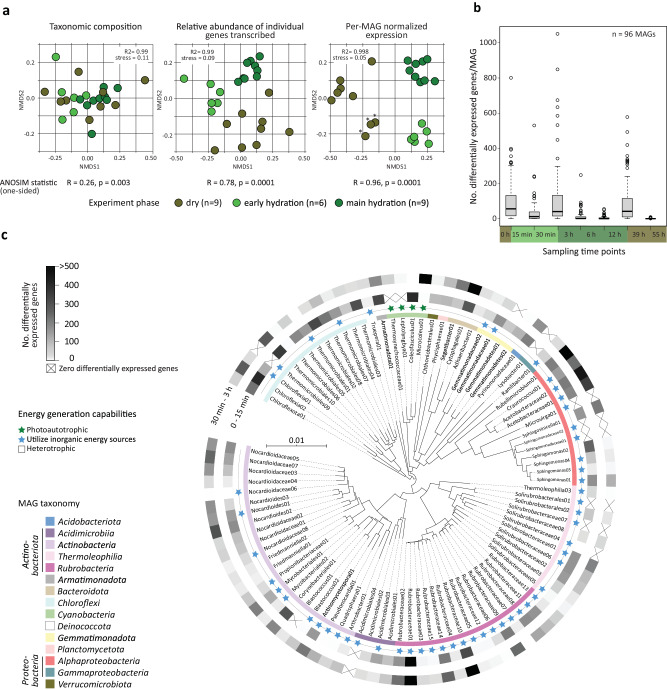
Microbial activity in drylands tends to be confined to rare and short periods of rain. Rapid growth should be key to the maintenance of ecosystem processes in such narrow activity windows, if desiccation and rehydration cause widespread cell death due to osmotic stress. Here, simulating rain with 2H2O followed by single-cell NanoSIMS, we show that biocrust microbial communities in the Negev Desert are characterized by limited productivity, with median replication times of 6 to 19 days and restricted number of days allowing growth. Genome-resolved metatranscriptomics reveals that nearly all microbial populations resuscitate within minutes after simulated rain, independent of taxonomy, and invest their activity into repair and energy generation. Together, our data reveal a community that makes optimal use of short activity phases by fast and universal resuscitation enabling the maintenance of key ecosystem functions. We conclude that desert biocrust communities are highly adapted to surviving rapid changes in soil moisture and solute concentrations, resulting in high persistence that balances limited productivity.


Conflict of interest statement

The authors declare no competing interests.

Figures

Fig. 1
Fig. 1. Overview of assays applied during a simulated rain event consisting of biocrust hydration and subsequent desiccation.
The scheme depicts sampling time points for different experiments during the hydration/desiccation cycle under controlled day and night conditions in a climate chamber. The sampling time points were defined based on preliminary experiments. The biocrusts were hydrated to 75% of their water holding capacity corresponding to 26% water content/wet weight. Overall, eight time points were sampled in five replicates for the metatranscriptome investigations (blue). Triplicates were selected for sequencing based on their water content. For NanoSIMS analysis, biocrusts were incubated in a parallel experiment with 30% deuterium oxide (heavy water) and destructively sampled at four incubation times spanning the first 24 h after hydration (green). To monitor H2 oxidation and respiration in dry and hydrated conditions, biocrust samples were incubated in triplicates over a period of several months for the dry and up to 24 h for the hydrated biocrusts (yellow). Gray shading indicates night-time incubation conditions.
Fig. 2
Fig. 2. Microbial activity detected through cellular incorporation of 2H and NanoSIMS analysis.
a NanoSIMS images showing the 2H isotope content and 12C14N secondary ion signal intensity distribution of samples obtained from heavy water (2H2O) incubations after different incubation times. b, c 2H isotope content extracted from defined regions of interest (ROIs) of single cells and multicellular cyanobacterial filaments after sampling at four (single cells) or three (filaments) time points. Number of displayed cells or cyanobacterial filaments are the following: nsingle_cells (3 h) = 164, nsingle_cells (6 h) = 204, nsingle_cells (12 h) = 192, nsingle_cells (24 h) = 229, nsingle_cells (24 h control) = 178, nfilaments (3 h) = 6, nfilaments (12 h) = 7, nfilaments (24 h) = 6, nfilaments (24 h control) = 1. d Fraction of cells classified as anabolically active. e Calculated biomass generation rates, inferred from NanoSIMS measurement data of single cells after different incubation times (and classified as active, shown in (b) and (c)), assuming either a heterotrophic (left panel) or chemoautotrophic (central panel) physiology and of photoautotrophic cyanobacterial filaments (right panel). Outliers are not displayed. f Histogram visualizing the frequency of replication times of single cells based on the assumption that all cells exhibit either a heterotrophic or chemoautotrophic physiology. Smoothened lines indicate kernel density estimates. Displayed data are based on the 24 h incubation sample and cover 91% (assumed heterotrophic physiology) and 72% (assumed chemoautotrophic physiology) of cells exhibiting replication times up to 40 days. The inset depicts the fractions of cells that potentially replicate in 1, 2, and 3 days. Scale bars in (a) correspond to 5 µm. The boxes in (b, c, e) comprise the 2nd and 3rd quartiles with the horizontal line indicating the median. Whiskers maximally extend to 1.5 times the inter-quartile range.
Fig. 3
Fig. 3. Temporal changes in metatranscriptome composition during hydration and dehydration of biocrusts.
a Ordination of metatranscriptomes by non-linear multi-dimensional scaling (NMDS, Jaccard distances) based on taxonomic composition (left panel), relative abundance of individual genes transcribed (middle panel), and per-MAG normalized expression (right panel). Asterisks mark samples of time point 0 (dry conditions at beginning of the experiment). A one-sided analysis of similarities (ANOSIM) was performed on sample groups as indicated below the panel. b Number of significantly differentially expressed genes per MAG between time points. The boxplots summarize data from 96 MAGs at each transition. The boxes comprise the 2nd and 3rd quartiles with the horizontal line indicating the median. Whiskers maximally extend to 1.5 times the inter-quartile range or to the last value within that range. Note that most changes in transcription occur when transitioning between hydration phases as seen in (a). c Number of significantly differentially expressed genes (DeSeq2 adj. p < 0.05) per individual MAG comparing early time points after rehydration (n = 3 independent crust samples per time point). Effect sizes (as Log2-fold change) and Benjamini–Hochberg false discovery rate adjusted p values (calculated with DeSeq2) for analyzed genes indicative of discussed metabolisms, can be found in Supplementary Data 3. The phylogenetic tree, based on GTDB-Tk placement of the MAGs, illustrates the diversity of MAGs for which transcription of genes was examined. Note that biocrust populations show a transcriptional reaction irrespective of being photoautotrophic (marked by green star), mixotrophic (marked by blue star) or purely heterotrophic (no star).
Fig. 4
Fig. 4. Relative transcript abundances of genes encoding for DNA repair and energy production across the temporal hydration phases for the phylogenetically diverse MAGs.
a Relative transcript abundances of genes involved in double-stranded DNA break repair, (b) genes encoding subunits of cytochrome bd and cytochrome c terminal oxidases indicative of aerobic respiration, (c) genes indicative of storage compounds degradation, atmospheric gas oxidation and light-dependent electron donor reactions. Only genes with a significant change in expression (DeSeq2 (Wald test) adj. p < 0.05) between subsequent time points (n = 3 independent crust samples per time point) or between experiment phases (n = 6 independent crust samples in early hydration phase, n = 9 for dry and main hydration phase) are shown, with the exception of Form I CO-dehydrogenase genes in (c), where expression patterns of all Form I CO-dehydrogenase genes are shown. Effect sizes (as Log2-fold change) and Benjamini–Hochberg false discovery rate adjusted p values (calculated with DeSeq2) for analyzed genes indicative of discussed metabolisms, can be found in Supplementary Data 3. Heat map columns depict individual time points of the time series (average values of three replicates), whereas rows depict transcripts attributed to a specific MAG. Taxonomy of individual MAGs are color-coded. Numbers parenthetically indicate the number of genes summarized per MAG (encoding different subunits or multiple copies of the same gene). The highest color intensity indicates the time point where the respective transcript reached its highest proportion in a MAG’s transcriptome. This maximum value is indicated on the right in transcripts per million (TPM) (gray bars).
Fig. 5
Fig. 5. Atmospheric H2 oxidation, [NiFe]-hydrogenase phylogeny and gene expression in biocrusts.
a H2 consumption over time by wet and dry biocrusts. Dotted lines represent atmospheric H2 concentration (0.53 ppmv). Data points depict mean ± standard error of triplicates. b Maximum likelihood phylogenetic tree of amino acid sequences of the group 1h and 1l [NiFe]-hydrogenase large subunit (HhyL) from metagenome-assembled genomes and reference sequences. Sequences with an asterisk are MAGs with associated expression data in (c). Tree was generated by iQTree. The tree was bootstrapped 1000 times based on UFBoot, and nodes with consensus support >100% (black circle) and >85% (gray circle) are shown. Shaded sections depict the respective [NiFe]-hydrogenase groups: purple and blue for group 1h and 1l [NiFe]-hydrogenases, respectively. [NiFe]-hydrogenase sequences from this study are in bold. Sequences from group 1g [NiFe]-hydrogenases (WP_011761956.1, WP_012349775.1) were used as an outgroup. The scale bar indicates the numbers of substitutions per site. c [NiFe]-hydrogenase expression patterns of the entire metatranscriptome (upper panel) and individual MAGs (lower panel) across the temporal hydration phases (average values of three replicates). Numbers parenthetically indicate the number of genes per MAG (encoding different subunits or multiple copies of the same gene). Maximum transcripts per million (TPM) are depicted.
Fig. 6
Fig. 6. Relative transcript abundances of genes encoding desiccation stress resistance mechanisms across the temporal hydration phases for the phylogenetically diverse MAGs.
a Relative transcript abundances of genes encoding for reactive oxygen scavenging and (b) osmoprotectant synthesis genes. Only genes with a significant change in expression (DeSeq2 adj. p < 0.05) between subsequent time points (n = 3 independent crust samples per time point) or between experiment phases (n = 6 independent crust samples in early hydration phase, n = 9 for dry and main hydration phase) are shown. Effect sizes (as Log2-fold change) and Benjamini–Hochberg false discovery rate adjusted p values (calculated with DeSeq2) for analyzed genes indicative of discussed metabolisms, can be found in Supplementary Data 3. Heat map columns depict individual time points of the time series (average values of three replicates), whereas rows depict transcripts attributed to a specific MAG. Taxonomy of individual MAGs are color-coded. Numbers parenthetically indicate the number of genes summarized per MAGs (encoding different subunits or multiple copies of the same gene). The highest color intensity indicates the time point where the respective transcript reached its highest proportion in a MAG’s transcriptome. This maximum value is indicated on the right in transcripts per million (TPM) (gray bars). The vertical red line indicates values far exceeding 20,000 TPM.
Fig. 7
Fig. 7. Microbial processes in dry biocrusts and following a rain event.
Conceptual figure summarizing the observed resuscitation patterns of biocrust microorganisms, including metabolic processes during dry and hydration phases. Rewetting of biocrusts will stimulate microbial activity, driving major ecosystem processes (e.g., H2 oxidation, respiration, photosynthesis). Nearly all cells will become anabolically active in a rain event, but short rain phases only allow cell division in a small proportion of cells. However, even non-growing cells can use the hydration phase for repairing macromolecules and replenish reserves (such as storage compounds), which increases the chance that they persist until the next rain event.

References

    1. Reynolds, J. F. et al. Global desertification: building a science for dryland development. Science316, 847–851 (2007). - PubMed
    1. Intergovernmental Panel on Climate Change. Desertification. Climate Change and Land: IPCC Special Report on Climate Change, Desertification, Land Degradation, Sustainable Land Management, Food Security, and Greenhouse Gas Fluxes in Terrestrial Ecosystems (Cambridge University Press, 2022).
    1. Wang, L. et al. Dryland productivity under a changing climate. Nat. Clim. Change12, 981–994 (2022).
    1. Feng, S. & Fu, Q. Expansion of global drylands under a warming climate. Atmos. Chem. Phys.13, 10081–10094 (2013).
    1. Huang, J., Yu, H., Guan, X., Wang, G. & Guo, R. Accelerated dryland expansion under climate change. Nat. Clim. Change6, 166–171 (2015).

LinkOut - more resources