

ECG signal quality in intermittent long-term dry electrode recordings with controlled motion artifacts
- PMID: 38632263
- PMCID: PMC11024137
- DOI: 10.1038/s41598-024-56595-0
ECG signal quality in intermittent long-term dry electrode recordings with controlled motion artifacts
Abstract
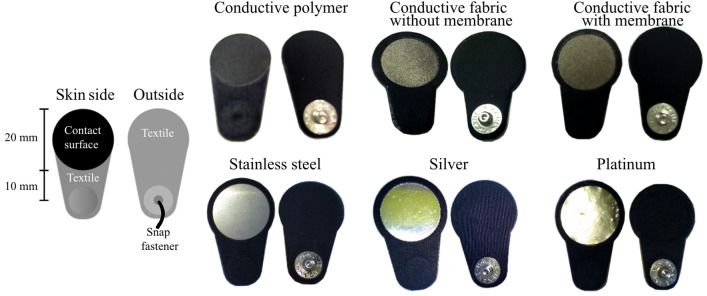
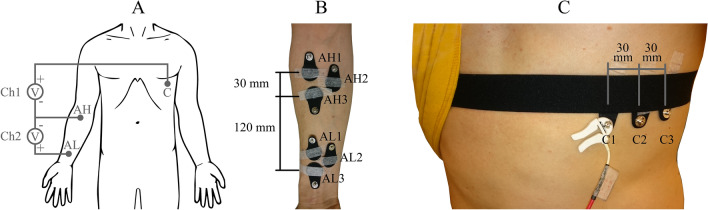
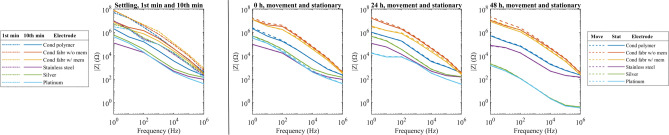
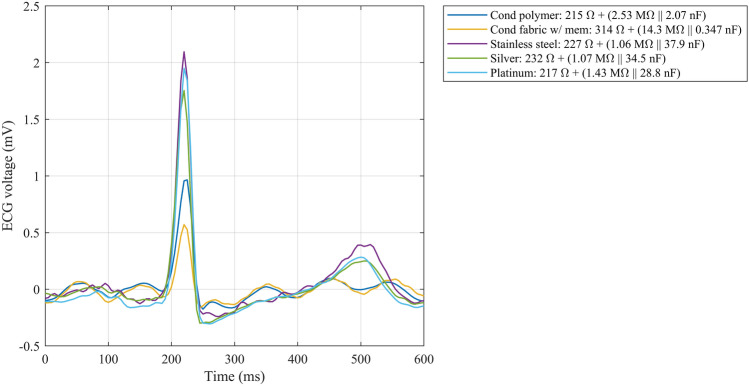
Wearable long-term monitoring applications are becoming more and more popular in both the consumer and the medical market. In wearable ECG monitoring, the data quality depends on the properties of the electrodes and on how they interface with the skin. Dry electrodes do not require any action from the user. They usually do not irritate the skin, and they provide sufficiently high-quality data for ECG monitoring purposes during low-intensity user activity. We investigated prospective motion artifact-resistant dry electrode materials for wearable ECG monitoring. The tested materials were (1) porous: conductive polymer, conductive silver fabric; and (2) solid: stainless steel, silver, and platinum. ECG was acquired from test subjects in a 10-min continuous settling test and in a 48-h intermittent long-term test. In the settling test, the electrodes were stationary, whereas both stationary and controlled motion artifact tests were included in the long-term test. The signal-to-noise ratio (SNR) was used as the figure of merit to quantify the results. Skin-electrode interface impedance was measured to quantify its effect on the ECG, as well as to leverage the dry electrode ECG amplifier design. The SNR of all electrode types increased during the settling test. In the long-term test, the SNR was generally elevated further. The introduction of electrode movement reduced the SNR markedly. Solid electrodes had a higher SNR and lower skin-electrode impedance than porous electrodes. In the stationary testing, stainless steel showed the highest SNR, followed by platinum, silver, conductive polymer, and conductive fabric. In the movement testing, the order was platinum, stainless steel, silver, conductive polymer, and conductive fabric.
Keywords: Biomedical electrodes; Electrocardiography; Impedance; Materials testing; Signal-to-noise ratio; Skin–electrode interface.
© 2024. The Author(s).
Conflict of interest statement
The authors declare no competing interests.
Figures


Similar articles
-
Stretchable Sponge Electrodes for Long-Term and Motion-Artifact-Tolerant Recording of High-Quality Electrophysiologic Signals.ACS Nano. 2022 Aug 23;16(8):11792-11801. doi: 10.1021/acsnano.2c04962. Epub 2022 Jul 21. ACS Nano. 2022. PMID: 35861486 Free PMC article.
-
Properties of different types of dry electrodes for wearable smart monitoring devices.Biomed Tech (Berl). 2020 Aug 27;65(4):405-415. doi: 10.1515/bmt-2019-0167. Biomed Tech (Berl). 2020. PMID: 32238599
-
Evaluation of dry textile electrodes for long-term electrocardiographic monitoring.Biomed Eng Online. 2021 Jul 12;20(1):68. doi: 10.1186/s12938-021-00905-4. Biomed Eng Online. 2021. PMID: 34247646 Free PMC article.
-
Wearable Smart Textiles for Long-Term Electrocardiography Monitoring-A Review.Sensors (Basel). 2021 Jun 17;21(12):4174. doi: 10.3390/s21124174. Sensors (Basel). 2021. PMID: 34204577 Free PMC article. Review.
-
Motion artifacts in capacitive ECG monitoring systems: a review of existing models and reduction techniques.Med Biol Eng Comput. 2024 Dec;62(12):3599-3622. doi: 10.1007/s11517-024-03165-1. Epub 2024 Jul 20. Med Biol Eng Comput. 2024. PMID: 39031328 Free PMC article. Review.
Cited by
-
Electrode-Free ECG Monitoring with Multimodal Wireless Mechano-Acoustic Sensors.Biosensors (Basel). 2025 Aug 20;15(8):550. doi: 10.3390/bios15080550. Biosensors (Basel). 2025. PMID: 40863010 Free PMC article.
-
Wearable armband with a floating mobile exploratory electrode at fingertip for on-demand touch-and-measure multilead electrocardiography.Wearable Technol. 2025 May 5;6:e21. doi: 10.1017/wtc.2025.11. eCollection 2025. Wearable Technol. 2025. PMID: 40336968 Free PMC article.
-
Flexible Bioelectrodes-Integrated Miniaturized System for Unconstrained ECG Monitoring.Sensors (Basel). 2025 Jul 6;25(13):4213. doi: 10.3390/s25134213. Sensors (Basel). 2025. PMID: 40648468 Free PMC article.
-
Highly Self-Adhesive and Biodegradable Silk Bioelectronics for All-In-One Imperceptible Long-Term Electrophysiological Biosignals Monitoring.Adv Sci (Weinh). 2025 Feb;12(8):e2405988. doi: 10.1002/advs.202405988. Epub 2025 Jan 10. Adv Sci (Weinh). 2025. PMID: 39792793 Free PMC article.
-
Impedance Characterization and Modeling of Gold, Silver, and PEDOT:PSS Ultra-Thin Tattoo Electrodes for Wearable Bioelectronics.Sensors (Basel). 2025 Jul 23;25(15):4568. doi: 10.3390/s25154568. Sensors (Basel). 2025. PMID: 40807735 Free PMC article.
References
-
- World Health Organization. Cardiovascular diseases (CVDs). Fact sheethttps://www.who.int/news-room/fact-sheets/detail/cardiovascular-diseases...) (2021).
-
- Bloom, D. E. et al. The Global Economic Burden of Noncommunicable Diseases. https://www.weforum.org/docs/WEF_Harvard_HE_GlobalEconomicBurdenNonCommu... (2011).
-
- Wilkins, E. et al. European Cardiovascular Disease Statistics. https://ehnheart.org/images/CVD-statistics-report-August-2017.pdf (2017). - PubMed
MeSH terms
Substances
Grants and funding
LinkOut - more resources
Full Text Sources
