. 2024 Apr 17;10(1):40.
doi: 10.1038/s41540-024-00368-y.

T-cell commitment inheritance-an agent-based multi-scale model

Affiliations

T-cell commitment inheritance-an agent-based multi-scale model

Emil Andersson et al. NPJ Syst Biol Appl. .

Abstract

T-cell development provides an excellent model system for studying lineage commitment from a multipotent progenitor. The intrathymic development process has been thoroughly studied. The molecular circuitry controlling it has been dissected and the necessary steps like programmed shut off of progenitor genes and T-cell genes upregulation have been revealed. However, the exact timing between decision-making and commitment stage remains unexplored. To this end, we implemented an agent-based multi-scale model to investigate inheritance in early T-cell development. Treating each cell as an agent provides a powerful tool as it tracks each individual cell of a simulated T-cell colony, enabling the construction of lineage trees. Based on the lineage trees, we introduce the concept of the last common ancestors (LCA) of committed cells and analyse their relations, both at single-cell level and population level. In addition to simulating wild-type development, we also conduct knockdown analysis. Our simulations predicted that the commitment is a three-step process that occurs on average over several cell generations once a cell is first prepared by a transcriptional switch. This is followed by the loss of the Bcl11b-opposing function approximately two to three generations later. This is when our LCA analysis indicates that the decision to commit is taken even though in general another one to two generations elapse before the cell actually becomes committed by transitioning to the DN2b state. Our results showed that there is decision inheritance in the commitment mechanism.


Conflict of interest statement

The authors declare no competing interests.

Figures
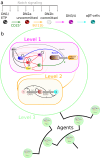
Fig. 1
Fig. 1. Agent-based multi-scale model for early T-cell development commitment.
a Schematics over the in vivo early T-cell development. Early thymic progenitors (ETPs or DN1) transition to the DN2a state which is marked by CD25 surface expression. Commitment to the T-cell fate is observed by Bcl11b upregulation as the cells progress to the DN2b state. The T-cell lineage development continues through DN3 and DN4 stages and eventually becomes mature T-cells. The early T-cell development takes place under the influence of Notch signalling inside the thymus. b Depiction of the multi-scale agent-based model for the T-cell development stages from DN1/ETP to DN2b. As CD25 is a surface marker it is not included in the model. The magenta-coloured box illustrates level 1 and contains the GRN topology. The black arrows and thick red blunted arrows represent positive and negative direct regulation respectively. The thin red blunted arrows represent inhibition of regulation. The blue and grey arrows represent that Runx1 and Notch promote the opening of Bcl11b regulatory sites, while the green arrow shows that X keeps the sites closed. The orange box illustrates the epigenetic mechanism of level 2. The regulatory sites can change between three different states (closed, intermediate and open) and are affected by input signals from level 1. Each cell of level 3 (green circles) contains a copy of levels 1 and 2. The agent-based model implementation tracks the relation between the proliferating cells in lineage trees.
Fig. 2
Fig. 2. Small lineage tree and last common ancestor (LCA) definitions.
a A lineage tree example. Every node is a cell which is uniquely identifiable by an index. Each cell branches into two daughter cells. The radial connecting lines are proportional to a cell’s lifetime. The colour of the node indicates the status of the cell’s Bcl11b regulatory region and X expression, as described by the legend. Each cell is labelled with its LCA label. b Definitions of the LCA categories. c The graphical definition of each LCA category for the cells encircled with cyan. Note the subtle difference between ‘closed post-LCA m’ and ‘closed pre-LCA’, i.e. the only difference is whether they have an LCA-ancestor or not.
Fig. 3
Fig. 3. Stochastic simulations of cell lineages.
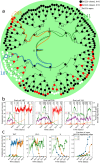
a Lineage tree for a simulated colony. Three different lineages with different fates are marked with blue, orange, and green lineage paths respectively. Black nodes depict cells with the Bcl11b regulatory region closed and X expression greater than 0, red nodes represent cells where the Bcl11b is closed and X is depleted, and white nodes represent cells where the Bcl11b region is open. b Each panel shows the gene expression dynamics for each of the three marked lineages respectively. The vertical lines represent cell divisions and are labelled with the cells' corresponding last common ancestor (LCA) categories. c Each panel show the expression for Tcf7, PU.1, X and the fraction of open Bcl11b regulatory sites respectively for the three marked cell lineages. The coloured dots indicate cell divisions.
Fig. 4
Fig. 4. Last common ancestor (LCA) statistics.
a The number of colonies reaching each colony size. b Boxplot over the distribution of the fraction of open cells per colony for different-sized colonies. Each dot represents a colony. The centre line of a box is the median, the bounds of the box represent the first and third quartile, and the whiskers extend to 1.5 times the interquartile range. Points falling outside of this range are shown as outliers. c Mean expression level for Tcf7, PU.1, X, and the fraction of open Bcl11b regulatory sites for cells belonging to the different LCA categories. The categories are ordered in an approximate developmental order. The grey numbers indicate the number of cells belonging to each category. The red arrows point out the preparatory switch towards the T-cell fate. The pink arrow indicates the most common LCA stage where X function is lost. The blue arrow shows that the opening of the Bcl11b regulatory region is delayed with two generations. The error bars represent standard deviations.
Fig. 5
Fig. 5. Knockdown simulations.
a Statistics on cells with open Bcl11b regulatory regions from KD simulations of Runx1, Tcf7, Gata3 and PU.1 compared to WT simulations where 60 colonies per simulation were considered. Both the genes' initial transcription counts and production rates are reduced to 20% of the original values. b Statistics on the expression level of X from the same simulations as in (a). c, d Knockdown simulations of Tcf7 and Gata3 at different time points compared to WT simulations with 180 colonies per simulation type. c shows the distribution of the fraction of cells with open Bcl11b regulatory regions per colony and d shows the expression level of X. The centre line of a box is the median, the bounds of the box represent the first and third quartile, and the whiskers extend to 1.5 times the interquartile range. Points falling outside of this range are shown as outliers.
Fig. 6
Fig. 6. Last common ancestor flowchart.
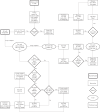
Flowchart over the classification process of the last common ancestor (LCA) categories which starts at the top in the centre.

Update of

Similar articles

References

    1. Yui MA, Rothenberg EV. Developmental gene networks: a triathlon on the course to T cell identity. Nat. Rev. Immunol. 2014;14:529–545. doi: 10.1038/nri3702. - DOI - PMC - PubMed
    1. Rothenberg EV, Ungerbäck J, Champhekar A. Forging T-lymphocyte identity: intersecting networks of transcriptional control. Adv. Immunol. 2016;129:109–174. - PMC - PubMed
    1. Del Real MM, Rothenberg EV. Architecture of a lymphomyeloid developmental switch controlled by PU. 1, Notch and Gata3. Development. 2013;140:1207–1219. doi: 10.1242/dev.088559. - DOI - PMC - PubMed
    1. Hosokawa H, et al. Transcription factor PU.1 represses and activates gene expression in early T cells by redirecting partner transcription factor binding. Immunity. 2018;48:1119–1134. doi: 10.1016/j.immuni.2018.04.024. - DOI - PMC - PubMed
    1. Kueh HY, et al. Asynchronous combinatorial action of four regulatory factors activates Bcl11b for T cell commitment. Nat. Immunol. 2016;17:956–965. doi: 10.1038/ni.3514. - DOI - PMC - PubMed

MeSH terms

Substances