. 2024 Apr 17;14(1):8914.
doi: 10.1038/s41598-024-59604-4.

An aberrant fused in sarcoma liquid droplet of amyotrophic lateral sclerosis pathological variant, R495X, accelerates liquid-solid phase transition

Affiliations

An aberrant fused in sarcoma liquid droplet of amyotrophic lateral sclerosis pathological variant, R495X, accelerates liquid-solid phase transition

Yutaro Shiramasa et al. Sci Rep. .

Abstract

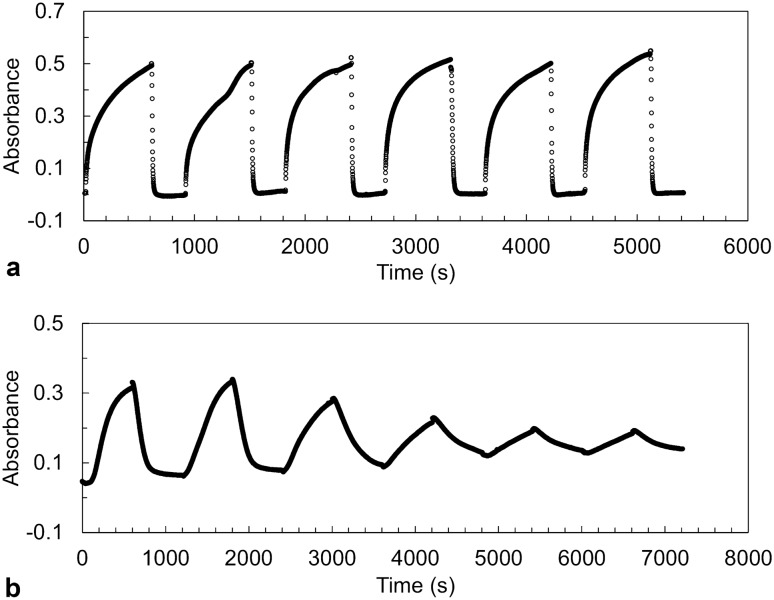
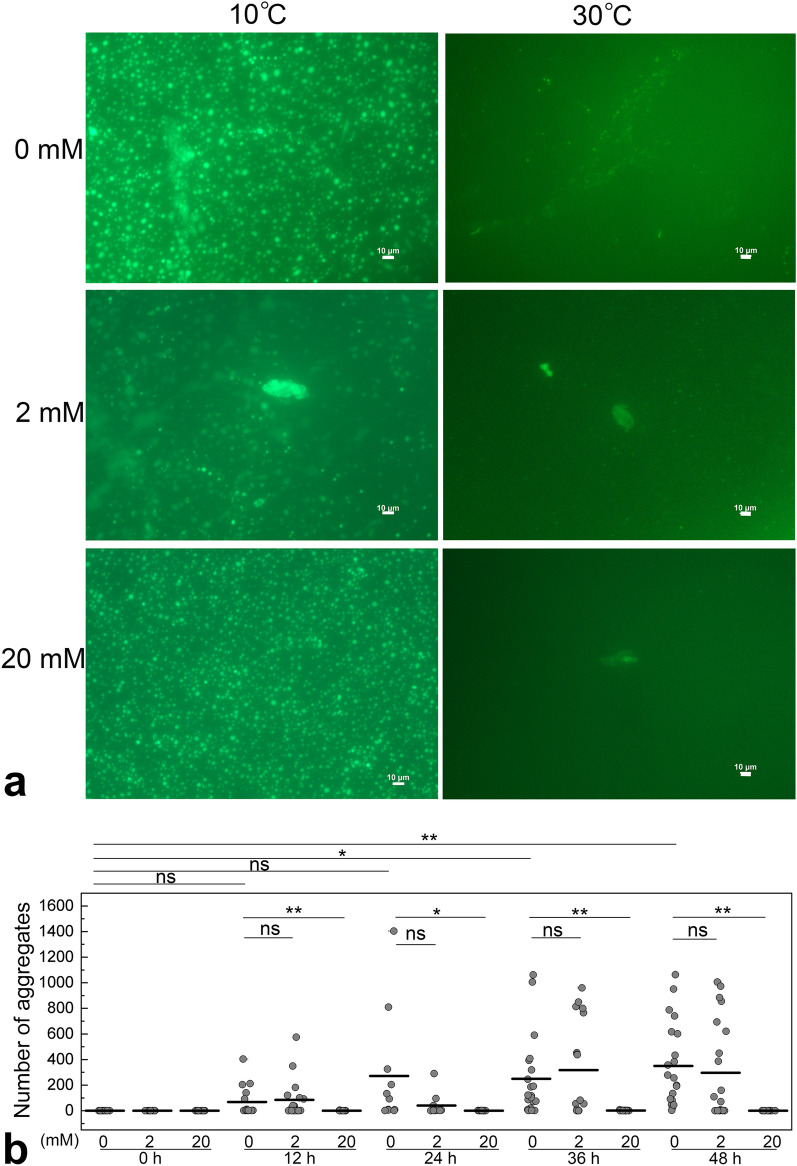
Intracellular aggregation of fused in sarcoma (FUS) is associated with the pathogenesis of familial amyotrophic lateral sclerosis (ALS). Under stress, FUS forms liquid droplets via liquid-liquid phase separation (LLPS). Two types of wild-type FUS LLPS exist in equilibrium: low-pressure LLPS (LP-LLPS) and high-pressure LLPS (HP-LLPS); the former dominates below 2 kbar and the latter over 2 kbar. Although several disease-type FUS variants have been identified, the molecular mechanism underlying accelerated cytoplasmic granule formation in ALS patients remains poorly understood. Herein, we report the reversible formation of the two LLPS states and the irreversible liquid-solid transition, namely droplet aging, of the ALS patient-type FUS variant R495X using fluorescence microscopy and ultraviolet-visible absorption spectroscopy combined with perturbations in pressure and temperature. Liquid-to-solid phase transition was accelerated in the HP-LLPS of R495X than in the wild-type variant; arginine slowed the aging of droplets at atmospheric conditions by inhibiting the formation of HP-LLPS more selectively compared to that of LP-LLPS. Our findings provide new insight into the mechanism by which R495X readily forms cytoplasmic aggregates. Targeting the aberrantly formed liquid droplets (the HP-LLPS state) of proteins with minimal impact on physiological functions could be a novel therapeutic strategy for LLPS-mediated protein diseases.


Conflict of interest statement

The authors declare no competing interests.

Figures

Figure 1
Figure 1
Temperature-scan experiments of FUS-R495X and -WT. (a) Changes in absorbance (i.e., turbidity) for FUS-R495X as temperature decreases from 38 to 10 °C at 1 bar. (b) Changes in absorbance for FUS-WT as temperature decreases from 38 to 10 °C at 1 bar. (c) The cloud points of FUS-WT (open circles) and FUS-R495X (closed circles) at different protein concentrations at 1 bar. Mean and deviation of the cloud points are shown in the panel. Temperature-scan experiments were performed three times for R495X and five times for WT. Representative data sets are shown in the panels (a) and (b).
Figure 2
Figure 2
Pressure and temperature dependence of FUS-R495X liquid–liquid phase separation (LLPS). (a) Changes in absorbance with increasing (closed circles) and decreasing (open circles) pressures at 17.2 °C (left). (b) Changes in absorbance with cooling (closed circles) and warming (open circles) at 2.75 kbar (left). (c) Pressure and temperature phase diagram of LLPS. The cloud points and transition pressures were obtained for 5 μM of FUS-R495X (closed circles). FUS-WT data (open circles) are reproduced from the previous report. The phase diagram was generated by multiple temperature- and pressure-scan experiments for 5 μM of the proteins. These experiments were conducted once under each condition.
Figure 3
Figure 3
Pressure-jump relaxation study of FUS-R495X. (a) Changes in absorbance of R495X (5 μM) with six pressure cycles between 1 bar and 1.2 kbar at 9.5 °C. (b) Changes in absorbance of R495X (5 μM) with six pressure cycles between 2.0 and 3.5 kbar at 9.4 °C.
Figure 4
Figure 4
Generation of solid aggregates of FUS-WT and R495X. Time-dependent changes in fluorescence microscope images were investigated for liquid and solid condensates of WT (a) and R495X (b) (5 μM) incubated at 10 °C (left) and when the sample temperature was increased to 30 °C after incubation at 10 °C (right). Fluorescence microscope experiments were performed in triplicate for each experimental condition. (c) The number of aggregates of WT and R495X that did not disappear when heated to 30 °C after 48 h of incubation at 10 °C. The data of WT and R495X were obtained from 18 and 26 microscopic images, respectively. Means of particle counts are shown by lines. *0.01 < P < 0.05 using Student’s t-test. (d) Fluorescence microscope images of R495X after 36 h incubation at 10 °C (left) and when the sample temperature was increased to 30 °C (right). Data from a different sample from (b). Scale bar = 10 µm. The contrast and brightness of the images were adjusted using Adobe Photoshop 2023 (Adobe, Mountain View, CA, USA).
Figure 5
Figure 5
Thioflavin T assay of solid aggregates of FUS-WT and R495X. (a) Time-dependent changes in the number of FUS-WT aggregates at 0, 2, and 20 mM arginine concentrations in the buffer solution (left). Fluorescence microscope images collected at 0 h, 24 h, and 48 h incubation at 10 °C (right). An expanded image of the aggregate indicated by an arrow is shown in the inset. Images were collected from two experiments. (b) Time-dependent changes in the number of FUS-R495X aggregates at 0, 2, and 20 mM arginine concentrations in the buffer solution (left). Fluorescence microscope images collected at 0 h, 24 h, and 48 h incubation at 10 °C (right). An expanded image of the aggregate indicated by an arrow is shown in the inset. Images were collected from one experiment. (c) Fibrous aggregates of R495X observed when heated to 30 °C after 24 h, 36 h, or 48 h of incubation at 10 °C. (d) Comparison of bright-field (left) and fluorescence (middle) microscope images of WT condensates after 36 h incubation at room temperature (20–22 °C); their merged image is shown on the right. White or black scale bar = 10 mm.
Figure 6
Figure 6
Effects of small compounds on the formation of FUS-R495X liquid–liquid phase separation (LLPS). (a) Pressure-dependent changes in absorbance of R495X (5 μM) with different arginine concentrations at 9.5 °C. (b) Pressure-dependent changes in absorbance of R495X (5 μM) with 20 mM of arginine, dopamine, and pyrocatechol at 9.5 °C. (c) Changes in absorbance of R495X (5 μM) with 1 mM of arginine with eight pressure cycles between 2.0 and 3.5 kbar at 9.3 °C.
Figure 7
Figure 7
Arginine extends the reversible property of R495X droplets. (a) Fluorescence microscope images of R495X (5 μM) with different arginine concentrations (0–20 mM) were obtained at 10 °C (left) and 30 °C (right) after 36 h incubation at 10 °C. Scale bar = 10 µm. The contrast and brightness of the images obtained at 30 °C were adjusted using Adobe Photoshop 2023 (Adobe, Mountain View, CA, USA). (b) The number of remaining droplets when heated to 30 °C after 0–48 h of incubation at 10 °C. Fluorescence microscope experiments were performed in triplicate for each experimental condition. Means of particle counts were calculated using 10–27 microscopic images for each condition. *P < 0.05, **P < 0.01, and ns = not significant using Student’s t-test.
Figure 8
Figure 8
Molecular dynamics simulations of FUS-WT and R495X. (a and b) Distance maps between each residue at 1 bar and 3 kbar, respectively. Data for FUS-WT and R495X are presented in the top-right and bottom-left panels, respectively, in each panel. Low-complexity region, Arg-Gly-Gly region, RNA recognition motif, zinc finger region, and nuclear localization signal are depicted by LC, RGG, RRM, ZnF, and NLS, respectively, at the top and right sides of the panels. (c and d) MD simulation snapshots of FUS-WT and R495X, respectively, at 100 ns, shown by molecular surfaces. The fibril core (a.a. 39–95) in the LC region is indicated in red. N- and C-terminals are depicted by N and C, respectively.

Similar articles

References

    1. Yoshizawa T, et al. Nuclear import receptor inhibits phase separation of FUS through binding to multiple sites. Cell. 2018;173:693–705. doi: 10.1016/j.cell.2018.03.003. - DOI - PMC - PubMed
    1. Bracha D, Walls MT, Brangwynne CP. Probing and engineering liquid-phase organelles. Nat. Biotechnol. 2019;37:1435–1445. doi: 10.1038/s41587-019-0341-6. - DOI - PubMed
    1. Zbinden A, Perez-Berlanga M, De Rossi P, Polymenidou M. Phase separation and neurodegenerative diseases: A disturbance in the force. Dev. Cell. 2020;55:45–68. doi: 10.1016/j.devcel.2020.09.014. - DOI - PubMed
    1. Alberti S, Hyman AA. Biomolecular condensates at the nexus of cellular stress, protein aggregation disease and ageing. Nat. Rev. Mol. Cell. Biol. 2021;22:196–213. doi: 10.1038/s41580-020-00326-6. - DOI - PubMed
    1. Shapiro DM, Ney M, Eghtesadi SA, Chilkoti A. Protein phase separation arising from intrinsic disorder: First-principles to bespoke applications. J. Phys. Chem. B. 2021;125:6740–6759. doi: 10.1021/acs.jpcb.1c01146. - DOI - PubMed

MeSH terms

Grants and funding