. 2024 Apr 17;14(1):8858.
doi: 10.1038/s41598-024-58953-4.

High visual salience of alert signals can lead to a counterintuitive increase of reaction times

Affiliations

High visual salience of alert signals can lead to a counterintuitive increase of reaction times

Wolfgang Einhäuser et al. Sci Rep. .

Abstract

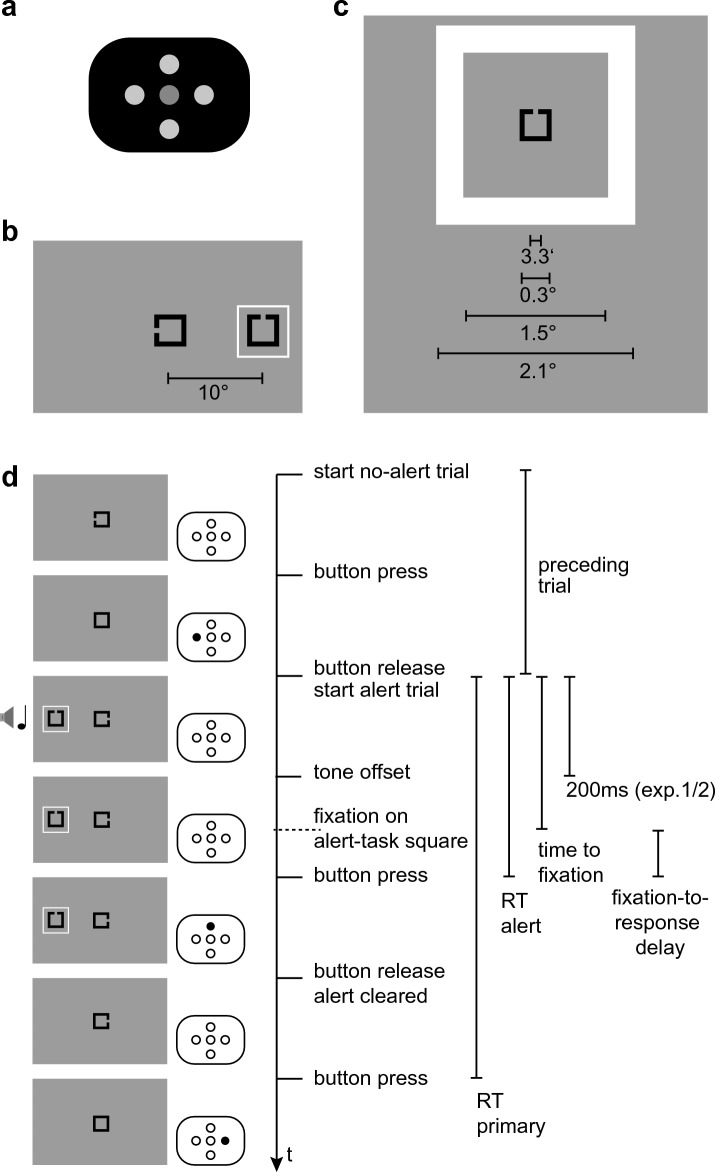
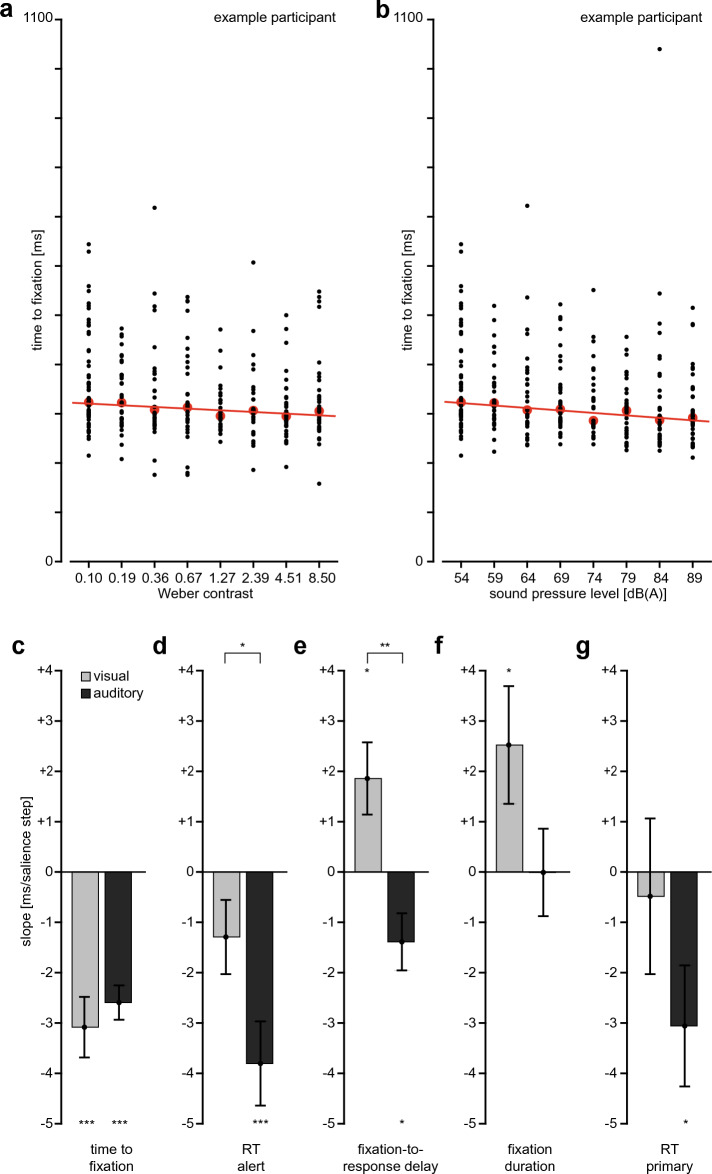
It is often assumed that rendering an alert signal more salient yields faster responses to this alert. Yet, there might be a trade-off between attracting attention and distracting from task execution. Here we tested this in four behavioral experiments with eye-tracking using an abstract alert-signal paradigm. Participants performed a visual discrimination task (primary task) while occasional alert signals occurred in the visual periphery accompanied by a congruently lateralized tone. Participants had to respond to the alert before proceeding with the primary task. When visual salience (contrast) or auditory salience (tone intensity) of the alert were increased, participants directed their gaze to the alert more quickly. This confirms that more salient alerts attract attention more efficiently. Increasing auditory salience yielded quicker responses for the alert and primary tasks, apparently confirming faster responses altogether. However, increasing visual salience did not yield similar benefits: instead, it increased the time between fixating the alert and responding, as high-salience alerts interfered with alert-task execution. Such task interference by high-salience alert-signals counteracts their more efficient attentional guidance. The design of alert signals must be adapted to a "sweet spot" that optimizes this stimulus-dependent trade-off between maximally rapid attentional orienting and minimal task interference.


Conflict of interest statement

The authors declare no competing interests.

Figures

Figure 1
Figure 1
Stimuli and paradigm. (a) Layout of the response pad (not to scale), (b) layout of the screen in an alert trial (not to scale), (c) alert-task square and surrounding frame with relevant distances (visual angle), approximately to scale; (d) two trials, no-alert trial followed by alert trial, time runs from top to bottom: (i) a central square is presented with a gap (primary task), (ii) upon button press, the gap closes, (iii) upon button release, the next trial starts, the alert-task square, the frame and the tone are onset (alert task), (iv) the tone ends (in Experiment 1 and 2 after 200 ms, in Experiment 3 after a condition-dependent duration; note that the subsequent events can occur before the tone offset), (v) the participant fixates the alert square (failure to do so results in discarding the trial), (vi) the participant responds to the alert-task square, (vii) the alert-task square disappears (vii’) in Experiment 2, the frame disappears after a condition-dependent interval, independent of the conclusion of the alert task, in Experiment 3 the frame disappears after 200 ms, (viii) the participant presses the button to complete the primary task of the alert trial. The durations that are used as dependent variables throughout (time to fixation, reaction time (RT) alert task, reaction time primary task, fixation-to-response delay) are given to the right. Fixation duration is defined as the time between the start of the fixation on the alert square and its end.
Figure 2
Figure 2
Variables of interest as a function of contrast (left) and sound pressure level (right). (a,b) time to fixation, (c,d) alert reaction time, (e,f) primary task reaction time, (g,h) fixation duration, (i,j) primary task reaction time. Results of follow-up tests in case of significant main effects are given in part 2 of the Supplementary Material.
Figure 3
Figure 3
Results of Experiment 1. (a,b) “time to fixation” as function of contrast (visual salience, panel a) or sound level (auditory salience, panel b) for the same individual, black points denote individual trials, red points denote medians, line corresponds to best linear fit to median values, from which the individual slope is determined, c-g) mean individual slopes for time to fixation (panel c), reaction time to the alert (panel d), time from first fixation to response to the alert (panel e), fixation duration (panel f), and reaction time to the primary task in alert trials (panel g). The same vertical scale is used in all plots; errorbars denote s.e.m. across participants, significance markers at bars refer to comparisons to 0, significance markers between bars to comparison between modalities (*p < 0.05, **p < 0.01, ***p < 0.001).
Figure 4
Figure 4
Results of Experiment 2. (a) Time to first fixation on the alert square as function of alert-frame duration for the two different contrast levels, mean and s.e.m. across participants; (b) Data of panel a averaged across contrast levels; mean and s.e.m. across participants; (c) reaction time to the alert as function of alert-frame duration, notation as in panel a; (d) data of panel c averaged across contrast levels; notation as in panel b; (e) time from first fixation on the alert square to the response to the alert as function of alert-frame duration, notation as in panel a; (f) data of panel e averaged across contrast levels; notation as in panel b; (g) fixation duration as function of alert-frame duration, notation as in panel a (h) data of panel g averaged across contrast levels; notation as in panel b; (i) reaction time to the primary task in alert trials as function of alert-frame duration, notation as in panel a.
Figure 5
Figure 5
Results of Experiment 3. (ae) Dependent variables as function of alert-tone duration, sound level denoted by grayscale as indicated in panel a; mean and s.e.m. across participants. (a) time to fixation on alert-task square, (b) reaction time to the alert, (c) time from fixating the alert-task square to responding to the alert task, (d) duration of first fixation on the alert-task square, (e) reaction time to the primary task in alert trials.
Figure 6
Figure 6
Results of Experiment 4. (a-e) Dependent variables as function of sound level, contrast before the saccade and contrast after the saccade (see legend on top); (a) time to fixation on alert-task square, (b) reaction time to the alert task, (c) time from fixating the alert-task square to responding to the alert task, (d) duration of first fixation on the alert-task square, (e) reaction time to the primary task in alert trials.

References

    1. McLaughlin AC, Mayhorn CB. Designing effective risk communications for older adults. Saf. Sci. 2014;61:59–65. doi: 10.1016/j.ssci.2012.05.002. - DOI
    1. Patterson RD. Auditory warning sounds in the work environment. Philos. Trans. R. Soc. Lond. B Biol. Sci. 1990;327(1241):485–492. doi: 10.1098/rstb.1990.0091. - DOI - PubMed
    1. Baldwin CL, Eisert JL, Garcia A, Lewis B, Pratt SM, Gonzalez C. Multimodal urgency coding: Auditory, visual, and tactile parameters and their impact on perceived urgency. Work. 2012;41:3586–3591. doi: 10.3233/WOR-2012-0669-3586. - DOI - PubMed
    1. Edworthy J, Loxley S, Dennis I. Improving auditory warning design: Relationship between warning sound parameters and perceived urgency. Hum. Factors. 1991;33(2):205–231. doi: 10.1177/001872089103300206. - DOI - PubMed
    1. Fagerlönn J. Urgent alarms in trucks: Effects on annoyance and subsequent driving performance. Intell. Trans. Sys. 2011;5(4):252–258. doi: 10.1049/iet-its.2010.0165. - DOI