. 2024 Apr 17;14(1):8835.
doi: 10.1038/s41598-024-59052-0.

Tumor promoting effect of spheroids in an orthotopic prostate cancer mouse model

Affiliations

Tumor promoting effect of spheroids in an orthotopic prostate cancer mouse model

Julius Lars Daniel Bastian et al. Sci Rep. .

Abstract

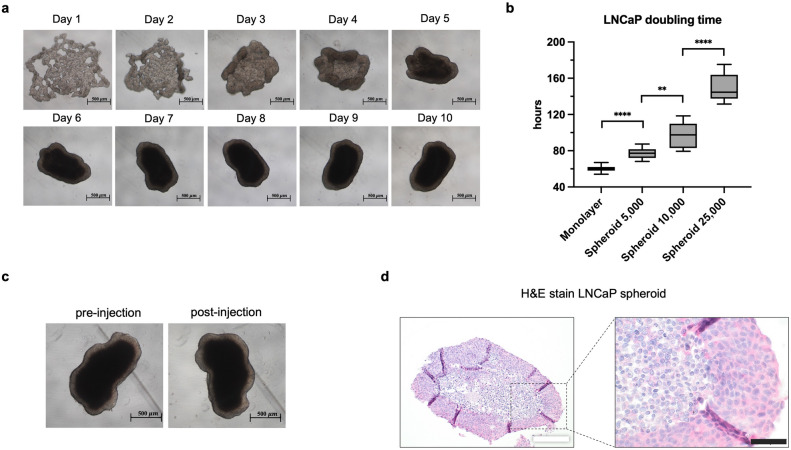
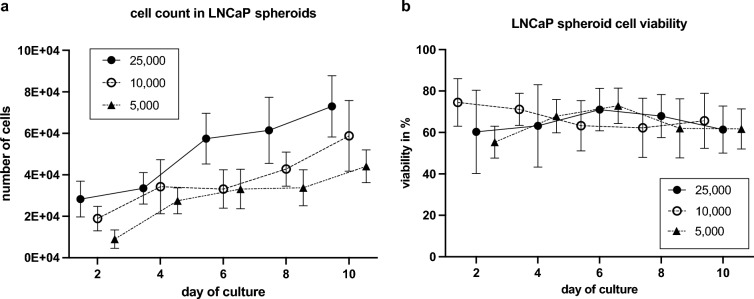
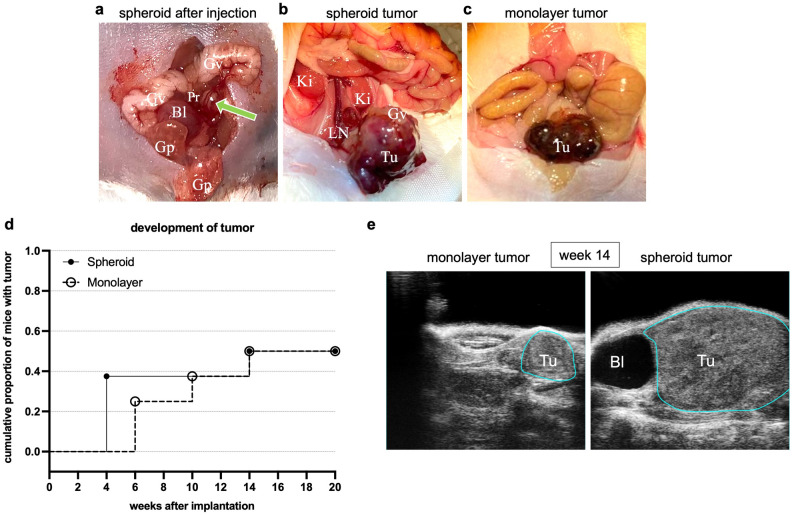
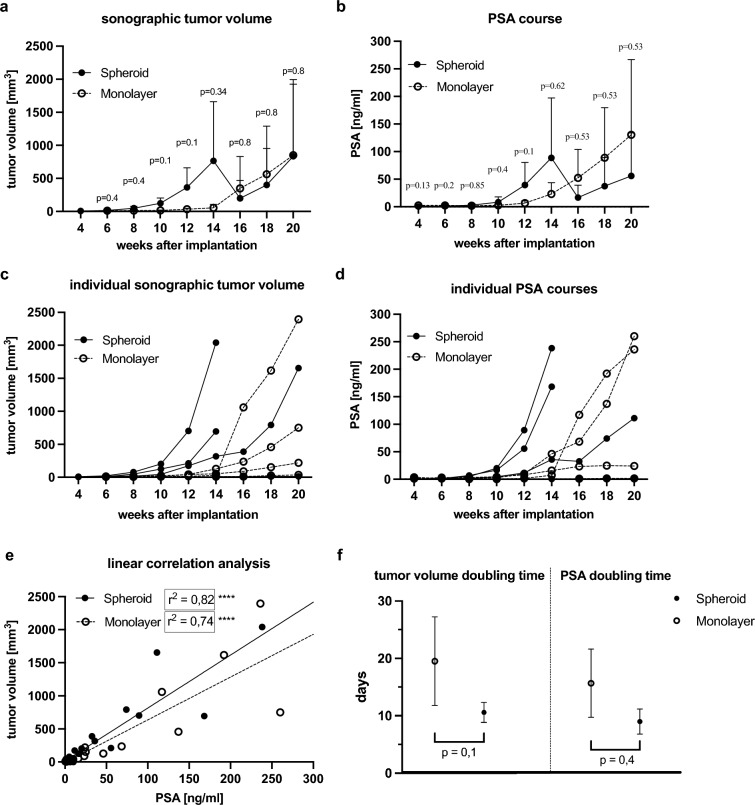
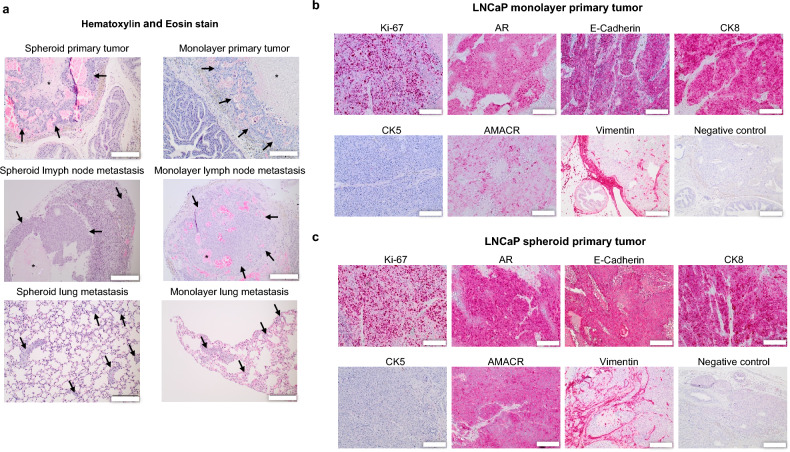
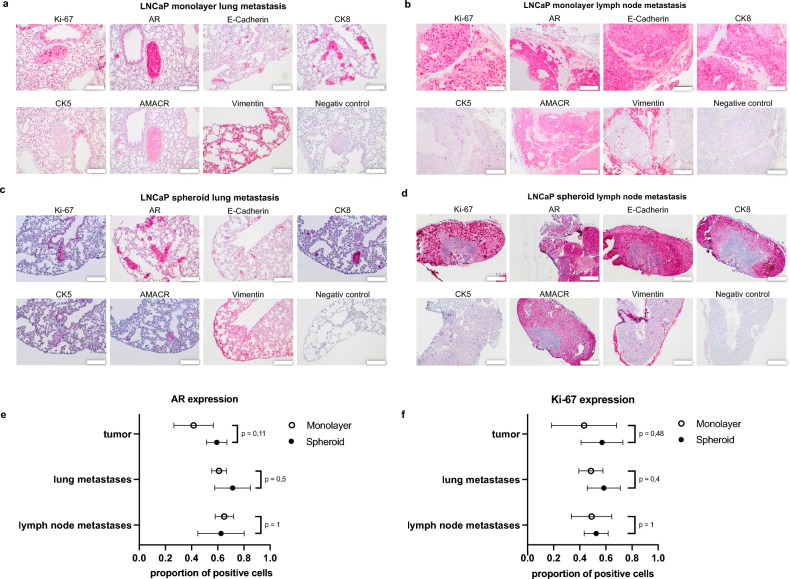
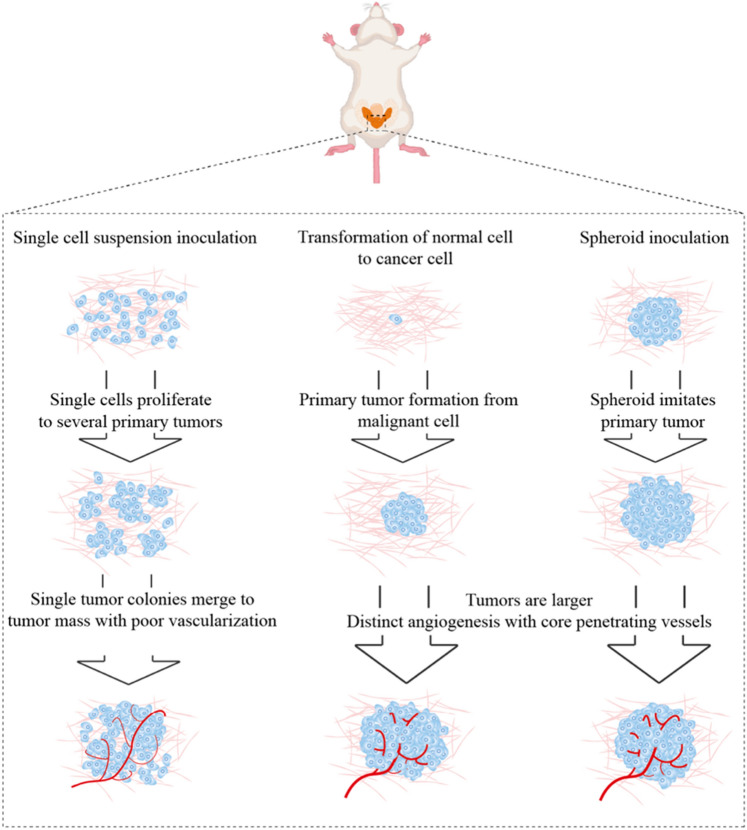
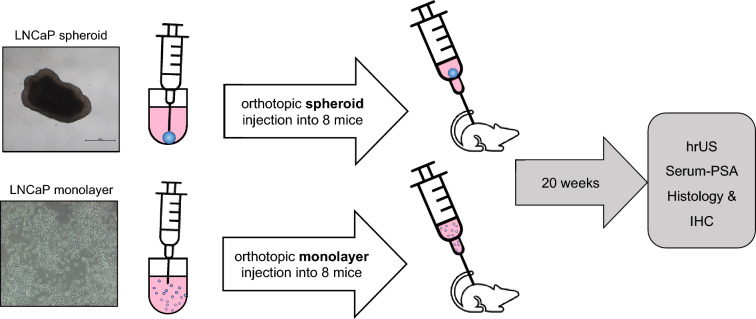
In this study, we aimed to establish a technique for intraprostatic implantation of prostate cancer (PCa) spheroids and to identify the impact of three-dimensional organization of PCa cells on tumor progression and metastasis in a representative in vivo model. 40,000 LNCaP cells were implanted into the prostate of immunodeficient SCID mice either as single cells (n = 8) or as preformed 3D spheroids (n = 8). For a follow up of 20 weeks, tumor growth was monitored by serum PSA and high-resolution 3D ultrasonography. Eventually, animals were sacrificed and autopsied. The organ dissects were analyzed for the presence of metastases by histology (H&E) and immunohistochemistry (AMACR, AR, Ki-67, CK5, CK8, E-Cadherin, Vimentin). Solid intraprostatic tumors developed in 50% of mice after spheroid implantation and in 50% of mice after implantation of a single cells. Primary tumors of LNCaP spheroids evolved earlier, exhibiting a shorter tumor doubling time whilst developing larger tumor volumes, which was reflected by a higher immunohistochemical expression of Ki-67 and AR, too. Spheroid tumors established lung and lymph node metastases in 75% of mice, in contrast to 50% of mice after single cell implantation. Our technique enables a variety of studies regarding the influence of the tumor microenvironment on PCa progression.


Conflict of interest statement

The authors declare no competing interests.

Figures

Figure 1
Figure 1
LNCaP spheroid morphology and doubling time. (a) Microscopic morphology of a spheroid within ten days after seeding in 96 well ULA plates (scale bar = 500 μm). (b) Doubling time (hours) in LNCaP monolayer and spheroids with increasing initial cell number (5,000; 10,000; 25,000). (Box plots min to max; n = 7; **** ≙ p < 0.0001; ** ≙ p < 0.01). (c) Microscopic integrity of a spheroid pre- and post-injection with a 20 G needle (scale bar = 500 μm). (d) Hematoxylin and Eosin stain of a 6-days maturated LNCaP spheroid from initially 25,000 seeded cells (white scale bar = 200 μm; black scale bar = 50 μm).
Figure 2
Figure 2
Cell count and viability of LNCaP spheroids. (a) Cell count in LNCaP spheroids with different initial cell numbers (5,000; 10,000; 25,000) within ten days (mean with SD; n = 7). (b) Cell viability in LNCaP spheroids with different initial cell numbers (5,000; 10,000; 25,000) within ten days (mean with SD; n = 7).
Figure 3
Figure 3
Orthotopic tumor growth. (a) Intraoperative situs after successful intraprostatic implantation of a LNCaP spheroid (marked with green arrow). (b,c) Intraoperative situs after 20 weeks with formation of a tumor (Tu) after LNCaP spheroid and LNCaP monolayer implantation (tenfold magnification). The glandulae vesiculosae (Gv), the glandulae praeputiales (Gp), the urinary bladder (Bl), the kidneys (Ki) and the left anterior prostate lobe (Pr) are visible. After twenty weeks, the implanted spheroid proliferated into a large tumor (Tu) with formation of lymph node metastases (LN). (d) Cumulative proportion of mice with tumor development within 20 weeks after implantation of a spheroid or single cell suspension from monolayer culture. (e) High-resolution ultrasonography images of a monolayer and spheroid tumor (Tu) at week 14. The tumors are marked with a blue line. Bl = bladder.
Figure 4
Figure 4
Development of primary tumor volume and serum PSA. (a) Sonographic tumor volume after orthotopic implantation of a spheroid (initial cell number 25,000) and injection of a cell-number matched single cell suspension from monolayer culture (40,000 cells per injection) in the span of 20 weeks (mean with SD). (b) PSA course of mice within 20 weeks after implantation (mean with SD). (c) Individual sonographic tumor volumes. (d) Individual PSA courses. (e) Linear correlation analysis of tumor volume and PSA in spheroid and monolayer tumors (**** ≙ p < 0.0001). (f) Tumor volume doubling times and PSA doubling times in days in spheroid and monolayer tumors (mean with SD).
Figure 5
Figure 5
Histology and immunohistochemistry. (a) Histological evaluation (H&E staining) of spheroid and monolayer primary tumors and metastases. Tumors and metastases are labeled with arrows. Central necroses is labeled with asterisks (*). Scale bar = 200 μm. (b,c) Immunohistochemical expression of Ki-67, AR, E-Cadherin, CK8, CK5, AMACR and Vimentin in LNCaP monolayer and spheroid primary tumors. Scale bar = 200 μm.
Figure 6
Figure 6
Immunohistochemistry of metastases and quantification of AR and Ki-67 expression in primary tumor and metastases. Immunohistochemical expression of Ki-67, AR, E-Cadherin, CK8, CK5, AMACR and Vimentin in LNCaP monolayer lung metastases (a), monolayer lymph node metastases (b), spheroid lung metastases (c) and spheroid lymph node metastases (d). Scale bar = 200 μm. (e) Proportion of LNCaP cells with nuclear AR expression in primary tumors, lung and lymph node metastases of monolayer and spheroid tumors (mean with SD). (f) Proportion of Ki-67 expressing LNCaP cells in primary tumors, lung and lymph node metastases of monolayer and spheroid tumors (mean with SD).
Figure 7
Figure 7
Schematic illustration of a hypothetical rationale for an accelerated tumor progression and metastasis in LNCaP spheroids compared to LNCaP single cells in relation to natural tumor development. Modified from Szade et al..
Figure 8
Figure 8
Schematic illustration of the in vivo experiment setup and follow-up. Eight mice were implanted orthotopically with one LNCaP spheroid each consisting of 40,000 LNCaP cells. Another eight mice in the control group received orthotopic injection of 40,000 LNCaP cells as single cell suspension. The follow-up period lasted 20 weeks and included regular ultrasonography and PSA measurements. After autopsy, the dissected organs were evaluated by histology and immunohistochemistry. hrUS = high-resolution 3D ultrasonography; IHC = immunohistochemistry.

Similar articles

Cited by

References

    1. Sung H, et al. Global Cancer Statistics 2020: GLOBOCAN estimates of incidence and mortality worldwide for 36 cancers in 185 countries. CA Cancer J. Clin. 2021;71:209–249. doi: 10.3322/caac.21660. - DOI - PubMed
    1. Johns LE, Houlston RS. A systematic review and meta-analysis of familial prostate cancer risk. BJU Int. 2003;91:789–794. doi: 10.1046/j.1464-410x.2003.04232.x. - DOI - PubMed
    1. Nowossadeck E, Kowalski C, Barnes B. Demografische Alterung und Krebs. Onkologie heute. 2018;3:48–50.
    1. Sailer V, et al. Experimental in vitro, ex vivo and in vivo models in prostate cancer research. Nat. Rev. Urol. 2023;20:158–178. doi: 10.1038/s41585-022-00677-z. - DOI - PubMed
    1. Ellem SJ, De-Juan-Pardo EM, Risbridger GP. In vitro modeling of the prostate cancer microenvironment. Adv. Drug Deliv. Rev. 2014;79–80:214–221. doi: 10.1016/j.addr.2014.04.008. - DOI - PubMed