. 2024 Jun;9(6):1483-1498.
doi: 10.1038/s41564-024-01664-3. Epub 2024 Apr 17.

tRNA modification reprogramming contributes to artemisinin resistance in Plasmodium falciparum

Affiliations

tRNA modification reprogramming contributes to artemisinin resistance in Plasmodium falciparum

Jennifer L Small-Saunders et al. Nat Microbiol. 2024 Jun.

Abstract

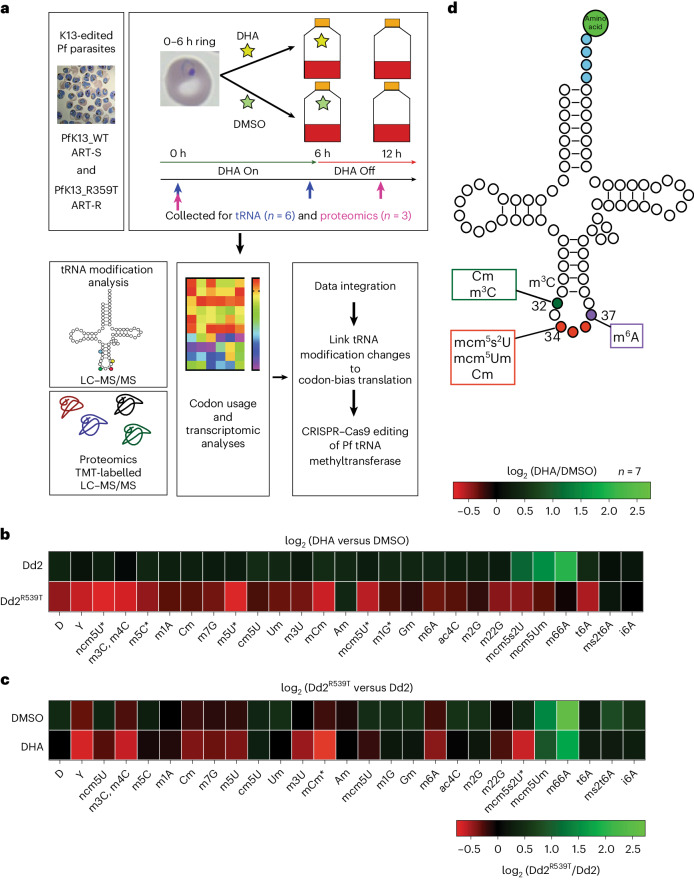
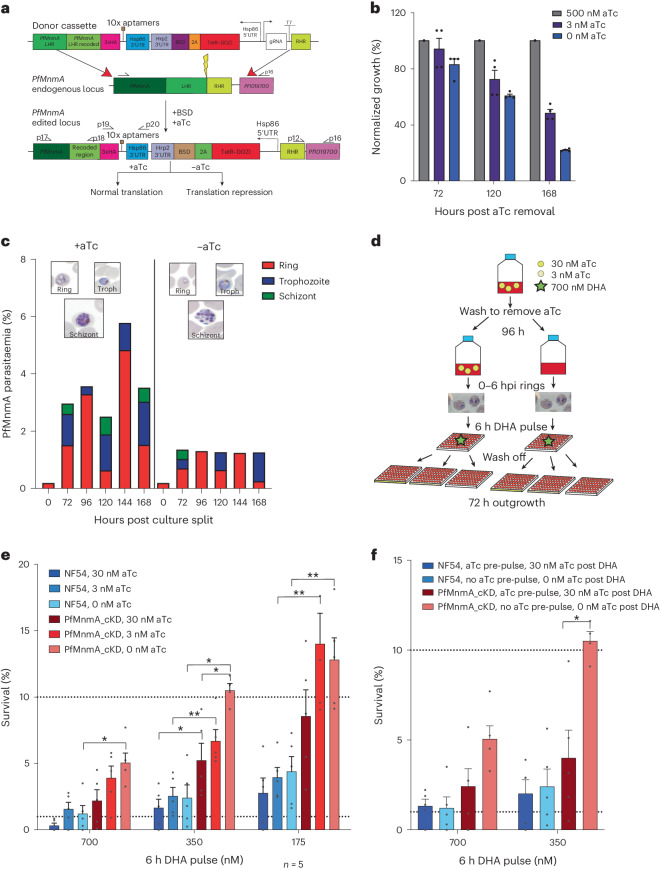
Plasmodium falciparum artemisinin (ART) resistance is driven by mutations in kelch-like protein 13 (PfK13). Quiescence, a key aspect of resistance, may also be regulated by a yet unidentified epigenetic pathway. Transfer RNA modification reprogramming and codon bias translation is a conserved epitranscriptomic translational control mechanism that allows cells to rapidly respond to stress. We report a role for this mechanism in ART-resistant parasites by combining tRNA modification, proteomic and codon usage analyses in ring-stage ART-sensitive and ART-resistant parasites in response to drug. Post-drug, ART-resistant parasites differentially hypomodify mcm5s2U on tRNA and possess a subset of proteins, including PfK13, that are regulated by Lys codon-biased translation. Conditional knockdown of the terminal s2U thiouridylase, PfMnmA, in an ART-sensitive parasite background led to increased ART survival, suggesting that hypomodification can alter the parasite ART response. This study describes an epitranscriptomic pathway via tRNA s2U reprogramming that ART-resistant parasites may employ to survive ART-induced stress.


Conflict of interest statement

The authors declare no competing interests

Figures

Fig. 1
Fig. 1. ART-R parasites differentially alter their tRNA modifications in response to ART stress.
a, The workflow for data generation and integration to assess tRNA modification and proteomic changes as well as codon bias translation. Isogenic, edited Dd2 (ART-S harbouring K13-silent binding-site mutations) and Dd2R539T (ART-R K13 R539T mutant) P. falciparum (Pf) parasites were sorbitol synchronized to early ring stages (0–6 hpi) then pulsed with either 700 nM DHA or 0.1% DMSO. For tRNA experiments, samples were collected at 0 and 6 h post-exposure. For proteomics, samples were collected at 0 h and 12 h, with the drug having been removed by wash offs at 6 h. tRNA molecules were purified and modifications analysed by LC–MS/MS. Proteomics was performed using TMT-tagged samples and LC–MS/MS (Methods). Codon bias analysis was run using a codon-counting algorithm and further analysed by principal component analysis. These data were combined to identify particular modification changes that led to codon bias changes. Findings were validated using a cKD of the tRNA 2-thiouridylase PfMnmA. b,c, Changes in the relative quantities of modified ribonucleosides, as quantified by LC–MS/MS in total tRNA extracted from parasites at the timepoints indicated in a. Average fold-change values (range −0.8 to 2.7) were calculated for DHA treatment versus DMSO treatment of the Dd2R539T or Dd2 parasites (relative to t = 0 values) (b) or Dd2R539T parasites versus Dd2 parasites for either DMSO treatment or DHA treatment (c). The results were subjected to hierarchical clustering analysis (log2 transformed data). n = 7 independent biological replicates. Statistics were performed using two-tailed t-tests on data normalized to t = 0, *P < 0.05% (Source data). D, dihydrouridine; Y, pseudouridine. d, A schematic of the tRNA secondary structure with location of key modifications. Wobble positions 34–36 are shown in red, position 37 is shown in purple and position 32 is shown in green. Source data
Fig. 2
Fig. 2. The Dd2R539T parasite proteome is differentially altered after DHA exposure.
TMT-tagged proteomics analysis identified 1,315 proteins with 40,955 PSMs from Dd2 or Dd2R539T parasites at 0 h or 12 h after a 6 h DHA or DMSO pulse. Isogenic, edited Dd2 and Dd2R539T parasites were highly sorbitol synchronized to early ring stages (0–6 hpi) then pulsed with either 700 nM DHA or 0.1% DMSO. Samples were collected at 0 h and 12 h, with the drug having been removed by wash offs at 6 h (Fig. 1a). a, A heat map of hierarchical clustering analysis of log2-transformed fold changes in the protein levels of each proteome normalized to the Dd2 t = 0 proteome. be, Venn diagrams showing unique and common significant proteins and their GO terms in the Dd2 or Dd2R539T parasite proteomes that were upregulated at 0 h (b), upregulated post-DMSO vehicle control (c) and upregulated (d) or downregulated post DHA (e). PTEX, Plasmodium translocon of exported proteins. Source data
Fig. 3
Fig. 3. A subset of proteins, including K13, are regulated by lysine codon bias translation in Dd2R539T parasites.
a, The top 44 upregulated proteins and bottom 70 downregulated proteins in Dd2R539T parasites after DHA exposure were analysed for codon usage patterns (Source data). The codon usage percentages in each gene were used to prepare a data matrix for principal component analysis. The scores plot shows codon use distinction between increased proteins and decreased proteins, with changes greatest in decreased proteins along PC1. b, The corresponding loadings plot for a shows codons contributing most strongly to this separation. For ease of visualization, unchanged codons were removed with the full loadings plot shown in Extended Data Fig. 3a. Cognate codon pairs significantly contributing to this separation are joined by coloured lines (Lys, pink; Asp, blue; His, orange and Asn, green). c, An assessment of differentially regulated proteins for lysine codon usage versus transcriptional direction post-DHA in Dd2R539T parasites. Increased proteins and decreased proteins were evaluated for LysAAA codon usage with z-scores >0.5 or <−0.5 considered significant (y axis). Transcriptomic data from Mok et al. were analysed for Dd2R539T parasites after a 6 h DHA pulse and assessed for log2 fold change compared with parasites at timepoint 0 (Source data and Extended Data Fig. 3). Candidate proteins regulated by Lys codon bias translation were considered those that displayed Lys codon bias and had either increased abundance with decreased translation (red-shaded region, Supplementary Table 3) or decreased abundance with increased translation (blue-shaded region, Supplementary Table 4). Proteins that met criteria are numbered and detailed in Table 1. d, Box-and-whisker plot showing Lys codon usage for all differentially translated proteins. The z-score for LysAAA codon usage for increased proteins and decreased proteins as compared with the z-score for LysAAG codon usage for increased and decreased proteins. Data were derived from n = 3 independent biological replicates. Centre line, median; box limits, upper and lower quartiles; and whiskers, minimum and maximum values. e, GO analysis for increased and decreased codon bias proteins with the number of genes per GO slim term on the x axis. The heat map shading represents −log10 P values (two-tailed Fisher exact test) (Supplementary Tables 3 and 4). Source data
Fig. 4
Fig. 4. Knockdown of PfMnmA, the terminal thiouridylase in s2U biosynthesis, leads to increased ART survival.
a, A schematic of donor plasmid PSN054, the endogenous Pf3D7_1019800 (PfmnmA) locus and the recombinant locus of the edited cKD parasite. +aTc, normal translation and −aTc, protein knockdown. Edited parasites were confirmed via PCR and western blot analyses (Extended Data Fig. 5a,b). UTR, untranslated region; BSD, blasticidin S deaminase; LHR, left homology region. b,c, Synchronized, ring-stage PfMnmA_cKD parasites were washed to remove aTc and assayed in parallel with NF54 parasites. Washed parasites were inoculated in high (500 nM), low (3 nM) or no (0 nM) aTc and growth was followed by flow cytometry (b). Data were normalized to high aTc parasitaemias and represented as a percentage of growth. n = 5 independent biological replicates. The error bars represent ±s.e.m. Washed parasites were cultured ±aTc. Thin smears were Giemsa stained and 100 RBCs were counted (c). The y axis shows total parasitaemias (Extended Data Fig. 5d). d, A schematic of the modified RSA. Parasites were cultured with aTc, washed 3× and split into cultures ±aTc for 96 h. Synchronized, early ring-stage parasites (0–6 hpi) were exposed to a 6 h pulse of a range of DHA concentrations, the drug was washed off and then allowed to recover in 30 nM, 3 nM or 0 nM aTc for 72 h. e, RSA survival rates for NF54 and PfMnmA_cKD parasites cultured −aTc for 96 h before DHA exposure and allowed to recover on 30 nM, 3 nM or 0 nM aTc for 72 h. The results demonstrate the percentage of parasites that survived a range of DHA concentrations (≤700 nM aTc) relative to no-drug control parasites assayed in parallel. Percent survival values are shown as means ± s.e.m. f, RSA survival rates for parasites without MnmA knockdown (maintained with aTc) and with MnmA knockdown (maintained without aTc) exposed to 700 nM and 350 nM DHA for 6 h. n = 5 independent biological replicates. Statistical significance was determined via two-tailed Mann–Whitney U-tests as compared with the isogenic line or for the knockdown ±aTc. *P < 0.05 and **P < 0.01 (Source data and Extended Data Fig. 8). Source data
Fig. 5
Fig. 5. PfMnmA contributes to parasite responses to multiple stressors.
a, A schematic of molecular sites of action for anti-malarials used in this study. Hb, haemoglobin; LUM, lumefantrine; MFQ, mefloquine; PPQ, piperaquine. be,g, IC50 data shown as means ± s.e.m. from 72 h dose–response assays of asynchronous NF54 parasites ±aTc, PfMnmA parasites cultured with aTc and PfMnmA parasites cultured without aTc for 96 h before drug pulse (Extended Data Fig. 9a) for FSM (b), AZT (c), DSM265 (d), ATQ (e) and WLL (g). n = 5–7. Statistical significance was determined via two-tailed Mann–Whitney U-tests. *P < 0.05 and **P < 0.01. f, Dose–response curves for ATQ for NF54 parental line with and without aTc, PfMnmA parasites cultured with aTc and PfMnmA parasites cultured without aTc for 96 h before drug pulse, and Dd2 and Dd2_ATQ-R (ATQ resistant, Dd2-CYT1-V259L). The error bars represent s.e.m. n = 6–7 independent biological replicates per parasite line. Source data
Extended Data Fig. 1
Extended Data Fig. 1. A population of Dd2R539T parasites, but not Dd2 parasites, persist as ring stages after dihydroartemisinin (DHA) treatment.
Giemsa-stained parasite images illustrate pyknotic parasites in DHA-pulsed Dd2 parasites but a subset of surviving ring-stage parasites in DHA-pulsed Dd2R539T, as determined 12 h and 24 h post drug treatment. DMSO-treated parasites in both lines progressed normally through the ABS cycle. ~25% of Dd2R539T parasites survived. At least 500 cells were counted for each condition.
Extended Data Fig. 2
Extended Data Fig. 2. Volcano plots of proteomic data comparing the Dd2 and Dd2R539T parasite lines at 0 h and post DHA or DMSO.
TMT-tagged proteomics analysis resulted in 1,315 proteins with 40,955 peptide spectral matches from Dd2 or Dd2R539T parasites at 0 h or 12 h (6 h DHA or DMSO pulse and recovery). Isogenic, edited Dd2 (binding-site mutant, artemisinin-sensitive) and Dd2R539T (artemisinin-resistant) parasites were highly sorbitol synchronized to early ring stages (0-6 h post invasion, hpi) then pulsed with either 700 nM DHA or 0.1% DMSO. Samples were collected at t=0 (pink arrows, Fig. 1a), parasites underwent thorough drug wash-off at 6 h, and samples were collected at 12 h (pink arrows, Fig. 1a). Volcano plots showing p-values (-log10) versus log2 transformed fold changes for differentially changing proteins in Dd2 parasite proteomes (first column) for (a) 0 h vs 12 h DMSO and (b) 12 h DHA vs 12 h DMSO; Dd2R539T parasite proteomes (second column) for (c) 0 h vs 12 h DMSO, (d) 0 h DHA vs 12 hr DHA and (e) 12 h DHA vs 12 h DMSO; and Dd2 vs. Dd2R539T parasite proteomes (third column) at (f) 0 h or after (g) DMSO or (h) DHA treatment. Red circles: increased proteins with significant changes between the two conditions; blue: decreased proteins with significant changes between the two conditions; black: unaltered proteins between the two conditions. Significant changes were assessed as log2 fold change > 0.4 or < −0.4 and adjusted p value < 0.05. p-value calculations were performed using a linear mixed-effects model fit performed in the MSstatsTMT script96.
Extended Data Fig. 3
Extended Data Fig. 3. A subset of proteins are regulated by histidine and aspartate codon bias translation in Dd2R539T parasites.
(a) Full loadings plot as shown in Fig. 3b without codons removed. Assessment of proteins with differential abundance and their His (b) or Asp (c) codon usage vs transcriptional direction post-DHA in Dd2R539T parasites. Increased proteins (His-orange circles; Asp- circles) and decreased proteins (His- green squares; Asp- purple squares) were evaluated for HisCAT (b) or AspGAT (c) codon usage with z-scores > 0.5 or < −0.5 considered significant (y-axis). Transcriptomic data from Mok et al. were analyzed for Dd2R539T parasites after a 6 h DHA pulse and assessed for log2 fold change compared to time point t=0 (Source Data for both Fig. 3 and Extended Data Fig. 3). Candidate proteins for those regulated by His or Asp codon bias translation were considered proteins that displayed codon-bias and had either increased abundance with decreased transcription (His (b)- orange shaded region, Supplementary Table 5; Asp (c)-pink shaded region, Supplementary Table 7) or decreased abundance with increased transcription (His (b)- green shaded region, Supplementary Table 6; Asp (c)-purple shaded region, Supplementary Table 8). (d) Predicted essentiality of lysine codon-bias translated proteins was determined by transposon mutagenesis. Genes were classified as essential (light red), likely essential (dark red), not essential (light blue), likely not essential (dark blue) and unknown (green), with data noted in Supplementary Tables 3, 4. Source data
Extended Data Fig. 4
Extended Data Fig. 4. K13 is a highly Lysine AAA codon-biased protein whose levels increase after dihydroartemisinin treatment in Dd2R539T parasites.
(a) Analysis of TMT quantified protein levels from proteomics experiments (Fig. 2; Source Data Extended Data Fig. 4). Protein abundance is shown at 0 and 6 h post either DHA or DMSO treatment in Dd2 or Dd2R539T. Individual bioreplicates (n = 4) are shown, with error bars representing ± s.e.m. (b) Lysine codon usage in the K13 protein. Coding sequence was analyzed in Seqbuilder Pro. Every lysine codon in the protein was analyzed for the use of LysAAA or LysAAG. Source data
Extended Data Fig. 5
Extended Data Fig. 5. Validation of PfMnmA_cKD construct.
CRISPR/Cas9 gene editing was used for creation of the PfMnmA_cKD line as shown in Fig. 4a. (a) Four sets of PCRs were used to confirm editing with primers listed in Supplementary Table 10 and shown in Fig. 4a. (b) Western blots probed with anti-HA antibody to confirm loss of MnmA protein expression. PfMnmA_cKD parasites were cultured ± aTc for 96 h prior to harvesting ABS parasites. Parental NF54 parasites were cultured without aTc and harvested in parallel. The arrow points to PfMnmA (130.5 kDa). Top bands represent internal loading controls resulting from HA-antibody cross-reacting proteins. Two independent biological replicates are shown. (c) aTc has no effect on NF54 parasite growth. Highly synchronized, ring-stage NF54attB parasites were inoculated to the same parasitaemia in high (500 nM), low (3 nM) and no (0 nM) aTc. Growth was followed by flow cytometry (see Supplementary Methods) and experiments were run in parallel with PfMnmA_ckD parasites (Fig. 4b). Data were normalized to the parasitaemia at high aTc and represented as a percentage of growth at 3 nM aTc or 0 nM aTc. n = 5 independent biological replicates. Error bars represent SEM. (d) aTc has no effect on NF54 parasite progression through the asexual blood stage life cycle. NF54 was cultured ± aTc. At each of the indicated time points, thin smears were Giemsa stained and 100 RBC were counted (Source Data Fig. 4). Parasites were divided into ring, trophozoite and schizont stages with total parasitaemia shown on the y-axis. NF54 parasites were processed in parallel with PfMnmA_cKD (Fig. 4c). n = 1 biological replicate. Source data
Extended Data Fig. 6
Extended Data Fig. 6. PfMnmA_cKD parasites cultured without aTc show defective schizonts.
PfMnmA cultures were thoroughly washed and cultured ± aTc (Fig. 4c). At each of the indicated time points, thin smears were Giemsa stained. Images are representative of ring, trophozoite and schizont morphology noted at these times. Defects in schizont development appeared as early as 120 h. n = 1 biological replicate.
Extended Data Fig. 7
Extended Data Fig. 7. Knockdown of PfMnmA leads to decrease in mcm5s2U modification levels but not in levels of m6A or m22G modifications.
Highly synchronized PfMnmA_cKD parasites were initially cultured with 500 nM aTc, thoroughly washed, and split into cultures with 500 nM (translation on) or 0 nM (translation off) aTc. The experiment was started with trophozoites. Parasites were harvested at 0, 48 and 96 h after aTc removal. Cultures were also begun with synchronized rings and harvested these at 72 h after aTc removal to recover an additional trophozoite sample. Control cultures propagated with aTc were harvested in parallel. Changes in the relative quantities of (a) mcm5s2U, (b) m22G, or (c) m6A modifications were quantified by LC-MS/MS in total tRNA extracted from parasites at the indicated time points, for +aTC or -aTc. Values are shown as means ± s.e.m. Data for each individual replicate and parasite pair are shown for (d) mcm5s2U, (e) m2,2G, or (f) m6A to demonstrate trends between replicates. n = 2. For the 96 h time point we have a single replicate (with technical duplicates), as the RNA was degraded during the extraction process in replicate 1. Statistical significance was determined via two-tailed paired t-tests. p<0.05 for mcm5s2U modification changes ± aTc and p>0.1 for m22G and m6A modifications changes ± aTc (Source Data Extended Data Fig. 7). Source data
Extended Data Fig. 8
Extended Data Fig. 8. Ring-stage survival assays demonstrating that knockdown of PfMnmA for 96 hr prior to dihydroartemisinin (DHA) pulse leads to increased resistance, while knockdown after DHA pulse has no effect.
RSAs were performed as outlined in Fig. 4d. Highly synchronized 0-6 h ring stage parasites cultured for 96 h without aTc (a) or with aTc (b) prior to drug pulse were exposed to a 6 h pulse of a range of DHA concentrations, drug was washed off 3× and parasites were allowed to recover on plates with 30 nM aTc, 3 nM aTc or 0 nM aTc for 72 h. Results demonstrate the percentage of early ring-stage parasites (0-6 hpi) that survived a range of DHA concentrations beginning at 700 nM aTc relative to no-drug control parasites assayed in parallel. Percent survival values are shown as means ± s.e.m. n = 5 independent biological replicates. Statistical significance was determined via two tailed Mann Whitney U tests as compared to the isogenic line or for the knockdown ± aTc. *p< 0.05 and **p< 0.01 (Source Data Extended Data Fig. 8 and Supplementary Fig. 2). Source data
Extended Data Fig. 9
Extended Data Fig. 9. IC50 data shown as mean ± SEM from 72 h dose–response assays of asynchronous NF54 and PfMnmA knockdown parasites.
(a) Schematic of 72 h growth assay set up. NF54 parasites and PfMnmA parasites were washed 96 h prior to experiment and split into 30 nM or 0 nM aTc cultures. For experiment, parasites were washed and cultured with (30 nM) or without (0 nM) aTc and (b) piperaquine, (c) pyronaridine, (d) lumefantrine, and (e) mefloquine. n = 5 to 7 independent biological replicates per parasite line. Statistical significance was determined via two-tailed Mann Whitney U tests. *p<0.05, **p<0.01. (f) Heat shock survival for highly synchronized trophozoite (26-34 hpi) NF54 parental parasites ± aTc, PfMnmA_cKD parasites cultured with aTc, and PfMnmA_cKD parasites cultured without aTc for 96 h prior to exposure to either 37 °C or 42 °C for 3 or 6 h. Percent survival is compared to the control parasite sample that did not undergo heat shock (Source Data Extended Data Fig. 9). Error bars are s.e.m. n = 3 to 5 independent biological replicates per parasite line. Source data
Extended Data Fig. 10
Extended Data Fig. 10. Working model for the role of s2U tRNA modification reprogramming in resistance to artemisinin in both ART-sensitive and -resistant parasites.
(a) Sensitive, K13-wild-type parasites have normal levels of hemoglobin endocytosis leading to normal levels of hemoglobin-derived peptides and amino acids,, presumably including cysteine and methionine. This enables normal thiouridine modifications and normal parasite growth. In response to artemisinin pressure, s2U modifications increase (Fig. 1b, c); however, the overwhelming cellular stress leads to all parasites dying. (b) Artemisinin-resistant, K13 R539T parasites have reduced hemoglobin endocytosis and hemoglobin-derived peptides,, likely leading to reduced availability of sulfur-containing amino acids cysteine and methionine. Parasites sense decreased levels leading to s2U hypomodification (Fig. 1b, c). This results in decreased parasite growth, possibly via ribosomal stalling on -A ending Glu, Gln and Lys codons, reprogramming of parasite metabolism, or both. s2U hypomodification also leads to increased levels of proteotoxic stress and increases in the unfolded protein response (Fig. 2c). This enables a subpopulation of parasites to survive ART pulse. At 6 h post drug pulse, enzymes in the U34 thiol modification pathway, including PfMnmA are transcriptionally upregulated. This likely increases s2U modifications, which results in Lys codon-biased translation in the post-ART parasite proteome (Fig. 3). Subsequent upregulation of LysAAA enriched proteins, including K13 and its interacting partner BIP, may enable rapid increases in K13 protein levels required for parasites to resume growth (Extended Data Fig. 4). LysAAA enriched proteins also include members of the unfolded protein response. Downregulated LysAAG-enriched proteins include ribosomal proteins and the eukaryotic elongation factor eef1-α. Together these alterations may prime the subpopulation of surviving parasites for growth after ART removal.

Similar articles

Cited by

References

    1. World malaria report. WHOhttps://www.mmv.org/sites/default/files/content/document/world-malaria-r... (2023).
    1. Dhorda M, Amaratunga C, Dondorp AM. Artemisinin and multidrug-resistant Plasmodium falciparum—a threat for malaria control and elimination. Curr. Opin. Infect. Dis. 2021;34:432–439. doi: 10.1097/QCO.0000000000000766. - DOI - PMC - PubMed
    1. Siddiqui FA, Liang X, Cui L. Plasmodium falciparum resistance to ACTs: emergence, mechanisms, and outlook. Int. J. Parasitol. Drugs Drug Resist. 2021;16:102–118. doi: 10.1016/j.ijpddr.2021.05.007. - DOI - PMC - PubMed
    1. Rosenthal PJ, Asua V, Conrad MD. Emergence, transmission dynamics and mechanisms of artemisinin partial resistance in malaria parasites in Africa. Nat. Rev. Microbiol. 2024 doi: 10.1038/s41579-024-01008-2. - DOI - PubMed
    1. Ariey F, et al. A molecular marker of artemisinin-resistant Plasmodium falciparum malaria. Nature. 2014;505:50–55. doi: 10.1038/nature12876. - DOI - PMC - PubMed

MeSH terms