. 2024 Apr 17;14(1):8909.
doi: 10.1038/s41598-024-59202-4.

Shark genome size evolution and its relationship with cellular, life-history, ecological, and diversity traits

Affiliations

Shark genome size evolution and its relationship with cellular, life-history, ecological, and diversity traits

Mario Torralba Sáez et al. Sci Rep. .

Abstract

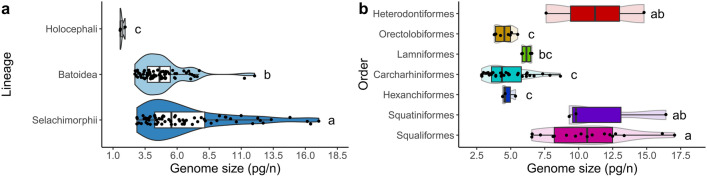
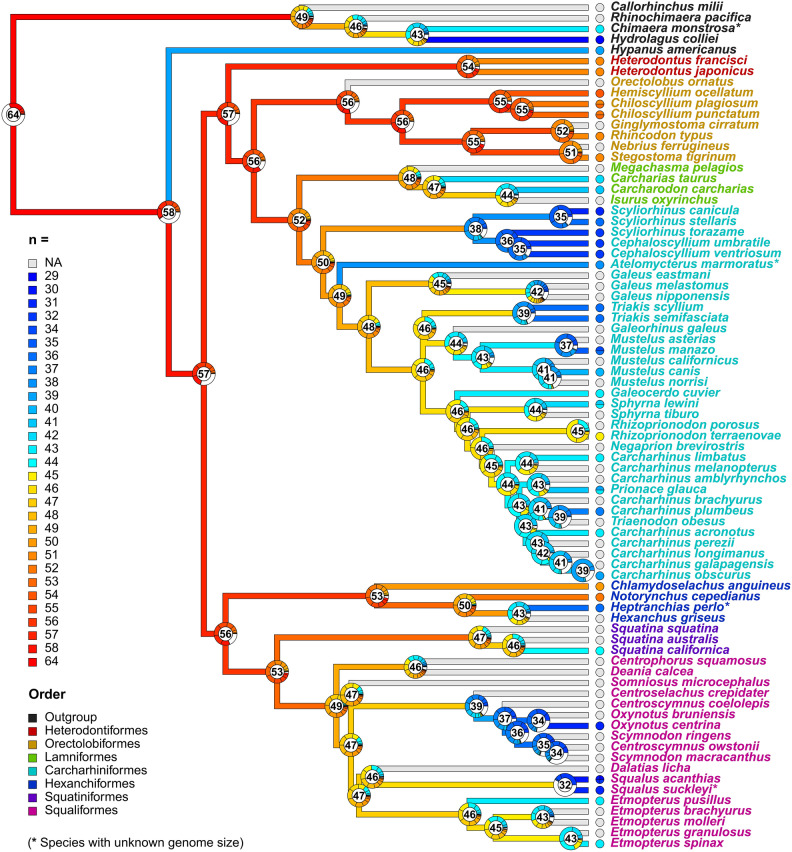
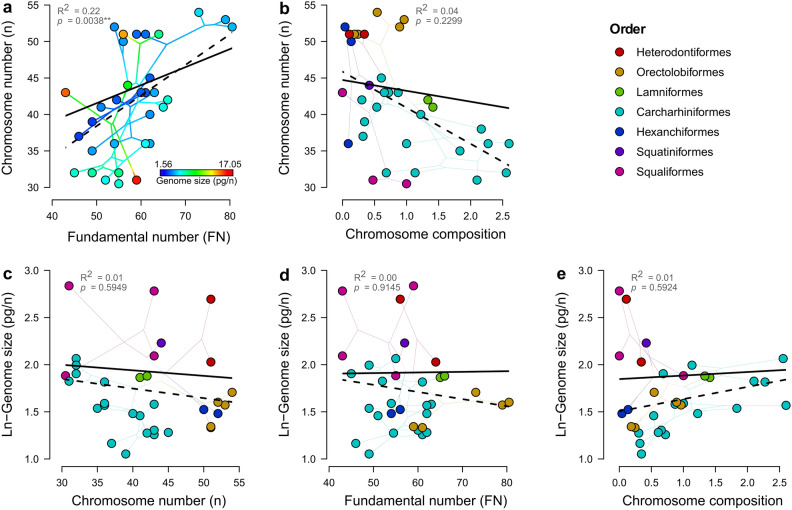
Among vertebrates, sharks exhibit both large and heterogeneous genome sizes ranging from 2.86 to 17.05 pg. Aiming for a better understanding of the patterns and causalities of shark genome size evolution, we applied phylogenetic comparative methods to published genome-size estimates for 71 species representing the main phylogenetic lineages, life-histories and ecological traits. The sixfold range of genome size variation was strongly traceable throughout the phylogeny, with a major expansion preceding shark diversification during the late Paleozoic and an ancestral state (6.33 pg) close to the present-day average (6.72 pg). Subsequent deviations from this average occurred at higher rates in squalomorph than in galeomorph sharks and were unconnected to evolutionary changes in the karyotype architecture, which were dominated by descending disploidy events. Genome size was positively correlated with cell and nucleus sizes and negatively with metabolic rate. The metabolic constraints on increasing genome size also manifested at higher phenotypic scales, with large genomes associated with slow lifestyles and purely marine waters. Moreover, large genome sizes were also linked to non-placental reproductive modes, which may entail metabolically less demanding embryological developments. Contrary to ray-finned fishes, large genome size was associated neither with the taxonomic diversity of affected clades nor with low genetic diversity.


Conflict of interest statement

The authors declare no competing interests.

Figures

Figure 1
Figure 1
Genome size diversity in Chondrichthyes. (a) Distribution of available C-value information (haploid DNA content in picograms, pg/n) across the three major chondrichthyan lineages. (b) Distribution of C-values across the shark orders for which genome size data are available (summarized in Table 1). For (a, b) individual jitter points depict average values per species. Boxes marked with different letters (a, b, or c) were significantly different from one another in post hoc pairwise comparisons, after ln-transformation (i.e., p < 0.05). Note the different scale limits for each plot.
Figure 2
Figure 2
Genome size evolution in sharks and outgroups. Species-level phylogeny (‘Maximum Clade Credibility’ or MCC tree hypothesis) depicting ancestral genome size reconstruction under the best-fitting maximum-likelihood ‘Early-Bust’ (EB) model, with details on geological timescale. Tips are colour-coded, as stated in the inset (bottom-left), by the average genome size of each species (represented in the barplot, right). Internal node colours are based on the most likely ancestral genome size estimates inferred by the model (values reported to two decimal places at nodes). Species names at tips are colour-coded according to the taxonomic order to which they belong, following Fig. 1b colour scheme, with outgroup species in black (left inset). The ancestral genome size state for all extant sharks was estimated at 6.33 pg, and for all extant Chondrichthyes at 3.55 pg. Within Selachii, genome size is differently evolving across higher-level taxa: while galeomorph sharks show a general trend in genome size diminution (with the exception of Heterodontiformes and Scyliorhinidae), most squalomorph sharks (especially Squatiniformes and Squaliformes) exhibit steady genome size increases.
Figure 3
Figure 3
Chromosome number evolution in sharks and outgroups. Species-level phylogeny (MCC tree) depicting ancestral haploid chromosome number (n) reconstruction under the best-fitting maximum-likelihood ChromEvol model (“Constant Rate with No Duplication”). Terminal branches are colour-coded, as specified in the inset (left), by the average chromosome count reported for each species (with details on polymorphic states in the pie charts at tips, species from Fig. 2 with unknown karyotype (NA) coloured in grey, and additional species lacking genome size information—four—marked with “*”). Pie charts at nodes represent the probabilities of the most likely chromosome numbers to exist at any internal node inferred across 10,000 simulations (those included in the inset) out of the summed probabilities of any other chromosome number allowed in the model (in white, see Methods). Numbers inside pie charts correspond to the chromosome numbers inferred with the highest probability. Species names at tips are colour-coded after taxonomic order (bottom-left inset). The reconstruction of ancestral chromosome numbers revealed high number estimates for the common ancestor of all extant Chondrichthyes (n = 64) and sharks (n = 57). In Selachii, the oldest evolutionary lineages within both the Galeomorphii (i.e., Heterodontiformes and Orectolobiformes) and Squalomorphii (i.e., Hexanchiformes) clades maintained similar values (n = 53–56) at their root nodes, approximating the ancestral state estimated for all sharks. Throughout the tree, the primary mechanism of chromosome number change identified was descending disploidy (chromosome loss), particularly evident during the diversification of Carcharhiniformes and Squaliformes.
Figure 4
Figure 4
Relationships among karyotype parameters and with genome size in sharks. Species mean values for haploid chromosome number (n) plotted (phylomorphospace) as a function of (a) haploid fundamental number (FN) of chromosome arms; and (b) chromosome composition. Species mean values for ln-transformed genome size plotted (phylomorphospace) as a function of (c) haploid chromosome number (n); (d) haploid fundamental number (FN) of chromosome arms; and (e) chromosome composition. Lines connecting dots indicate phylogenetic relationships. Solid black lines represent PGLS regression lines, while dashed black lines represent non-phylogenetically corrected (OLS) regression lines (see Supplementary Table S5). For (a) dots and internal branches are colour-coded following Fig. 2 ancestral genome size reconstruction, restricted to the taxa for which there is karyotype information. The absence of a colour gradient along n or FN already indicates the lack of association between genome size and any of the two karyotype parameters (as shown in c and d). For (be), dots and branches are colour-coded after taxonomic order (top-right inset).

Similar articles

References

    1. Ferretti F, Worm B, Britten GL, Heithaus MR, Lotze HK. Patterns and ecosystem consequences of shark declines in the ocean. Ecol. Lett. 2010;13:1055–1071. doi: 10.1111/j.1461-0248.2010.01489.x. - DOI - PubMed
    1. Klug S. Monophyly, phylogeny and systematic position of the †Synechodontiformes (Chondrichthyes, Neoselachii) Zool. Scr. 2009;39:37–49. doi: 10.1111/j.1463-6409.2009.00399.x. - DOI
    1. Pollerspöck, J. & Straube, N. Bibliography database of living/fossil sharks, rays and chimaeras (Chondrichthyes: Elasmobranchii, Holocephali)—List of valid extant species; list of described extant species; statistic. Version 08/2023. World Wide Web Electronic Publication. www.shark-references.com (2023).
    1. Pearce J, Fraser MW, Sequeira AMM, Kaur P. State of shark and ray genomics in an era of extinction. Front. Mar. Sci. 2021;8:415–421. doi: 10.3389/fmars.2021.744986. - DOI
    1. Kuraku S. Shark and ray genomics for disentangling their morphological diversity and vertebrate evolution. Dev. Biol. 2021;477:262–272. doi: 10.1016/j.ydbio.2021.06.001. - DOI - PubMed