. 2024 Jun;31(6):939-949.
doi: 10.1038/s41594-024-01261-2. Epub 2024 Apr 17.

Vimentin filaments integrate low-complexity domains in a complex helical structure

Affiliations

Vimentin filaments integrate low-complexity domains in a complex helical structure

Matthias Eibauer et al. Nat Struct Mol Biol. 2024 Jun.

Abstract

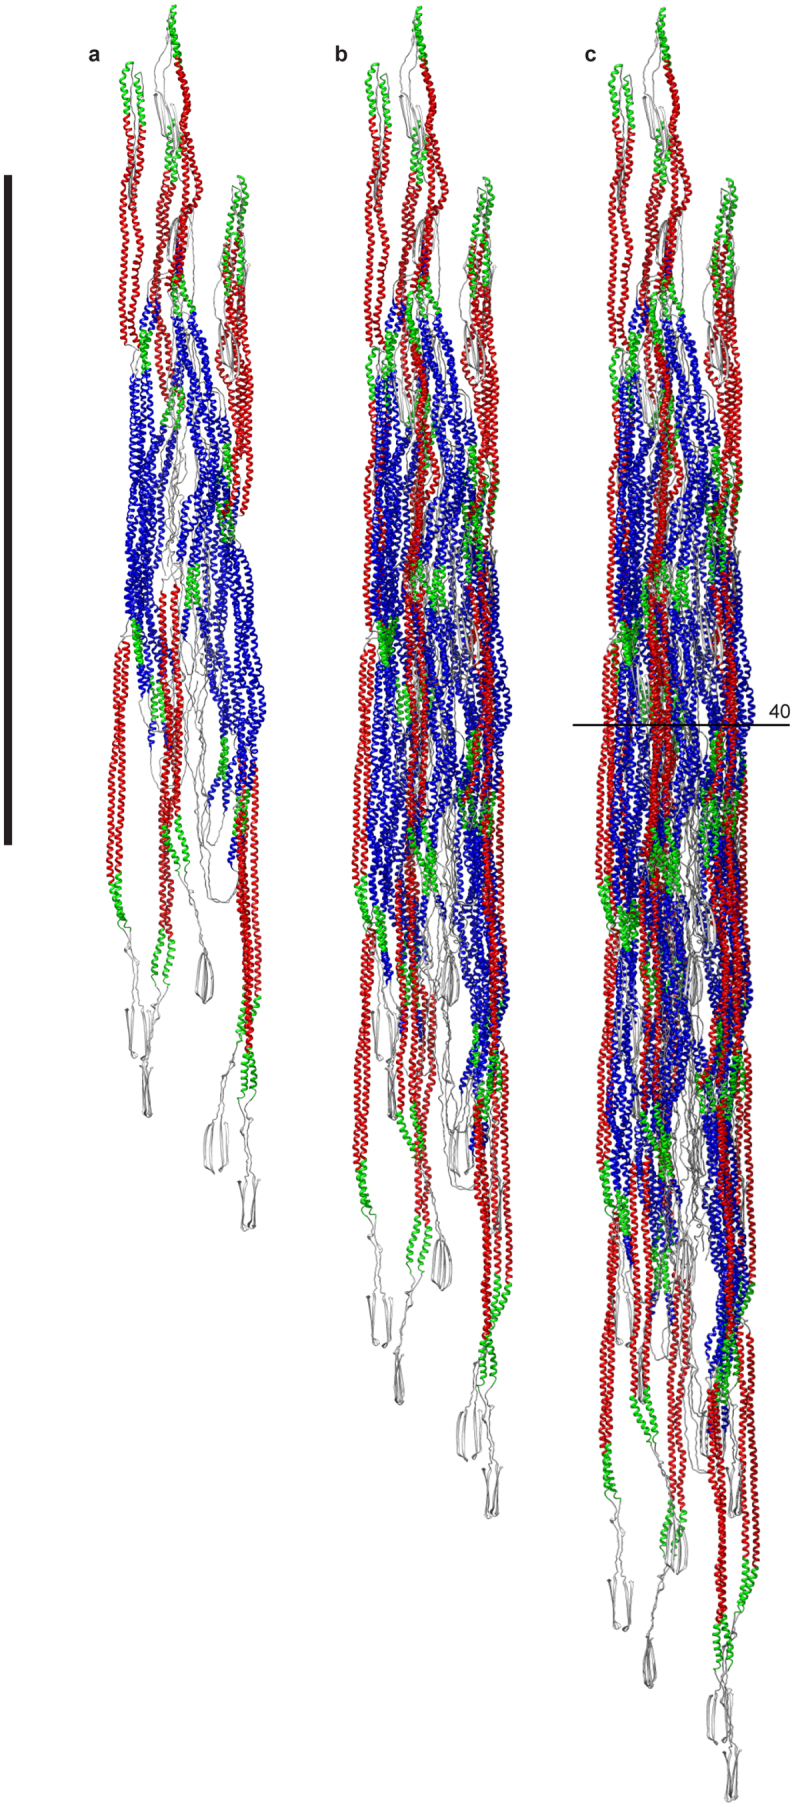
Intermediate filaments (IFs) are integral components of the cytoskeleton. They provide cells with tissue-specific mechanical properties and are involved in numerous cellular processes. Due to their intricate architecture, a 3D structure of IFs has remained elusive. Here we use cryo-focused ion-beam milling, cryo-electron microscopy and tomography to obtain a 3D structure of vimentin IFs (VIFs). VIFs assemble into a modular, intertwined and flexible helical structure of 40 α-helices in cross-section, organized into five protofibrils. Surprisingly, the intrinsically disordered head domains form a fiber in the lumen of VIFs, while the intrinsically disordered tails form lateral connections between the protofibrils. Our findings demonstrate how protein domains of low sequence complexity can complement well-folded protein domains to construct a biopolymer with striking mechanical strength and stretchability.


Conflict of interest statement

The authors declare no competing interests.

Figures

Fig. 1
Fig. 1. VIFs are built from five protofibrils in cells.
a, Slice through a 3D-SIM image (n = 20) of a MEF, fixed and stained with anti-vimentin (green); the nucleus is stained with DAPI (blue). The VIF network extends over the whole cellular volume, with regions of lower and higher network density, and forms a cage around the nucleus. Scale bar, 10 µm. b, Slice (8.84 Å thick) through a tomogram of a cryo-FIB-milled MEF (n = 102), recorded in a region around the nuclear envelope. VIFs, cyan arrowheads; actin filaments, red arrowheads; lamin filaments, yellow arrowheads; microtubule, orange arrowhead; nuclear pore complex, green arrowhead. Scale bar, 100 nm. c, Segmentation (n = 1) of the biopolymers present in b. Scale bar, 100 nm. d, Averaging of 2,371 subtomograms showing that VIFs are assembled from five protofibrils in situ. Scale bar, 5 nm. e, Cross-section of a VIF (n = 150), 8.84 Å thick, extracted from the xy plane of a denoised tomogram, confirming the five-protofibril architecture of VIFs. Scale bar, 5 nm. f, Class averages of VIFs (n = 8) show a helical pattern with a repeat distance of ~180 Å (repeating feature marked with yellow asterisks); one side of the filament boundary appears pronounced in projection (marked with blue arrowheads). Scale bar, 180 Å. g, Combined power spectrum (n = 1) of class averages, as shown in f. The presence of layer lines confirms the helical architecture of VIFs. The first layer line appears at ~1/185 Å and reflects the repeating pattern observed in the class averages. The layer line and peak distribution with a meridional reflection on the fifth layer line at ~1/37 Å is compatible with a helical assembly of five subunits per repeat. The yellow arc in the power spectrum indicates 1/26 Å. h, Gallery of three computationally assembled VIFs (n = 5,205). With this technique, the progression of VIFs can be followed with an improved signal-to-noise ratio over a substantial length. Scale bar, 35 nm.
Fig. 2
Fig. 2. The 3D structure of VIFs.
a, Isosurface rendering of the VIF 3D structure. The protofibrils are shown in different colors. Protofibrils 1, 2 and 5 are labelled. Scale bar, 10 nm. b, Omitting the front protofibril opens the view of the luminal fiber (gray density), which is located in the lumen of the VIFs. c, Cross-section of VIFs displaying all five protofibrils and the luminal fiber. d, Segmentation of the repeating unit of a protofibril. The frontal, straight tetrameric α-helix bundle is shown in red, the lateral, curved tetrameric α-helix bundle in blue, and the contact sites between adjacent protofibrils in magenta. e, The least flexible region of the repeating unit, shown in reddish colors, is the frontal, straight region (left dashed rectangle). A section view through the structure of the repeating unit shows that structural plasticity is increased mostly in the lateral, curved region (right dashed rectangle), shown in bluish colors.
Fig. 3
Fig. 3. Atomic model of VIFs.
a, Complete VIF 3D atomic model docked into the density map (transparent gray). Scale bar, 10 nm. b, The 2A–2B domains (α-helices colored from green (NTE) to red (CTE), and the tail domains (magenta chains) are shown within the density map. Two antiparallel 2A–2B dimers form a straight α-helix bundle, which constitutes about one half of a protofibril. The CTEs of each 2A–2B dimer position the tail domains to form the contact sites between the protofibrils. c, The 1A–1B domains (α-helices colored from blue (NTE) to green (CTE)), and the head domains (blue chains) are shown within the density map. Two antiparallel 1A–1B dimers compose a curved α-helix bundle, which approximately constitutes the second half of a protofibril. In the image, the frontal protofibril is omitted to reveal the inside of the filament. The NTEs of each 1A–1B dimer protrude into the filament lumen, where the head domains aggregate to form the luminal fiber. d, The frontal straight (red transparent density) and lateral curved (blue transparent density) tetrameric regions in the electron density map are formed from an antiparallel 2A–2B tetramer and an antiparallel 1A–1B tetramer, respectively, and the contact sites between the protofibrils are formed by the tail domains (magenta transparent density). e, In VIFs, there are 40 polypeptide chains in cross-section, assembled into five protofibrils. f, The protofibrils interact laterally through the tail domains and centrally through the head domains. The 2A–2B dimers substantially shape the outer surface of VIFs, and the 1A–1B dimers predominantly coat their inner surface.
Fig. 4
Fig. 4. Building blocks of VIFs.
a, Tetramer model. The α-helices shown in red are the 2A–2B dimers, and those in blue are the 1A–1B dimers. Green-colored α-helical segments are highly conserved regions between IFs in the 1A and 2B domains, respectively. b, Protofibril model. Numbers and horizontal lines indicate the number of α-helices in cross-section at the respective positions, and t1, t2 and t3 mark the successive tetramers forming the protofibril. The cross-sections along the protofibril are shown within the dashed rectangles. The polarity of the individual α-helices is annotated with + and – signs. c, In the fully assembled repeating unit of a protofibril, the interlocking regions are formed on both sides of the assembly and are spaced ~21 nm along the protofibrils. d, Extended VIF model constructed from 30 tetramers with a length of ~190 nm.
Fig. 5
Fig. 5. Complete structural picture of the cytoskeleton.
The functions of the cytoskeleton in cells of mesenchymal origin are based on three biopolymers. F-actin and microtubules are built from compact, globular proteins; VIFs are built from elongated, intertwining tetramers. All three filaments are assembled with helical symmetry. However, in VIFs, a significant part of the structure is formed from domains with low sequence complexity, which condense to connections between the protofibrils and form an amyloid-like fiber in the lumen of VIFs. This introduces an additional layer of structural complexity, based on transient molecular interactions. Three protofilaments of the microtubule are shown. Scale bar, 10 nm.
Extended Data Fig. 1
Extended Data Fig. 1. Subtomogram averaging of VIFs.
(a) Slice (xy-plane, 8.84 Å thick) through a tomogram of cryo-FIB milled MEFs (n = 7). The tomogram was reconstructed with WBP and low-pass filtered to 30 Å for visualization. The cyan arrowheads point to VIFs running in the tomographic xy-plane and the green arrowhead marks a nuclear pore complex. Scale bar is 100 nm. (b) The tomographic slice (xz-plane, 8.84 Å thick; n = 7) shows the high contrast and density of the platinum particles at the front edge of the lamella (cyan dashed rectangle), which cause a high density of distorting back-projection rays (red dashed rectangle). These regions in the tomograms were excluded from subsequent data analysis, and only unaffected regions in the tomograms were used for subtomogram averaging of VIFs (yellow dashed rectangle). The yellow arrowhead points to a VIF cross-section in the xz-plane. Cross-sections in this plane are distorted by the missing wedge. Scale bar is 100 nm. (c) Isosurface visualization of the 3D reconstruction of VIF segments (2371 particles extracted from 7 cryo-FIB tomograms), calculated without applying any a priori knowledge of the symmetry of the assembly. The average clearly shows the 5 protofibril architecture of VIFs. (d) Isosurface visualization of the 3D reconstruction of VIF segments using helical symmetry (42 Å helical rise, 72° helical twist). The average resembles the structure which was obtained without applying symmetry. Scale bar 10 nm.
Extended Data Fig. 2
Extended Data Fig. 2. Cross-section averaging of VIFs.
(a) Slice (xy-plane, 8.84 Å thick) through the same tomogram as shown before (Extended Data Fig. 1a), but the tomogram was missing wedge corrected with the IsoNet algorithm (n = 7). The cyan arrowheads point to VIFs running in the tomographic xy-plane and the green arrowhead marks a nuclear pore complex. Scale bar is 100 nm. (b) The tomographic slice (xz-plane, 8.84 Å thick; n = 7) shows the result of the missing wedge correction. As a result, the platinum depositions on the front edge of the lamella (cyan dashed rectangle) appear globular and VIF cross-sections (yellow arrowhead) reveal their pentameric shape. Regions with a high density of distorting back-projection rays (red dashed rectangle) were excluded from subsequent data processing. Only unaffected regions in the tomograms were used for cross-section averaging (yellow dashed rectangle). The lamella has a thickness of ~130 nm. (c) More examples of pentameric cross-sections of VIFs (n = 8) as seen in the IsoNet corrected tomogram. Scale bar 10 nm. (d) VIF cross-section average calculated without any assumptions on the symmetry of the assembly from 444 cross-sections, extracted from the xz-planes of 7 tomograms. The cross-section average clearly confirms the 5 protofibril architecture of VIFs, as seen before with subtomogram averaging. Scale bar 10 nm. (e) For comparison the helical symmetrized subtomogram average was rotated and the protofibrils numbered to match the cross-section average.
Extended Data Fig. 3
Extended Data Fig. 3. Gallery of xy-cross-sections of VIFs.
(a) Slice (xy-plane, 8.84 Å thick) through a tomogram of cryo-FIB milled MEFs. The cyan arrowheads point to cross-sections of VIFs, which are located in the xy-plane of this tomogram (n = 1). The green arrowheads mark the outer and inner nuclear membranes. The slice shown on the left was extracted from the denoised version of the tomogram, the slice on the right from the original WBP tomogram, low-pass filtered to 30 Å. (b) Another example for a tomographic slice (n = 50) containing VIF xy-cross-sections (cyan arrowheads). Left side, denoised tomogram, right side, WBP tomogram, low-pass filtered to 30 Å. Scale bar 100 nm. (c) More examples for pentameric xy-cross-sections of VIFs (n = 150) extracted from the denoised version of the tomogram. Scale bar 10 nm.
Extended Data Fig. 4
Extended Data Fig. 4. Helical parameter determination of VIFs.
(a) Length histogram of the ca-VIFs (n = 5205). (b) Profile plot showing the averaged, background corrected autocorrelation signal of ca-VIFs with a minimal length of 353 nm (n = 389). The mean distance between the red arrowheads is 186.5 Å ± 26.0 Å. (c) These ca-VIFs were combined into one power spectrum. The meridional reflection at 1/42.5 Å (blue arrowhead, 1^) indicates the helical rise of VIFs. Around the distinct layer line at 1/185.6 Å (yellow arrowhead, 3#), the following sequence of layer lines was extracted, indicated by 1#-4# in the inset: 1/207.4 Å, 1/195.9 Å, 1/185.6 Å, 1/176.3 Å. The yellow arc indicates 1/16 Å. (d) The meridional reflection at 1/42.5 Å (blue arrowhead, 1^) was identified by cross-correlation of the layer lines with a zero order Bessel function within a search interval between 1/30 Å and 1/69 Å. In the proximity of the meridional reflection the following sequence of layer lines was extracted, indicated by 1^-4^ in the plot: 1/42.5 Å, 1/40.1 Å, 1/37.9 Å, 1/36.3 Å. (e) The optimal number of asymmetric units per helical pitch that relates both sequences of layer lines was determined. (f) Magnified cutout image of the meridional layer line (blue arrowhead, 1^) from the power spectrum shown in (c). In (g) the same magnified cutout image of the layer line is shown, but with an additional contrast enhancement. Source data
Extended Data Fig. 5
Extended Data Fig. 5. Comparison between the wildtype VIF and VIF-ΔT structures.
(a) Isosurface rendering of the VIF structure. The contact sites between the protofibrils are circled by yellow dashed ovals. Scale bar is 10 nm. (b) Identical structure as shown in (a), but rotated -36° around the helical axis (c) Identical view as shown in (b), but the VIF structure was low-pass filtered to 14 Å. (d) Isosurface rendering of the VIF-ΔT structure, which is displayed with identical view and low-pass filter settings as the VIF structure depicted in (c). Both structures (VIF and VIF-ΔT) are similar to a great extent, and both structures contain a luminal fiber of similar volume. However, their striking difference, as indicated by the yellow dashed ovals in (c) and (d), is that the VIF-ΔT structure is clearly lacking the contact sites between the adjacent protofibrils.
Extended Data Fig. 6
Extended Data Fig. 6. Alphafold prediction of the vimentin full-length dimer.
The atomic model shown on the left is the ranked-0 alphafold prediction result of the vimentin full-length dimer. The residues are colored according to the pLDDT confidence score of the alphafold prediction. Based on this model we define the vimentin protein domains as follows: head, residues 1-85, colored blue; 1 A-1B, residues 86-253, colored from blueNTE to greenCTE; linker L12, residues 254-264, colored green; 2A-2B, residues 265-411, colored from greenNTE to redCTE; tail, residues 412-466, colored magenta. Based on this definition the full-length dimer model was dissected into dimeric models of the vimentin protein domains (shown in the figure to the right of the dashed line; labelled with head domains, 1A-1B dimer, L12 domains, 2A-2B dimer, and tail domains). These models constituted the initial folds for the subsequent building of the VIF atomic model. Scale bar 10 nm.
Extended Data Fig. 7
Extended Data Fig. 7. VIF 3D atomic model zoomed on protofibril.
The complete VIF 3D atomic model was simplified to one repeating unit of a protofibril. The front view of this reduced model is displayed on the left, the view from the luminal face on the right, and the scale bar is 5 nm. The α-helical 2A-2B domains are colored from greenNTE to redCTE, and the α-helical 1A-1B domains are colored from blueNTE to greenCTE. The tail domains are colored magenta, the head domains blue, and the linker L12 domains green. The main constituents of the repeating unit of a protofibril are 2 antiparallel 2A-2B dimers (red labels) and 2 antiparallel 1A-1B dimers (blue labels). Along a protofibril, each of the 2A-2B dimers are connected by the L12 linker domains with one of the previous and one of the subsequent 1A-1B dimers. The CTEs of each 2A-2B dimer position the tail domains to form the lateral contact sites between the protofibrils, and the NTEs of each 1A-1B dimer position the head domains to form the luminal fiber.
Extended Data Fig. 8
Extended Data Fig. 8. Outer and inner surface of VIFs.
(a) The frontal straight (red transparent density) and lateral curved (blue transparent density) tetrameric regions in the electron density map are formed from 2 antiparallel 2A-2B dimers (red helices) and 2 antiparallel 1A-1B dimers (blue helices), respectively, and the contact sites between the protofibrils (magenta transparent densities) are formed by the tail domains (magenta chains). (b) The horizontal line in (a) indicates the position of the respective octameric cross-section (shown within the dashed rectangle). (c) The outer surface of VIFs is mainly coated with the 2A-2B dimers and the inner surface with the 1A-1B dimers. The tail domains form the contact sites between the protofibrils. The head domains (grey chains) emanate into the lumen of VIFs and form the luminal fiber (grey density).
Extended Data Fig. 9
Extended Data Fig. 9. Construction of a protofibril.
Numbers and horizontal lines indicate the number of α-helices in cross-section at the respective positions. Cross-sections are shown within dashed rectangles. The polarity of the individual α-helices is annotated with + and - signs. Starting from a first tetramer t1 (shown on the left), a second tetramer t2 attaches with its 1A-1B section (blue helices) laterally to one of the flanking 2A-2B dimers (red helices) of t1. This creates an intermediate assembly (t1 and t2) with 6 chains in cross-section. Subsequently, a third tetramer t3 binds to either side of this assembly. This creates a minimal length (~110 nm) protofibril (t1, t2 and t3) with its basic repeating unit (8 chains in cross-section) fully assembled in its center. Therefore, the full assembly of a protofibril with 8 polypeptide chains in cross-section requires the sequential interaction of at least 3 tetramers. The model shown on the right is derived from the protofibril model by removing the central tetramer t2. This model shows that the central 2A-2B region is formed from 2 antiparallel 2A-2B dimers, which are provided from the 2 neighboring tetramers.
Extended Data Fig. 10
Extended Data Fig. 10. VIF models with increasing numbers of tetramers.
(a) VIF model constructed from 5 tetramers. Scale bar is 50 nm. (b) VIF model constructed from 10 tetramers. (c) VIF model constructed from 15 tetramers. In-situ VIFs assembled from at least 15 tetramers exhibit 40 polypeptide chains in cross-section through their central regions.

Similar articles

Cited by

References

    1. Steinert PM, Steven AC, Roop DR. The molecular biology of intermediate filaments. Cell. 1985;42:411–420. doi: 10.1016/0092-8674(85)90098-4. - DOI - PubMed
    1. Szeverenyi I, et al. The human intermediate filament database: comprehensive information on a gene family involved in many human diseases. Hum. Mutat. 2008;29:351–360. doi: 10.1002/humu.20652. - DOI - PubMed
    1. Turgay Y, et al. The molecular architecture of lamins in somatic cells. Nature. 2017;543:261–264. doi: 10.1038/nature21382. - DOI - PMC - PubMed
    1. Weber MS, et al. Structural heterogeneity of cellular K5/K14 filaments as revealed by cryo-electron microscopy. eLife. 2021;10:e70307. doi: 10.7554/eLife.70307. - DOI - PMC - PubMed
    1. Khalil M, et al. Neurofilaments as biomarkers in neurological disorders. Nat. Rev. Neurol. 2018;14:577–589. doi: 10.1038/s41582-018-0058-z. - DOI - PubMed