. 2024 Apr 17;7(1):468.
doi: 10.1038/s42003-024-06069-w.

Genetic barriers more than environmental associations explain Serratia marcescens population structure

Affiliations

Genetic barriers more than environmental associations explain Serratia marcescens population structure

Lodovico Sterzi et al. Commun Biol. .

Abstract

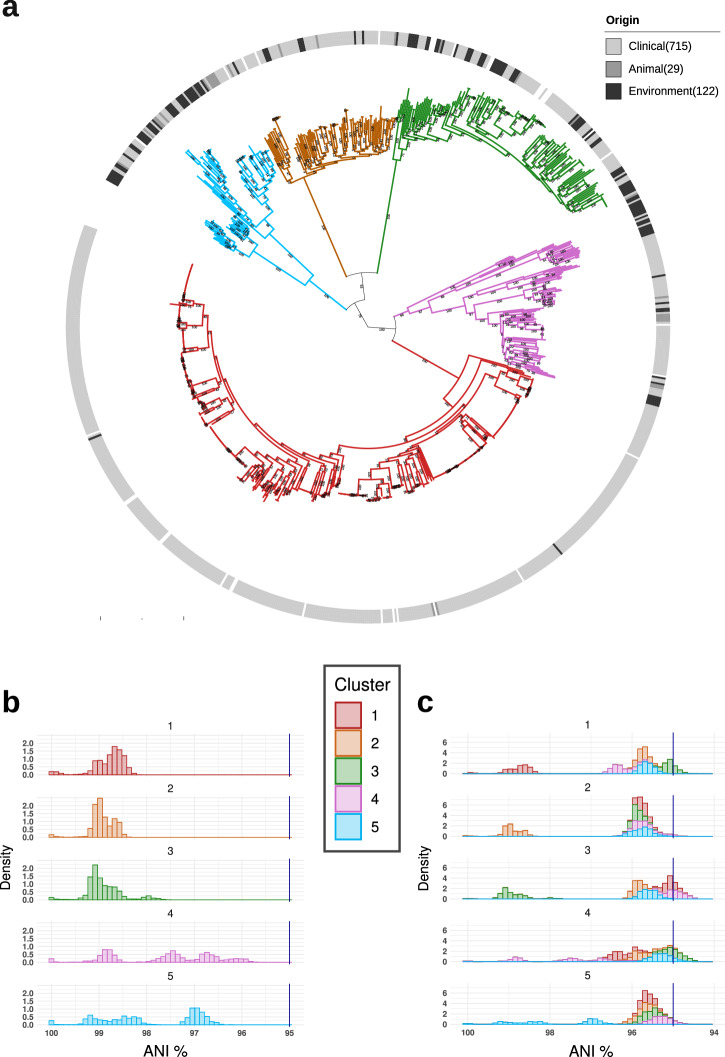
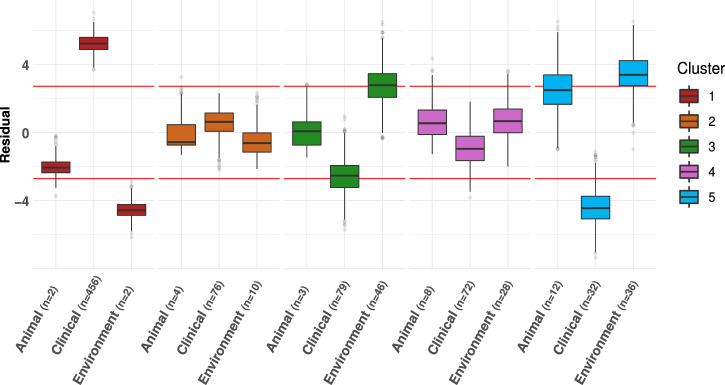
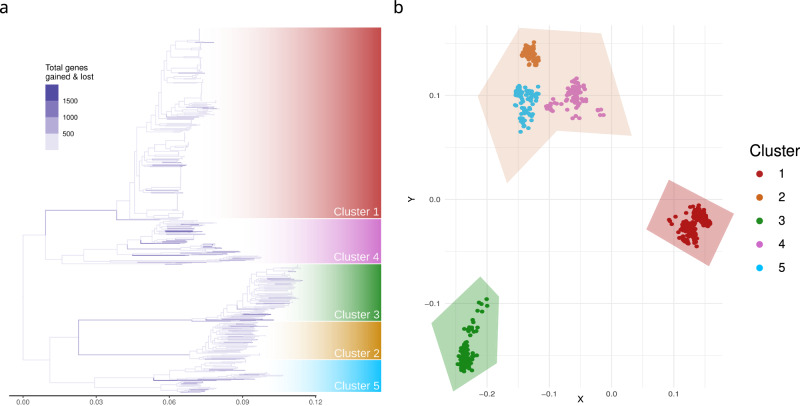
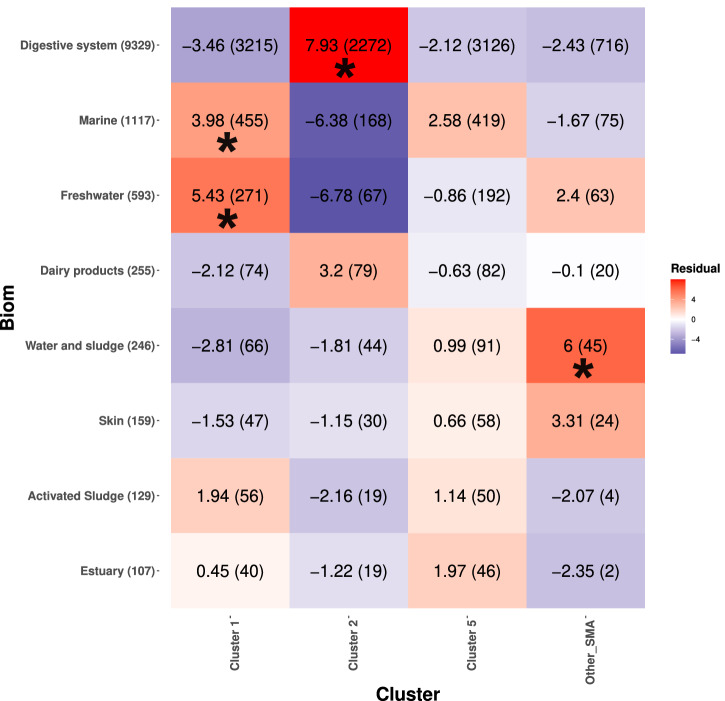
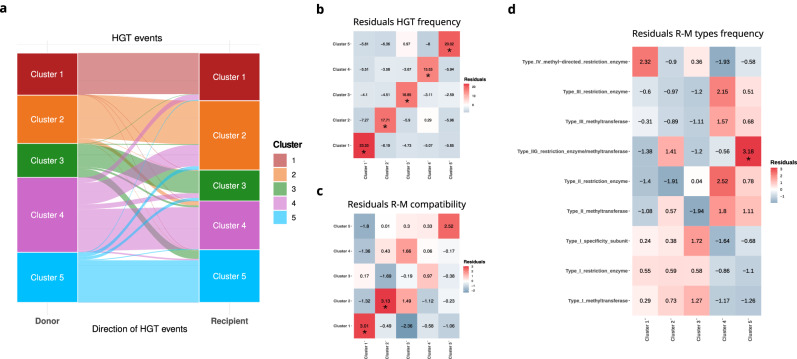
Bacterial species often comprise well-separated lineages, likely emerged and maintained by genetic isolation and/or ecological divergence. How these two evolutionary actors interact in the shaping of bacterial population structure is currently not fully understood. In this study, we investigate the genetic and ecological drivers underlying the evolution of Serratia marcescens, an opportunistic pathogen with high genomic flexibility and able to colonise diverse environments. Comparative genomic analyses reveal a population structure composed of five deeply-demarcated genetic clusters with open pan-genome but limited inter-cluster gene flow, partially explained by Restriction-Modification (R-M) systems incompatibility. Furthermore, a large-scale research on hundred-thousands metagenomic datasets reveals only a partial habitat separation of the clusters. Globally, two clusters only show a separate gene composition coherent with ecological adaptations. These results suggest that genetic isolation has preceded ecological adaptations in the shaping of the species diversity, an evolutionary scenario coherent with the Evolutionary Extended Synthesis.


Conflict of interest statement

The authors declare no competing interests.

Figures

Fig. 1
Fig. 1. The population structure of Serratia marcescens.
a SNP-based Maximum Likelihood (ML) phylogenetic tree of the 902 Serratia marcescens strains of the Global genomic dataset. The tree branches’ colours indicate the five clusters coherently and independently determined applying K-means clustering on patristic distances, coreSNP distances and Mash distances. The circle around the tree indicates the strain isolation source (blank if not traceable from the metadata). Bootstrap values are shown on the tree nodes. b Distribution of Average Nucleotide Identity (ANI) between S. marcescens strains within each cluster. The dark blue vertical lines indicate the species identity threshold (95% ANI). c Distribution of Average Nucleotide Identity (ANI) within and between clusters. The dark blue vertical lines indicate the species identity threshold (95% ANI).
Fig. 2
Fig. 2. Association between phylogenetic cluster and isolation source.
Association of S. marcescens clusters with animal, clinical or environmental isolation sources. To avoid potential biases due to sampling proximity, χ2 test was repeated 1000 times on geographically-balanced subsets. The box plot illustrates the distribution of the Pearson residuals for each cluster- isolation source combination, and the red horizontal lines demarcate the thresholds for statistical significance of the residual (see “Methods” section): Cluster 1 is associated with clinical samples (>95% of subsets are significant). Cluster 3 is enriched in environmental isolation sources (52% of subsets), and Cluster 5 is enriched in both environmental (76% of subsets) and animal (42% of subsets). The number of strains in each cluster for each isolation source (n) is displayed on the x-axis of the boxplots.
Fig. 3
Fig. 3. Analysis of the Serratia marcescens gene repertoire.
a Phylogenetic tree with branches coloured according to the number of gene gains and losses inferred by Panstripe. b Principal Coordinate Analysis (PCoA) of S. marcescens strains based on gene presence absence. Each dot corresponds to a S. marcescens strain coloured on the basis of its cluster. The shaded regions represent the three clusters identified by the K-means unsupervised algorithm.
Fig. 4
Fig. 4. Inference of S. marcescens clusters in metagenomic samples.
Cluster-specific core genes with high rates of specificity and sensibility (see “Methods” section) were searched on metagenomic samples of the MGnify database to identify phylogenetic clusters of S. marcescens in a broad set of biomes. A metagenomic assembly was considered positive to a Cluster if >10% of cluster-specific core genes were found within it. When a metagenomic assembly resulted positive to core S. marcescens genes, but not to genes associated to Cluster 1, Cluster 2 or Cluster 5, the assembly was defined as Other SMA. The heatmap shows the residuals of the χ2 test used to investigate whether S. marcescens clusters are associated to samples from specific biomes. Statistically significant associations are marked with asterisks (‘∗’, p value < 0.05). Here, only biomes with more than 100 positive samples are shown, see Fig. S11 for all biomes.
Fig. 5
Fig. 5. Gene flow and Restriction-Modification (R-M) systems compatibility.
a Stacked bar charts showing the percentage of genes with Horizontal Gene Transfer (HGT) events inferred for each cluster from 1062 core genes. Intra indicates genes with HGT events which happened within strains of the same cluster. Donor indicates genes with HGT events departing from the cluster to other clusters. Recipient indicates genes with HGT events departing from other clusters. b Heatmap showing the χ2 residuals of S. marcescens clusters pairs on the basis of the total number of HGT events inferred between them. Statistically significant associations are marked with an asterisk (*). c Heatmap showing the χ2 residuals of S. marcescens clusters pairs on the basis of R-M systems compatibility. Statistically significant associations are marked with an asterisk (*). d Heatmap showing the χ2 residuals of R-M system type distribution in the S. marcescens. Statistically significant associations are marked with an asterisk (*).

Similar articles

Cited by

  • Cultivation and sequencing-free protocol for Serratia marcescens detection and typing.
    Alvaro A, Piazza A, Papaleo S, Perini M, Pasala AR, Panelli S, Nardi T, Nodari R, Sterzi L, Pagani C, Merla C, Castelli D, Olivieri E, Bracco S, Ferrando ML, Saluzzo F, Rimoldi SG, Corbella M, Cavallero A, Prati P, Farina C, Cirillo DM, Zuccotti G, Comandatore F. Alvaro A, et al. iScience. 2024 Mar 1;27(4):109402. doi: 10.1016/j.isci.2024.109402. eCollection 2024 Apr 19. iScience. 2024. PMID: 38510115 Free PMC article.

References

    1. Fraser C, Alm EJ, Polz MF, Spratt BG, Hanage WP. The bacterial species challenge: making sense of genetic and ecological diversity. Science. 2009;323:741–746. doi: 10.1126/science.1159388. - DOI - PubMed
    1. Achtman M, Wagner M. Microbial diversity and the genetic nature of microbial species. Nat. Rev. Microbiol. 2008;6:431–440. doi: 10.1038/nrmicro1872. - DOI - PubMed
    1. Gevers D, et al. Re-evaluating prokaryotic species. Nat. Rev. Microbiol. 2005;3:733–739. doi: 10.1038/nrmicro1236. - DOI - PubMed
    1. Cohan FM. Bacterial species and speciation. Syst. Biol. 2001;50:513–524. doi: 10.1080/10635150118398. - DOI - PubMed
    1. Polz MF, Alm EJ, Hanage WP. Horizontal gene transfer and the evolution of bacterial and archaeal population structure. Trends Genet. 2013;29:170–175. doi: 10.1016/j.tig.2012.12.006. - DOI - PMC - PubMed

Publication types