. 2024 Jun;21(6):575-588.
doi: 10.1038/s41423-024-01157-7. Epub 2024 Apr 17.

Neuropilin-1high monocytes protect against neonatal inflammation

Affiliations

Neuropilin-1high monocytes protect against neonatal inflammation

Xiaoqing Zheng et al. Cell Mol Immunol. 2024 Jun.

Abstract

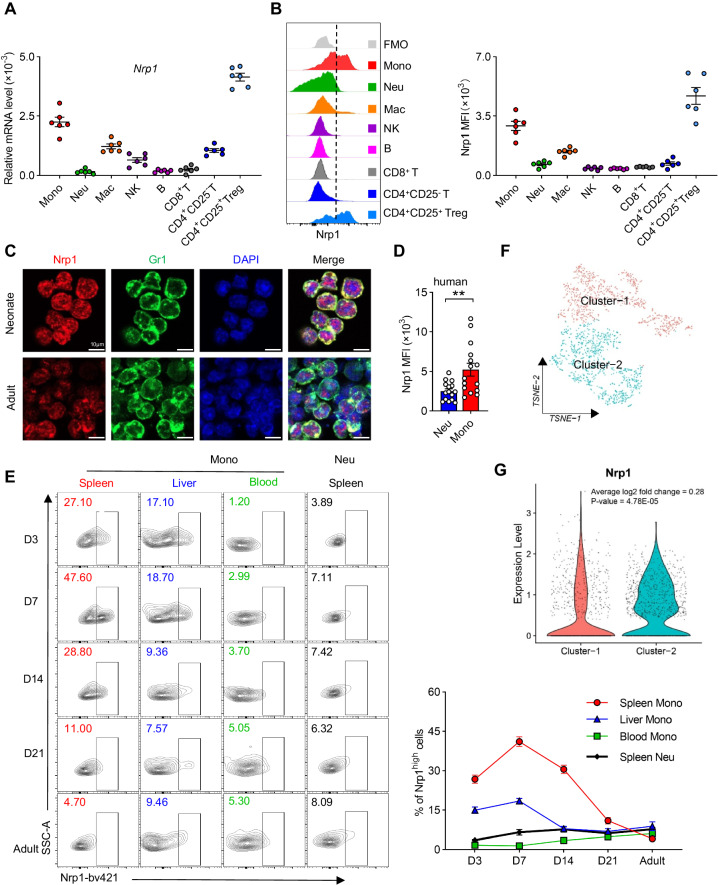
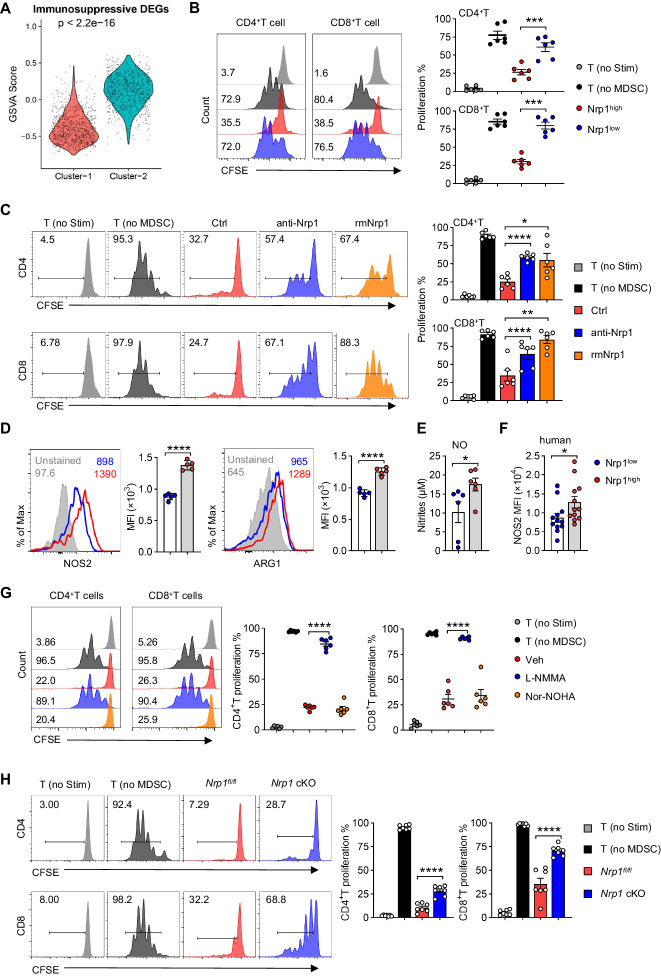
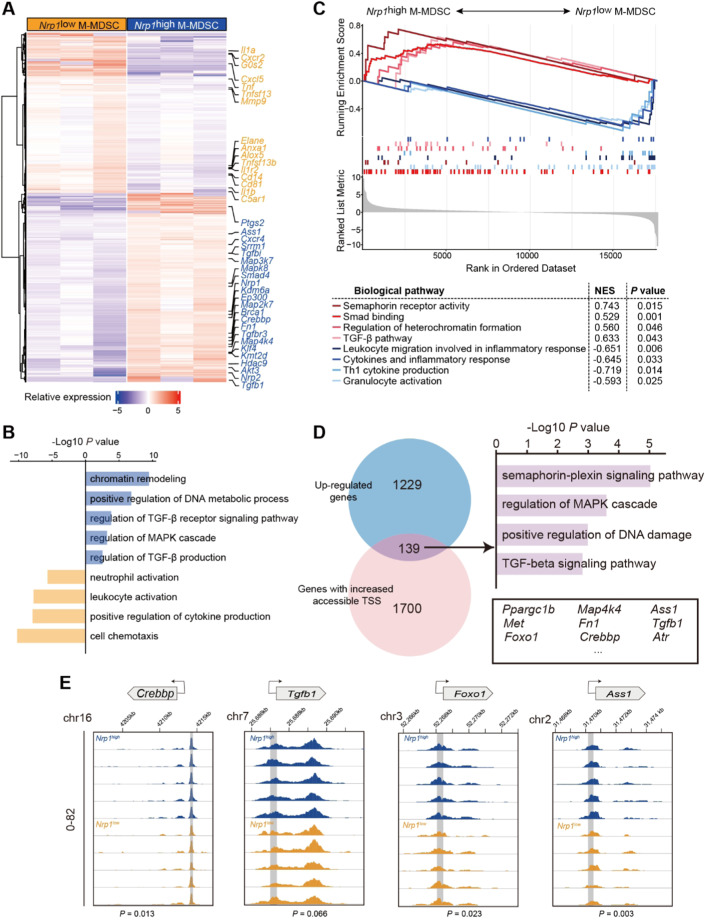
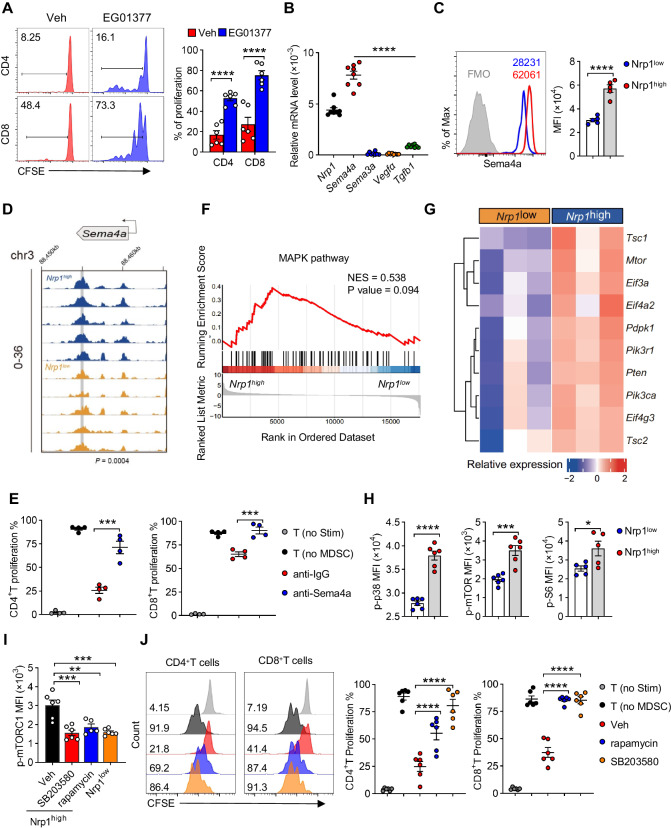
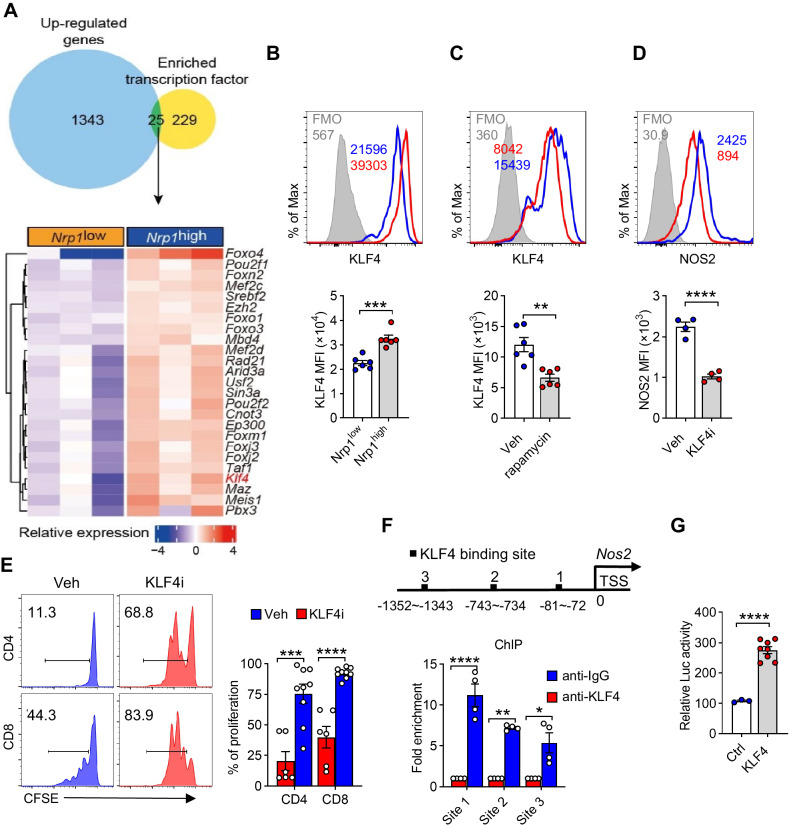
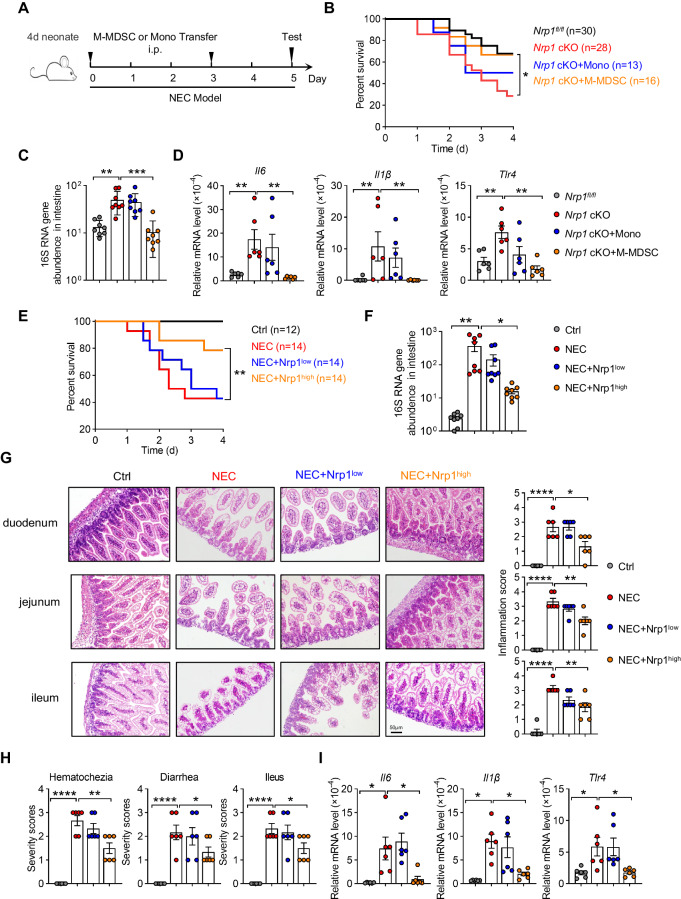
Neonates are susceptible to inflammatory disorders such as necrotizing enterocolitis (NEC) due to their immature immune system. The timely appearance of regulatory immune cells in early life contributes to the control of inflammation in neonates, yet the underlying mechanisms of which remain poorly understood. In this study, we identified a subset of neonatal monocytes characterized by high levels of neuropilin-1 (Nrp1), termed Nrp1high monocytes. Compared with their Nrp1low counterparts, Nrp1high monocytes displayed potent immunosuppressive activity. Nrp1 deficiency in myeloid cells aggravated the severity of NEC, whereas adoptive transfer of Nrp1high monocytes led to remission of NEC. Mechanistic studies showed that Nrp1, by binding to its ligand Sema4a, induced intracellular p38-MAPK/mTOR signaling and activated the transcription factor KLF4. KLF4 transactivated Nos2 and enhanced the production of nitric oxide (NO), a key mediator of immunosuppression in monocytes. These findings reveal an important immunosuppressive axis in neonatal monocytes and provide a potential therapeutic strategy for treating inflammatory disorders in neonates.

Keywords: Infant immunity; Inflammation; Monocytes; Neuropilin-1.


Conflict of interest statement

The authors declare no competing interests. J.Z. is an editorial board member of Cellular & Molecular Immunology, but she has not been involved in the peer review or the decision-making of the article.

Figures

Fig. 1
Fig. 1. Identification of Nrp1high monocytes in neonates.
A Nrp1 expression was determined by qRT‒PCR. Mono, monocytes; Neu, neutrophils; Mac, macrophages; NK, natural killer cells. (n = 6). B Flow cytometric analyses of Nrp1 expression in immune cells in the spleens of neonatal mice. (n = 6). C Immunofluorescence staining of Nrp1 in splenic monocytes from neonatal and adult mice. Representative images are shown. Red, Nrp1; green, Gr1; blue, DAPI; scale bar, 10 μm. (n = 3). D Nrp1 expression in monocytes and neutrophils from the peripheral blood of healthy newborns was analyzed by flow cytometry. Monocytes were gated on the CD11b+CD14+HLA-DR-/loCD15- population. Neutrophils were gated on the CD11b+CD14-HLA-DR-/loCD15+ population. (n = 15). E Nrp1 expression on monocytes from tissues/blood of mice of different ages. Splenic neutrophils were used as controls, and both representative flow cytometry (left) and statistical data (right) are shown. (n = 5). F The distribution of two subtypes of splenic monocytes as shown by the t-distributed stochastic neighbor embedding (t-SNE) plot. G Violin plot showing the expression level of Nrp1 in the two splenic monocyte subtypes. All the data are from 2 to 3 independent experiments in all the graphical panels; the data are shown as the mean ± SEM. An unpaired t test was used. **, P < 0.01. MFI, mean fluorescence intensity
Fig. 2
Fig. 2. Nrp1high monocytes display strong immunosuppressive effects.
A. Enrichment scores of immunosuppressive DEGs according to scRNA-seq data determined by gene set variation analysis (GSVA) between the two splenic monocyte subsets from neonatal mice. Statistical significance was evaluated using the Wilcoxon rank-sum test. B Suppressive activity of splenic Nrp1low monocytes and Nrp1high monocytes from neonatal mice at a ratio of 1:16 (monocytes/CD3+T cells). Effectors were CD4+ T cells or CD8+ T cells stimulated with CD3/CD28 antibodies. No stimulated T cells (no Stim) or stimulated T cells without monocytes (no MDSCs) were used as controls. T-cell proliferation was evaluated using CFSE staining. Representative flow cytometry analysis (left) and statistical analysis of the proliferation rates of CD4+T cells and CD8+T cells (right) are shown. (n = 6). C Suppression of CD3/CD28-stimulated T cells by splenic Nrp1high monocytes from neonatal mice at a ratio of 1:8 (Nrp1high monocytes /CD3+T cells) in the presence of anti-Nrp1 or rmNrp1. No stimulated T cells (no Stim) or stimulated T cells without monocytes (no MDSCs) were used as controls. T-cell proliferation was evaluated using CFSE staining. (n = 6). D The levels of NOS2 or ARG1 protein in splenic Nrp1high monocytes and Nrp1low monocytes from neonatal mice were determined via flow cytometry. (n = 5). E Amounts of NO measured by ELISA in cell lysates of splenic Nrp1high monocytes and Nrp1low monocytes from neonatal mice. (n = 6). F The MFI of NOS2 protein in Nrp1high monocytes and Nrp1low monocytes from peripheral blood of human healthy newborns was analyzed via flow cytometry (n = 12). G Suppression of CD3/CD28-stimulated T cells by splenic Nrp1high monocytes from neonatal mice (Nrp1high monocytes/CD3+T at a ratio of 1:8) in the presence of NOS2 (L-NMMA) or arginase I (nor-NOHA) inhibitors. No stimulated T cells (no Stim) or stimulated T cells without monocytes (no MDSCs) were used as controls. T-cell proliferation was evaluated using CFSE staining (n = 6). H Immunosuppressive activity of splenic monocytes from neonatal Nrp1fl/fl or Nrp1 cKO mice at a ratio of 1:8 (monocytes/CD3+T cells). Effectors were CD4+ T cells or CD8+ T cells stimulated with CD3/CD28 antibodies. No stimulated T cells (no Stim) or stimulated T cells without monocytes (no MDSCs) were used as controls. T-cell proliferation was evaluated using CFSE staining (n = 7). All the data are from 3 independent experiments in all the graphical panels; the data are shown as the mean ± SEM. An unpaired t test was used. *P < 0.05; **P < 0.01; ***P < 0.001; ****P < 0.0001
Fig. 3
Fig. 3. Transcriptional and chromatin accessibility profiling of Nrp1high monocytes.
A Heatmap comparing differentially expressed genes (DEGs) between splenic Nrp1low and Nrp1high monocytes from neonatal mice. B Bar plots showing pathways enriched in DEGs between splenic Nrp1high monocytes and Nrp1low monocytes from neonatal mice. C GSEA comparing significantly upregulated pathways in splenic Nrp1high monocytes compared to those in Nrp1low monocytes. D Left: Venn diagrams summarizing 139 upregulated genes with more accessible transcription start sites (TSSs) in splenic Nrp1high monocytes. Right: Bar plots showing the enrichment pathways of 139 genes. Selected genes are labeled. E Integrative Genomics Viewers (IGVs) of Crebbp, Tgfb1, Foxo1 and Ass1 ATAC-seq signals in splenic Nrp1high monocytes compared to those in Nrp1low monocytes. Loci encompassing the TSS with increased chromatin accessibility in splenic Nrp1high monocytes are outlined in gray. Bulk RNA-seq: n = 3; ATAC-seq: n = 5
Fig. 4
Fig. 4. Ligation of Nrp1-Sema4a induces p38-MAPK/mTORC1 signaling in monocytes.
A Suppression of CD3/CD28-stimulated T cells by splenic Nrp1high monocytes from neonatal mice at a ratio of 1:8 (Nrp1highmonocytes /CD3+T cells) in the presence of an inhibitor of Nrp1 (EG01377). Effectors were CD4+ T cells or CD8+ T cells stimulated with CD3/CD28 antibodies. T-cell proliferation was evaluated using CFSE staining (n = 6). B mRNA expression levels of Nrp1, Sema4a, Sema3a, Vegfα and Tgfb1 in neonatal splenic monocytes (n = 8). C Levels of the Sema4a protein in splenic Nrp1high monocytes and Nrp1low monocytes from neonatal mice were determined via flow cytometry (n = 5). D IGV plot of Sema4a ATAC-seq signals in splenic Nrp1high monocytes compared to those in Nrp1low monocytes. Loci encompassing the TSS with increased chromatin accessibility in Nrp1high monocytes are outlined in gray. E Suppression of CD3/CD28-stimulated T cells by splenic Nrp1high monocytes from neonatal mice at a ratio of 1:8 (Nrp1high monocytes/CD3+T cells) in the presence of anti-IgG or anti-Sema4a. No stimulated T cells (no Stim) or stimulated T cells without monocytes (no MDSCs) were used as controls. T-cell proliferation was evaluated using CFSE staining. (n = 4). F GSEA plot of the MAPK pathway enriched in splenic Nrp1high monocytes from neonatal mice. G Heatmap of genes encoding components of the mTORC1 signaling pathway in splenic Nrp1high monocytes and Nrp1low monocytes from neonatal mice. H Intracellular phosphorylated p38 (Thr180/Tyr182), phosphorylated mTORC1 (Ser2448) and phosphorylated S6 (Ser235/236) levels were measured via flow cytometry in splenic Nrp1high monocytes and Nrp1low monocytes from neonatal mice. (n = 5–6). I Intracellular levels of phosphorylated mTORC1 (Ser2448) in splenic Nrp1high monocytes or Nrp1low monocytes from neonatal mice measured by flow cytometry in the presence of an inhibitor of p38 (SB203580) or mTOR (rapamycin). (n = 5–6). J Suppression of CD3/CD28-stimulated T cells by splenic Nrp1high monocytes from neonatal mice at a ratio of 1:8 (Nrp1high monocytes/CD3+T) in the presence of an inhibitor of mTOR (rapamycin) or p38 (SB203580). No stimulated T cells (no Stim) or stimulated T cells without monocytes (no MDSCs) were used as controls. T-cell proliferation was evaluated using CFSE staining (n = 6). All the data are from 3 independent experiments in all graphical panels; the data are shown as the mean ± SEM. An unpaired t test was used. *P < 0.05; **P < 0.01; ***P < 0.001; ****P < 0.0001
Fig. 5
Fig. 5. The KLF4-NOS2 axis contributes to the immunosuppressive function of Nrp1high monocytes.
A Top: Venn diagrams summarizing 25 upregulated transcription factors with RcisTarget predicting transcription factor-binding sites (TFBSs) overrepresented on the upregulated gene list. Bottom: Heatmap comparing 25 TFs between splenic Nrp1high monocytes and Nrp1low monocytes from neonatal mice. B Levels of KLF4 protein in splenic Nrp1high monocytes and Nrp1low monocytes from neonatal mice were determined by flow cytometry (n = 6). C Levels of KLF4 protein in splenic Nrp1high monocytes from neonatal mice treated with an inhibitor of mTOR (rapamycin) were determined by flow cytometry (n = 6). D Levels of NOS2 protein in splenic Nrp1high monocytes from neonatal mice treated with an inhibitor of KLF4 (kenpaullone) were determined by flow cytometry (n = 4). E Suppression of CD3/CD28-stimulated T cells by splenic Nrp1high monocytes from neonatal mice at a ratio of 1:8 (Nrp1high monocytes /CD3+T cells) in the presence of an inhibitor of KLF4 (kenpaullone). T-cell proliferation was evaluated by CFSE staining (n = 6 for Veh and n = 9 for KLF4i). F Top: Three potential KLF4-binding sites in the Nos2 promoter region. Bottom: ChIP assays were performed on splenic monocytes from neonatal mice using anti-KLF4 or anti-IgG antibodies, and the presence of the Nos2 promoter harboring potential KLF4-binding sites was measured by qRT‒PCR (n = 4). G 293 T cells were cotransfected with the Nos2 reporter and a plasmid expressing KLF4 or empty vector, and luciferase activity was measured 48 h posttransfection (n = 3 for ctrl and n = 8 for KLF4). All the data are from 2 to 3 independent experiments in all the graphical panels; the data are shown as the mean ± SEM. An unpaired t test was used. *P < 0.05; **P < 0.01; ***P < 0.001; ****P < 0.0001
Fig. 6
Fig. 6. The presence of Nrp1 in monocytes plays a protective role in neonatal inflammation.
AD NEC was induced in 4-day-old mice. Approximately 5 × 105 neonatal splenic M-MDSCs or adult splenic monocytes were intraperitoneally administered to NEC mice at Days 0 and 3. A Experimental design. B Survival of mice after NEC. C Bacterial load in the small intestine after NEC induction (n = 8). D Intestinal tissue from NEC mice or controls was collected at the experimental endpoint or at the time of death, and gene expression was measured by qRT‒PCR (n = 6). E–I NEC was induced in 4-day-old mice. Approximately 5 × 105 splenic Nrp1high monocytes or Nrp1low monocytes from neonatal mice were intraperitoneally administered to NEC mice at Days 0 and 3. E Survival of mice after NEC. F Bacterial load in the small intestine after NEC induction (n = 8). G Representative H&E staining of mouse intestines after NEC induction. Inflammation scores were calculated based on the severity of NEC (n = 6). H Clinical scoring of NEC parameters (0–3 scale; see the “Materials and methods” section). (n = 6). I Intestinal tissues from NEC mice or controls were collected at the experimental endpoint or at the time of death, after which gene expression was measured by qRT‒PCR (n = 6). All the data are from 3 to 4 independent experiments in all graphical panels; the data are shown as the mean ± SEM. An unpaired t test was used. *P < 0.05; **P < 0.01; ***P < 0.001; ****P < 0.0001

Similar articles

Cited by

References

    1. Vatanen T, Kostic AD, d'Hennezel E, Siljander H, Franzosa EA, Yassour M, et al. Variation in microbiome LPS immunogenicity contributes to autoimmunity in humans. Cell. 2016;165:1551. doi: 10.1016/j.cell.2016.05.056. - DOI - PubMed
    1. Arrieta MC, Stiemsma LT, Dimitriu PA, Thorson L, Russell S, Yurist-Doutsch S, et al. Early infancy microbial and metabolic alterations affect risk of childhood asthma. Sci Transl Med. 2015;7:307ra152. doi: 10.1126/scitranslmed.aab2271. - DOI - PubMed
    1. Laforest-Lapointe I, Arrieta MC. Patterns of early-life gut microbial colonization during human immune development: an ecological perspective. Front Immunol. 2017;8:788. doi: 10.3389/fimmu.2017.00788. - DOI - PMC - PubMed
    1. Al Nabhani Z, Dulauroy S, Marques R, Cousu C, Al Bounny S, Déjardin F, et al. A weaning reaction to microbiota is required for resistance to immunopathologies in the adult. Immunity. 2019;50:1276–88.e1275. doi: 10.1016/j.immuni.2019.02.014. - DOI - PubMed
    1. Constantinides MG, Link VM, Tamoutounour S, Wong AC, Perez-Chaparro PJ, Han SJ, et al. MAIT cells are imprinted by the microbiota in early life and promote tissue repair. Science. 2019;366:eaax6624. doi: 10.1126/science.aax6624. - DOI - PMC - PubMed

MeSH terms