. 2024 Apr 17;14(1):8911.
doi: 10.1038/s41598-024-59656-6.

Single-cell transcriptome analysis profiling lymphatic invasion-related TME in colorectal cancer

Affiliations

Single-cell transcriptome analysis profiling lymphatic invasion-related TME in colorectal cancer

Liping Wang et al. Sci Rep. .

Abstract

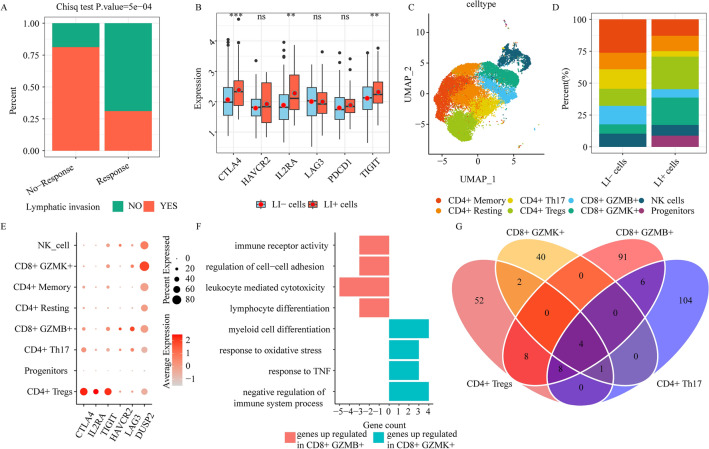
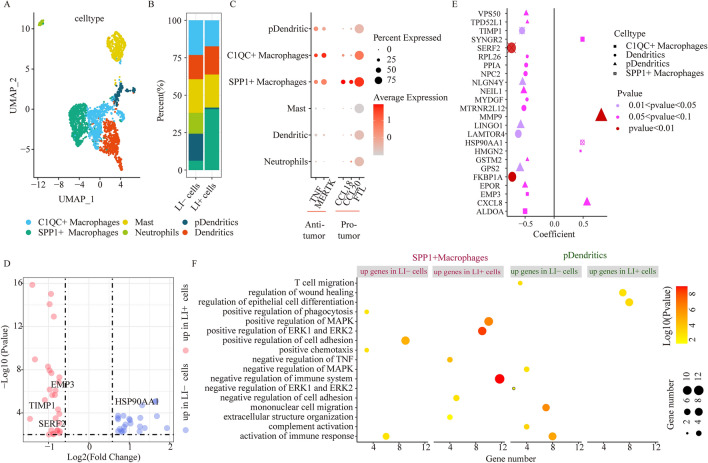
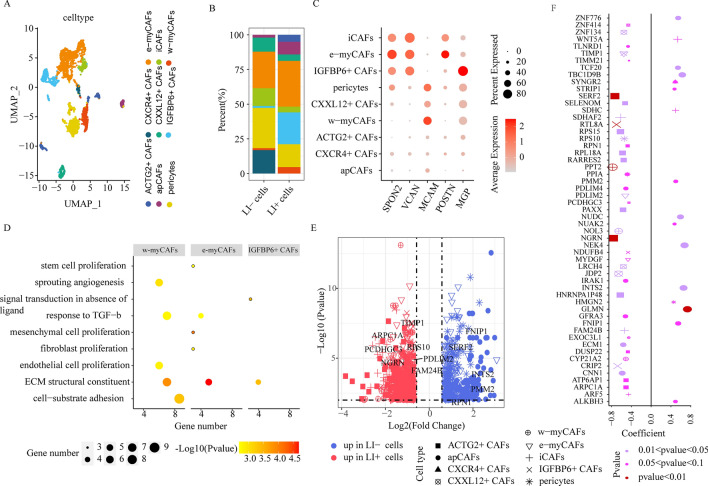
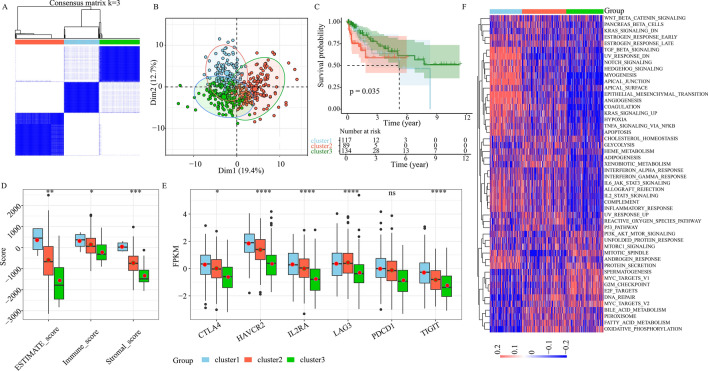
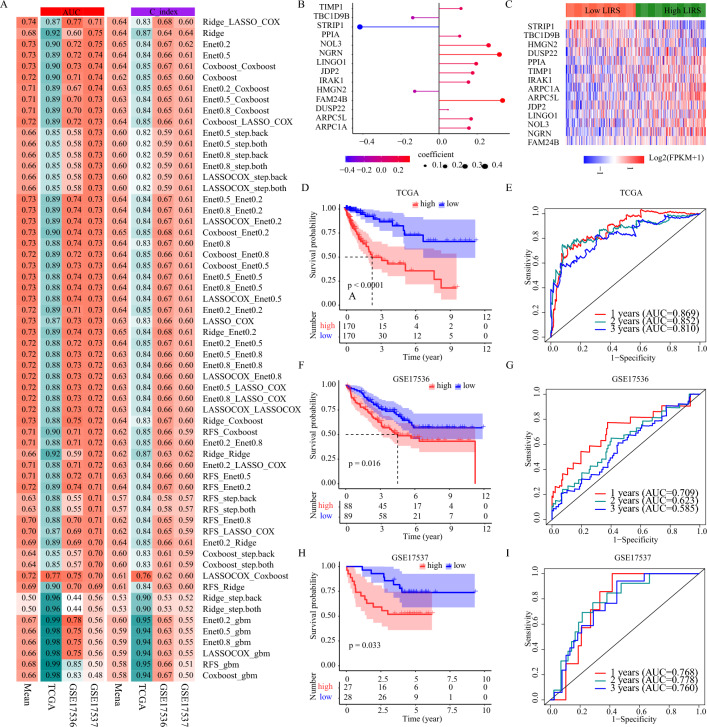
Lymphatic invasion (LI) is extremely aggressive and induces worse prognosis among patients with colorectal cancer (CRC). Thus, it is critical to characterize the cellular and molecular mechanisms underlying LI in order to establish novel and efficacious therapeutic targets that enhance the prognosis of CRC patients. RNA-seq data, clinical and survival information of colon adenocarcinoma (COAD) patients were obtained from the TCGA database. In addition, three scRNA-seq datasets of CRC patients were acquired from the GEO database. Data analyses were conducted with the R packages. We assessed the tumor microenvironment (TME) differences between LI+ and LI- based scRNA-seq data, LI+ cells exhibited augmented abundance of immunosuppression and invasive subset. Marked extracellular matrix network activation was also observed in LI+ cells within SPP1+ macrophages. We revealed that an immunosuppressive and pro-angiogenic TME strongly enhanced LI, as was evidenced by the CD4+ Tregs, CD8+ GZMK+, SPP1+ macrophages, e-myCAFs, and w-myCAFs subcluster infiltrations. Furthermore, we identified potential LI targets that influenced tumor development, metastasis, and immunotherapeutic response. Finally, a novel LIRS model was established based on the expression of 14 LI-related signatures, and in the two testing cohorts, LIRS was also proved to have accurate prognostic predictive ability. In this report, we provided a valuable resource and extensive insights into the LI of CRC. Our conclusions can potentially benefit the establishment of highly efficacious therapeutic targets as well as diagnostic biomarkers that improve patient outcomes.


Conflict of interest statement

The authors declare no competing interests.

Figures

Figure 1
Figure 1
A summary of the single cells in CRC patients, and recognition of primary cell types in the GSE200997 dataset. (A) UMAP plot depicting single cells (colored according to cell cluster). (B) UMAP plot depicting single cells (colored according to cellular type). (C) UMAP plot depicting single cells (colored according to sample origins, either tumor versus normal samples). (D) Dot plot illustrating representative marker genes across all cellular clusters. Dot size indicates fraction of specific gene-expressing cells. Color intensity indicates relative specific gene expressions. (E) Stacked bar chart depicting 7 major cellular type contents in individual tumor or normal samples.
Figure 2
Figure 2
Immune response is diminished in lymphatic invasion (LI) patients. (A) Bar graph depicting the primary therapeutic response (complete/partial response (response), stable/progressive disease (no-response)) for LI and no-LI TCGA patients. (B) The immune checkpoint gene expression profiles between LI- and LI+ cells (ns ≥ 0.05, * < 0.05, ** < 0.01, *** < 0.001 and **** < 0.0001). (C) UMAP plots depicting all NK and T cells, colored according to cell sub-clusters. (D) Stacked bar chart depicting detailed components of individual NK/T cell clusters in LI- or LI+ cells. (E) The immune checkpoint gene expressions in 8 NK/T cell subclusters. (F) Enrichment analysis of upregulated genes in CD8+ GZMK+ or CD8+ GZMB+ cells. (G) The venn plot depicting DEG contents in CD4+ Tregs, CD8+ GZMK+, CD4+ Th, and CD8+ GZMB+, by comparing LI+ or LI-cells to the remaining cells.
Figure 3
Figure 3
Myeloid cellular cluster comparison between LI+ and LI- cells. (A) UMAP plots depicting all myeloid cells, colored according to cellular sub-clusters. (B) Stacked bar chart illustrating the detailed compositions of individual myeloid cell clusters in LI- and LI+ cells. (C) The tumor suppressor and tumor promoting gene expressions in individual myeloid sub-clusters. (D) DEG evaluation via comparison of LI+ or LI-cells to the remaining cells in SPP1+ macrophages. (E) Association between gene expression and OS for DEGs via comparison among LI+ or LI-cells and the remaining cells in individual myeloid sub-clusters. Dot size represents the absolute correlation coefficient value, and shape indicates the cell subsets. (F) Enrichment analysis for DEGs via comparison of LI+ or LI-cells to the remaining cells in SPP1+ macrophages and pDCs.
Figure 4
Figure 4
CAF cell cluster comparisons between LI+ and LI- cells. (A) UMAP plots depicting all CAF cells, colored according to the cell sub-clusters. (B) Stacked bar chart illustrating the detailed compositions of individual CAF cell clusters in LI- and LI+ cells. (C) The expression profiles of genes (SPON2, VCAN, MCAM, MGP, and POSTN) whose enhanced expression is correlated with disease progression and metastasis, in individual CAF sub-clusters. (D) Enrichment analyses of significantly upregulated genes in e-myCAFs, w-myCAFs, and IGFBP6+ CAFs. (E) DEG evaluation via comparison of the LI+ or LI-cells to the remaining cells in individual CAF cell clusters. (F) Association between gene expression and patient OS for DEGs via comparison of LI+ or LI-cells to the remaining cells in individual CAF sub-clusters. Dot size represents the absolute correlation coefficient value, and shape indicates the cellular subsets.
Figure 5
Figure 5
Consensus clustering of lymphatic invasion (LI)-associated genes in TCGA-COAD. (A) Consensus matrices of TCGA patients. (B) PCA analysis of the 3 subgroups in TCGA cohort. (C) KM curves depicting prognosis of the 3 TCGA subgroups. (D) Stromal, immune, and estimate scores among the 3 subgroups (ns ≥ 0.05, * < 0.05, ** < 0.01, *** < 0.001 and **** < 0.0001). (E) The immune checkpoint gene expressions among 3 subgroups (ns ≥ 0.05, * < 0.05, ** < 0.01, *** < 0.001 and **** < 0.0001). (F) Heatmap depicting gene set variation analysis scores of the 50 hallmark gene sets in the 3 subgroups of colorectal cancer (CRC). Color intensity represents scores.
Figure 6
Figure 6
Development and validation of the LI-related prognostic model. (A) The AUC and C-indexes of 60 machine-learning algorithm combinations in the TCGA-COAD training cohort and the two testing cohorts. (B) Coefficients of the 14 LI-related signatures in the cox regression model. (C) The differential expression of 14 LI-related signatures between high- and low-LIRS subgroups based on median level of LIRS in TCGA-COAD. (DI) Kaplan–Meier survival curve of OS between high- and low-LIRS, and ROC curves at 1, 2 and 3 years in the TCGA-COAD training cohort and the two testing cohorts.

References

    1. Sung H, et al. Global Cancer Statistics 2020: GLOBOCAN Estimates of Incidence and Mortality Worldwide for 36 Cancers in 185 Countries. CA. 2021;71:209–249. doi: 10.3322/caac.21660. - DOI - PubMed
    1. van Wyk HC, Roxburgh CS, Horgan PG, Foulis AF, McMillan DC. The detection and role of lymphatic and blood vessel invasion in predicting survival in patients with node negative operable primary colorectal cancer. Crit. Rev. Oncol. Hematol. 2014;90:77–90. doi: 10.1016/j.critrevonc.2013.11.004. - DOI - PubMed
    1. Shi J, et al. Molecular profile reveals immune-associated markers of lymphatic invasion in human colon adenocarcinoma. Int. Immunopharmacol. 2020;83:106402. doi: 10.1016/j.intimp.2020.106402. - DOI - PubMed
    1. Zhang H, Zhao G, Zhu G, Ye J. Identification of lymph node metastasis-related genes and patterns of immune infiltration in colon adenocarcinoma. Front. Oncol. 2022;12:907464. doi: 10.3389/fonc.2022.907464. - DOI - PMC - PubMed
    1. Schwitalla S, et al. Loss of p53 in enterocytes generates an inflammatory microenvironment enabling invasion and lymph node metastasis of carcinogen-induced colorectal tumors. Cancer Cell. 2013;23:93–106. doi: 10.1016/j.ccr.2012.11.014. - DOI - PubMed