. 2024 May;30(5):1292-1299.
doi: 10.1038/s41591-024-02924-9. Epub 2024 Apr 17.

The fasciola cinereum of the hippocampal tail as an interventional target in epilepsy

Affiliations

The fasciola cinereum of the hippocampal tail as an interventional target in epilepsy

Ryan M Jamiolkowski et al. Nat Med. 2024 May.

Abstract

Targeted tissue ablation involving the anterior hippocampus is the standard of care for patients with drug-resistant mesial temporal lobe epilepsy. However, a substantial proportion continues to suffer from seizures even after surgery. We identified the fasciola cinereum (FC) neurons of the posterior hippocampal tail as an important seizure node in both mice and humans with epilepsy. Genetically defined FC neurons were highly active during spontaneous seizures in epileptic mice, and closed-loop optogenetic inhibition of these neurons potently reduced seizure duration. Furthermore, we specifically targeted and found the prominent involvement of FC during seizures in a cohort of six patients with epilepsy. In particular, targeted lesioning of the FC in a patient reduced the seizure burden present after ablation of anterior mesial temporal structures. Thus, the FC may be a promising interventional target in epilepsy.


Conflict of interest statement

The authors declare no competing interests.

Figures

Fig. 1
Fig. 1. FC neurons are highly active during seizures in mouse models of acute and chronic TLE.
a, Diagram showing how scFLARE induces stable labeling of neurons with mCherry only when there are both high intracellular Ca2+ and light delivery. CaTEV, Ca2+-activated TEV protease; hLOV, hybrid light-oxygen-voltage-sensing domain; TEVcs, Tobacco Etch Virus protease cleavage site; TF, transcription factor. b, Schematic showing closed-loop seizure detection and light delivery in wild-type mice to label seizure-active neurons. TTL, transistor–transistor logic c, Coronal section wide-field image and higher magnification of the boxed region of interest (inset) from a non-epileptic mouse, with evident PCP4 expression in the FC. Representative image from three mice, three to five sections per mouse. d, Coronal section wide-field image (left) and higher magnification of the region of interest (right three images) with FC cells labeled with mCherry, indicating that the FC cell population is highly active during seizures. Representative image from six mice, three to five sections per mouse. The scale bar in the fourth image also applies to the second and third images. e, Schematic showing two-photon imaging setup in PCP4-Cre chronically epileptic mice. f, Example trace showing the fluorescence intensity (ΔF/F, normalized to that cell’s maximum) of a representative FC neuron imaged using jGCaMP8f (green), above a plot of spiking rate recorded simultaneously from that mouse’s hippocampus, with time intervals meeting seizure criteria highlighted in gray. g, Heat map for each of the 80 FC neurons recorded from three mice, showing an increase in activity (as reflected by intracellular Ca2+ and ΔF/F) during interictal spikes, set as time = 0. h, Heat map for each of the recorded FC neurons showing an increase in activity during the start of a seizure and a decrease in activity when the seizure ends. Correlation between Ca2+ activity and spiking for the cells is r = 0.43 ± 0.03 (s.e.m.).
Fig. 2
Fig. 2. The FC in mice is an intervenable target for the treatment of TLE.
a, Schematic showing closed-loop seizure detection and light delivery to activate the inhibitory opsin stGtACR2 in PCP4-Cre mice. b, Section of mouse hippocampus showing stGtACR2–FusionRed in the bilateral FC of a chronically epileptic mouse, with the tract (dotted white line) left by the optical fiber terminating just superior to the FC ipsilateral to the previous kainic acid injection. Representative image from four mice, three to five sections per mouse. c, Example seizures detected at the time marked by pink lines in which light was delivered (top, blue bar) and not delivered (bottom). d, Cumulative distribution curve and histogram (n = 4 mice) showing a greater proportion of short seizures (<5 s) measured from the time of seizure detection when light is delivered (blue) compared with when it is not (gray) for PCP4-Cre mice expressing stGtACR2 in the FC. A mixed-effect model comparing the seizure durations with light off versus light on resulted in F(1, 1,010) = 51.47, P < 0.0001, for mice expressing stGtACR2. e, Cumulative distribution curve and histogram (n = 4 mice) showing similar seizure duration after the trigger when light was delivered (blue) compared with when it was not (gray) for PCP4-Cre control mice expressing mCherry in the FC. A mixed-effect model comparing the seizure durations with light off versus light on resulted in F(1, 778) = 0.1133, P = 0.74, for control mice expressing mCherry. f, Normalized seizure duration comparing seizure length with light off versus that with light on, for mice expressing stGtACR2 and control mice expressing mCherry in the FC. stGtACR2, 76 ± 3% (2,075 seizures from 4 mice); mCherry, 98 ± 4% (1,627 seizures from 4 mice); normalized seizure duration ± s.e.m. **P = 0.0038, t = −4.56213, two-tailed t-test.
Fig. 3
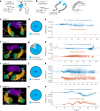
Fig. 3. The FC in the human posterior–medial hippocampal tail is involved in seizure initiation and propagation in TLE.
a,b, Schematic illustrations of hippocampal formation (HF) comparing rodent and primate FC anatomy, as previously described. a, The rodent dorsal HF bends medially, leading to a medially located FC (blue). b, In primates, the anterior (equivalent to ventral) HF (uncus and genu of the anterior hippocampus) bends medially, so the FC is posteriorly located. Hippocampus drawing adapted with permission from ref. , Springer. c, Diagram of sEEG electrodes in the right posterior–medial hippocampal tail (FC, blue), the hippocampal body and head (orange), and the amygdala (green) of patient 1, with the thalamus shown in purple. Of note, the left hippocampus of this patient has an electrode targeting the hippocampal tail less posteriorly than the FC, in a more conventional trajectory. d, All seizures recorded from this patient had FC involvement (n = 7 of 7 seizures). e, LFP trace for a representative seizure as recorded by electrodes in the FC (blue) and the amygdala and anterior hippocampus (orange). f, Diagram of sEEG electrodes targeting the amygdala, anterior hippocampus and FC of patient 2. g, Of the seizures recorded from this patient, 83% had FC involvement (n = 15 out of 18 seizures). h, Representative LFP traces for a seizure from this patient. i, Diagram of sEEG electrodes targeting the amygdala, anterior hippocampus and FC of patient 3. j, All seizures recorded from this patient had FC involvement (n = 5 out of 5 seizures). k, Representative LFP traces for a seizure from this patient. l, Diagram of sEEG electrodes targeting the amygdala, anterior hippocampus and FC of patient 4. m, All seizures recorded from this patient had FC involvement (n = 3 out of 3 seizures). n, Representative LFP traces for a seizure from this patient. Note the differences in the vertical axes in e, h, k and n.
Fig. 4
Fig. 4. FC is involved in seizures originating from an occipital focus.
a, Fast gray matter acquisition T1 inversion recovery axial MRI showing left occipital FCD. b, Diagram of sEEG electrodes in the left posterior–medial hippocampal tail (FC, blue), as well as in the hippocampal body and head (orange) and amygdala (green), of patient 5, with the thalamus shown in purple. Other electrodes targeted the medial–occipital FCD in the left lingual gyrus (pink). c, Reconstruction of sEEG electrode positions based on postoperative CT and T1 MRI, with the blue arrow pointing to the contact in the FC. The electrode in the occipital FCD is also apparent, indicated by the white arrow. d, All seizures recorded from this patient had FC involvement (n = 15 out of 15 seizures). e, LFP trace for a representative seizure originating from the medial–occipital FCD, as recorded by electrodes in the medial–occipital cortex and FCD (pink), FC (blue) and anterior hippocampus (orange).
Fig. 5
Fig. 5. The FC is a viable treatment target in humans.
a, Reconstruction of sEEG electrodes (yellow) in remnants of the hippocampal tail (blue), as well as in the temporal pole (orange) of patient 6 who had a previous amygdalohippocampectomy. The thalamus is shown in purple. b, All seizures recorded from this patient had FC involvement (n = 117 out of 117 seizures). c, LFP trace for a representative seizure originating from the posterior–medial hippocampal tail remnant (onset time at 0 s), as recorded by electrodes in the FC (blue) and in the temporal pole (orange). d,e, Three-dimensional reconstruction (d) and intraoperative in-line and orthogonal slice of post-contrast T1 MRI (e) showing a laser fiber inserted in the lateral edge of the hippocampal tail to avoid heat spread into the thalamus. The contrast-enhancing lesion appears to include the entirety of the remnant. f,g, Three-dimensional reconstruction (f) based on coronal and axial T2-weighted MRI (g) at 6 months following the second ablation, with a small residual FC adjacent to the lateral geniculate nucleus of the thalamus.
Extended Data Fig. 1
Extended Data Fig. 1. FC location in mouse brain.
Coronal, sagittal, and axial images of mouse FC (blue) based on Allen Mouse Common Coordinate Framework.
Extended Data Fig. 2
Extended Data Fig. 2. FC neurons are highly active during seizure in a mouse model of chronic temporal lobe epilepsy.
a, Schematic showing the injection of kainic acid into the hippocampus of wild-type mice to generate chronic epilepsy, followed by viral injection 2–4 wks later to induce expression of the scFLARE tool and mCherry reporter in the hippocampus. Mice then underwent insertion of a hippocampal wire electrode to detect seizures and an optical fiber. Light was delivered through the optical fiber when the electrode detected a seizure. b, In epileptic mice, scFLARE-mCherry labeled PCP4+ FC neurons. Representative image from 3 mice, 3–5 sections per mouse. Of note, there is not significant cell death of the PCP4+ neuron population within the FC in this model.
Extended Data Fig. 3
Extended Data Fig. 3. FC neurons are highly active during seizure in the intra-amygdalar kainic acid mouse model of temporal lobe epilepsy.
a, Schematic showing the injection of virus to induce expression of the scFLARE tool and eGFP reporter in the hippocampus of wild-type mice, followed 1 week later by injection of kainic acid into the amygdala, along with insertion of a hippocampal wire electrode to detect seizures and an optical fiber. Light was delivered through the optical fiber when the electrode detected a seizure. b, In seizing mice, scFLARE-eGFP labeled PCP4+ FC neurons. Representative image from 3 mice, 3 sections per mouse. c, In non-seizing mice (injected with saline rather than kainic acid), scFLARE-eGFP had neglible labeling of PCP4+ FC neurons. Representative image from 2 mice, 3 sections per mouse.
Extended Data Fig. 4
Extended Data Fig. 4. Calcium sensor expression in FC.
a, Coronal section fluorescence image of Cre-dependent jGCaMP8f expressed in the FC of PCP4-Cre mice, with outlined tract of GRIN lens aiming at FC of hippocampus ipsilateral to kainic acid injection. b, 2-photon microscope (average intensity projection) image through GRIN lens of individual cells. Representative image from 3 mice. c, Post-hoc image (coronal section) shows the characteristic granule cell-like morphology and elongated processes of FC neurons (same mouse as panels a and b). Representative image from 3 mice, 3–5 sections per mouse.
Extended Data Fig. 5
Extended Data Fig. 5. Effect of optogenetic inhibition of FC neurons on seizure duration for individual mice.
ad, Cumulative distribution curves and histograms for each of four individual mice demonstrating a greater proportion of short seizures (<5 sec) measured from the time of seizure detection when light is delivered (blue) compared to when it is not (gray) for PCP4-Cre mice expressing stGtACR2 in the FC. Numbers of seizures detected for each animal, listed as # of seizures with light on / # of seizures with light off, are as follows: a. stGtACR2 mouse 1: 313/304. Mann-Whitney test comparing distributions: P < 0.00001. b. stGtACR2 mouse 2: 208/216. Mann-Whitney test comparing distributions: P < 0.00001. c. stGtACR2 mouse 3: 210/215. Mann-Whitney test comparing distributions: P < 0.01. d. stGtACR2 mouse 4: 291/318. Mann-Whitney test comparing distributions: P < 0.0001. eh, Cumulative distribution curves and histograms for each of four individual mice demonstrating similar seizure duration after trigger when light is delivered (blue) compared to when it is not (gray) for PCP4-Cre control mice expressing mCherry in the FC. Numbers of seizures detected for each animal, listed as # of seizures with light on / # of seizures with light off, are as follows: e. Control mouse 1: 230/238. Mann-Whitney test comparing distributions: P = 0.12. f. Control mouse 2: 188/183. Mann-Whitney test comparing distributions: P = 0.39. g. Control mouse 3: 151/172. Mann-Whitney test comparing distributions: P = 0.65. h. Control mouse 4: 217/258. Mann-Whitney test comparing distributions: P = 0.40.
Extended Data Fig. 6
Extended Data Fig. 6. High frequency oscillations (HFOs) in FC.
Excerpts of FC LFP tracings presented in Figs. 3 and 5, with shorter time scale (see x-axis). Below each LFP tracing are corresponding spectrograms, with black arrows indicating HFOs. a, LFP tracing and spectrogram from 0 s to 1.5 s for patient 1. b, LFP tracing and spectrogram from 11.5 s to 12.5 s for patient 2. c, LFP tracing and spectrogram from 3 s to 4 s for patient 6. Time-frequency plots were obtained via convolution with a Morlet wavelet function. An amplitude of the wavelet transform was then obtained via its absolute value, and displayed on a logarithmic scale (color map).
Extended Data Fig. 7
Extended Data Fig. 7. Prior LITT amygdalohippocampectomy for patient whose seizures recurred (Patient 6).
a, b, Intraoperative in-line slices of T1 MRI demonstrating optical fiber inserted in along long axis of hippocampus and amygdala of patient 6. c, T1 post-contrast MRI immediately after ablation, demonstrating large rim-enhancing lesion that encompasses amygdala and hippocampal head and body. d, e, Follow-up T1 MRI demonstrating cavity where mesial temporal structures were successfully ablated, aside from the posterior-medial remnant of the hippocampal tail including the FC.
Extended Data Fig. 8
Extended Data Fig. 8. EEG sampling trajectories for Patient 6 after amygdalohippocampectomy.
a, Reconstruction of sEEG electrode positions based on post-operative CT and T1 MRI, with blue arrow pointing to contact in FC. Electrode in temporal pole also visible in sagittal scan, noted by orange arrow. b, Diagram of sEEG electrode positions demonstrating wide sampling across both hemispheres, not restricted to mesial temporal structures. Contacts of the posterior hippocampal and temporal electrodes are red, with the FC contact highlighted in blue and the temporal pole electrode highlighted in orange. Blue arrow points to left FC, orange arrow points to left temporal pole.

Similar articles

Cited by

References

    1. McGinn RJ, Von Stein EL, Summers Stromberg JE, Li Y. Precision medicine in epilepsy. Prog. Mol. Biol. Transl. Sci. 2022;190:147–188. doi: 10.1016/bs.pmbts.2022.04.001. - DOI - PubMed
    1. Wendling AS, et al. Selective amygdalohippocampectomy versus standard temporal lobectomy in patients with mesial temporal lobe epilepsy and unilateral hippocampal sclerosis. Epilepsy Res. 2013;104:94–104. doi: 10.1016/j.eplepsyres.2012.09.007. - DOI - PubMed
    1. Schramm J. Temporal lobe epilepsy surgery and the quest for optimal extent of resection: a review. Epilepsia. 2008;49:1296–1307. doi: 10.1111/j.1528-1167.2008.01604.x. - DOI - PubMed
    1. Schramm J, et al. Randomized controlled trial of 2.5-cm versus 3.5-cm mesial temporal resection in temporal lobe epilepsy—part 1: intent-to-treat analysis. Acta Neurochir. 2011;153:209–219. doi: 10.1007/s00701-010-0900-6. - DOI - PubMed
    1. Haegelen C, et al. High-frequency oscillations, extent of surgical resection, and surgical outcome in drug-resistant focal epilepsy. Epilepsia. 2013;54:848–857. doi: 10.1111/epi.12075. - DOI - PMC - PubMed