. 2024 May;629(8010):121-126.
doi: 10.1038/s41586-024-07297-0. Epub 2024 Apr 17.

Neural crest origin of sympathetic neurons at the dawn of vertebrates

Affiliations

Neural crest origin of sympathetic neurons at the dawn of vertebrates

Brittany M Edens et al. Nature. 2024 May.

Abstract

The neural crest is an embryonic stem cell population unique to vertebrates1 whose expansion and diversification are thought to have promoted vertebrate evolution by enabling emergence of new cell types and structures such as jaws and peripheral ganglia2. Although jawless vertebrates have sensory ganglia, convention has it that trunk sympathetic chain ganglia arose only in jawed vertebrates3-8. Here, by contrast, we report the presence of trunk sympathetic neurons in the sea lamprey, Petromyzon marinus, an extant jawless vertebrate. These neurons arise from sympathoblasts near the dorsal aorta that undergo noradrenergic specification through a transcriptional program homologous to that described in gnathostomes. Lamprey sympathoblasts populate the extracardiac space and extend along the length of the trunk in bilateral streams, expressing the catecholamine biosynthetic pathway enzymes tyrosine hydroxylase and dopamine β-hydroxylase. CM-DiI lineage tracing analysis further confirmed that these cells derive from the trunk neural crest. RNA sequencing of isolated ammocoete trunk sympathoblasts revealed gene profiles characteristic of sympathetic neuron function. Our findings challenge the prevailing dogma that posits that sympathetic ganglia are a gnathostome innovation, instead suggesting that a late-developing rudimentary sympathetic nervous system may have been characteristic of the earliest vertebrates.


Conflict of interest statement

Competing Interests

The authors declare no competing interests.

Figures
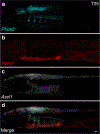
Extended data figure 1:
Extended data figure 1:. Expression of sympathoadrenal genes at early embryonic stages.
(a-c) HCR detection of Phox2 (teal), Hand (red), and Ascl1 (white) in lamprey at T25. (d) The three transcripts are not co-expressed. Scale bar=50μm. n=6 embryos across three independent replicates.
Extended data figure 2:
Extended data figure 2:. Co-expression of sympathoadrenal fate-specifying genes with catecholamine biosynthetic enzymes in post-embryonic lamprey.
HCR detection of Th (teal) and Dbh (red) with (a-d) Ascl1, (e-h) Phox2, and (i-l) Hand in white at T30+ in whole mount. The core sympathoadrenal transcription factors are persistently co-expressed with catecholamine synthesis enzymes. Scale bars=20μm. n=9 embryos across three independent replicates.
Extended data figure 3:
Extended data figure 3:. Early expression of catecholamine biosynthetic enzymes.
(a-d) HCR detection of Th (teal) and Dbh (red) in lamprey at T27. Colocalization of the transcripts is seen in cells surrounding the heart and spanning the initial segment of the trunk in bilateral streams. Scale bars=100μm. Red asterisk denotes the heart. n=6 embryos across three independent replicates.
Extended data Figure 4:
Extended data Figure 4:. Quantification of relative morphology of TH+ neuroblasts/neurons from T27 to T30.
Morphology of TH+ cells was compared from T27- and T30- staged embryos by plotting [neurite length/soma diameter]. This measure revealed increased neurite length in T30 as compared to T27, consistent with greater neuronal maturation. **** p<0.0001 by two-tailed Mann-Whitney U-test. A total of fifty cells from five embryos were measured for each developmental stage. Error bars indicate SEM.
Extended data figure 5:
Extended data figure 5:. Late neurogenesis of lamprey sympathoblasts.
(a-i) Immunohistochemical detection of TH (teal) and Neurofilament-M (Nf-M, red) at T30 (a-c), 2.5 month ammocete (d-f), and 4 month ammocete (g-i) stages. Co-expression of TH and Nf-M is not observed in late embryonic or earlier ammocete stages. Consistent co-labeling is observed by four months of age. n=12 embryos, 12 ammocetes of each stage per marker across four independent replicates (j-o) Co-expression of TH with additional neuronal markers is observed in four month old ammocetes. HuC/D (j-l) and SCG10 (m-o) are shown. DAPI is shown in white. Scale bars=50μm. n=9 ammocetes of each stage per marker across three independent replicates.
Extended data figure 6:
Extended data figure 6:. Lamprey sympathoblasts are neural crest-derived.
Lineage tracing of TH+ sympathoblasts. CM-DiI-labeled neural crest (red) localizes to TH+ cells (teal) at (a-c) T27 and (d, e) T30, indicating a neural crest origin. Arrowheads (b, c, and e) indicate CM-DiI-labeled cells. DAPI is shown in white. Scale bars=20μm. DA=dorsal aorta, E=esophagus, I=Intestine. Experimental details are shown in Extended Data Table 1.
Extended data figure 7:
Extended data figure 7:. Analysis of gene expression in lamprey sympathetic neurons.
(a) Representative image of a wild-caught lamprey ammocete used for selection of trunk sympathetic neurons. Scale bar=1cm. (b and c) Immunohistochemical detection of TH (teal) in transverse sections through ammocete trunks. DAPI is shown in white. Yellow box indicates the site of the sympathetic chain neurons. SC=spinal cord, NC=notochord. Scale bars=250μm (a) and 10μm (b). n=4 ammocetes across three independent replicates. (d and e) GO analyses of Metabolites and Cell Compartment for TH+ neurons. Analyses are performed using the top 500 significantly upregulated transcripts with an enrichment cutoff of 1.5 log2(Fold Change). p-values are determined using Fisher’s exact test. (f) Immunohistochemical detection of DBH (teal) at T28. Punctate expression is consistent with vesicular localization of DBH protein. Scale bar=20μm. n=6 embryos across three independent replicates.
Extended data figure 8:
Extended data figure 8:. Comparison of gene expression between mouse and lamprey sympathetic neurons.
(a) GO analysis of Enrichr Protein-Protein Interaction (PPI) Hubs for mouse sympathetic neurons previously reported. Analysis is performed using the 500 most abundantly expressed genes across all noradrenergic neuron subtypes. p-values are determined using Fisher’s exact test. (b) Venn diagram indicating PPI Hub terms implicated in both mouse and lamprey sympathetic neurons.
Extended data figure 9:
Extended data figure 9:. Analysis of noradrenergic subtypes in lamprey.
HCR detection of Th (teal) with (a-c) Npy (red), (d-g) Npy (red) and Ret (white), and (h-k) Gfra2 (red) and Ret (white) in whole mount ammocete trunks. Consistent co-expression of Th and Npy (a-c) suggests the presence of the NA3 noradrenergic subtype in lamprey. A lack of consistent co-expression of Th with Npy and Ret (d-g) and Gfra2 and Ret suggest the absence of noradrenergic subtypes NA2 and NA5, respectively. Scale bars=20μm. n=12 ammocetes across four independent replicates.
Figure 1:
Figure 1:. Co-expression of sympathoadrenal fate-specifying genes in late embryonic lamprey.
(a) HCR detection of Phox2 (teal), Ascl1 (white), and Hand (red) in lamprey at T28. DAPI is shown in blue. Red asterisk denotes the heart. (b-i) Co-localization of all three transcripts is seen in cells spanning the trunk dorsal to the yolk tube. Scale bars=100μm. (j-n) Transverse section of multiplex HCR in T28 lamprey as shown in (a). DAPI is shown in blue. Bilateral cells co-expressing Phox2 (teal), Ascl1 (white), and Hand (red) reside above the yolk tube, flanking the dorsal aorta. White asterisk denotes the dorsal aorta. Scale bars=50μm. n=15 embryos across five independent replicates.
Figure 2:
Figure 2:. Expression of catecholamine biosynthetic enzymes by lamprey sympathoblasts.
(a-j) HCR detection of Th (teal) and Dbh (red) in lamprey at T28. Co-localization of the transcripts is seen in cells surrounding the heart (b-d) and spanning the initial length of the trunk in bilateral streams (e-j). Scale bars=100μm. n=15 embryos across five independent replicates. (k-m) Immunohistochemical detection of TH (teal) at T28 is consistent with HCR. HNK1 antibody staining of axons is shown in red. Scale bars=100μm. n=15 embryos across five independent replicates. (n, o) Immunohistochemical detection of TH (red) at (n) T27 and (o) ammocete stages. At both stages, TH+ cells are localized lateral to the dorsal aorta (denoted by white asterisks) and dorsal to the yolk tube or the intestinal epithelium. TH+ cells are highlighted in zoomed insets. DAPI is shown in white. Scale bars=50μm. n=12 embryos, 12 ammocetes across four independent replicates.
Figure 3:
Figure 3:. Late-developing sympathetic neurons in the lamprey trunk.
(a-d) Comparison of cell morphology based on immunohistochemistry for TH at T27 (a, b) and T30 (c, d). Scale bars=10μm. (e-k) TH (teal) and Neurofilament-M (Nf-M, red) co-expression is detected by immunohistochemistry in streams of neurons in ammocete trunks. Scale bars=50μm. n=15 embryos per stage and 15 ammocetes across five independent replicates.
Figure 4:
Figure 4:. Neural crest origin of lamprey sympathoblasts.
(a and b) Representative images of CM-DiI labeling of neural crest at T21, time of injection, in (a) whole mount with CM-DiI shown in gray, and in (b) transverse section with CM-DiI shown in red and DAPI shown in white. NT=neural tube. Scale bars=50μm. (c-e) DiI-lineage tracing of TH+ sympathoblasts at T27. CM-DiI-labeled neural crest (red) localizes to TH+ cells (teal), revealing a neural crest origin. DA=dorsal aorta, E=esophagus. Arrowheads indicate DiI-labeled cells in split-channel zoom. DAPI is shown in white. Scale bars=20μm. Experimental details are shown in Extended Data Table 1.
Figure 5:
Figure 5:. Conserved molecular characteristics of lamprey sympathetic neurons.
(a) Volcano plot of differentially expressed genes identified between TH+ and TH cells harvested from ammocete trunks. Annotation is provided for the top upregulated transcripts. (b) GO analysis of Enrichr Protein-Protein Interaction (PPI) Hubs for TH+ neurons. Analysis is performed using the top 500 significantly upregulated transcripts with an enrichment cutoff of 1.5 log2(Fold Change). p-values are determined using Fisher’s exact test. (c) Heat map comparing expression of developmentally-regulated and canonical sympathetic (e.g., neuronal, transporter, and synaptic) genes between TH+ and TH cells. Key indicates gene expression as log10(TPM, transcripts per million). (d-o) HCR validation of mRNA-seq targets in ammocete trunks shown in transverse sections. Th (teal) colocalizes with Gphn (d-g), Nptn (h-k), and ATP6V1B2 (l-o), each shown in red. DAPI is shown in white. Scale bars=20μm. n=4 ammocetes across three independent replicates for each gene combination.

Similar articles

Cited by

References

    1. Le Douarin N The Neural Crest. (Cambridge Univ. Press, 1982).
    1. Martik ML et al. Evolution of the new head by gradual acquisition of neural crest regulatory circuits. Nature 574, 675–678 (2019). 10.1038/s41586-019-1691-4 - DOI - PMC - PubMed
    1. Botar J Evolution and general anatomy of the autonomic nervous system. Gegenbaurs Morphol Jahrb 120, 271–279 (1974). - PubMed
    1. Burnstock G Evolution of the autonomic innervation of visceral and cardiovascular systems in vertebrates. Pharmacol Rev 21, 247–324 (1969). - PubMed
    1. Haming D et al. Expression of sympathetic nervous system genes in Lamprey suggests their recruitment for specification of a new vertebrate feature. PLoS One 6, e26543 (2011). 10.1371/journal.pone.0026543 - DOI - PMC - PubMed

Publication types

MeSH terms

LinkOut - more resources