. 2024 Apr;628(8009):811-817.
doi: 10.1038/s41586-024-07263-w. Epub 2024 Apr 17.

Hybrid speciation driven by multilocus introgression of ecological traits

Affiliations

Hybrid speciation driven by multilocus introgression of ecological traits

Neil Rosser et al. Nature. 2024 Apr.

Abstract

Hybridization allows adaptations to be shared among lineages and may trigger the evolution of new species1,2. However, convincing examples of homoploid hybrid speciation remain rare because it is challenging to demonstrate that hybridization was crucial in generating reproductive isolation3. Here we combine population genomic analysis with quantitative trait locus mapping of species-specific traits to examine a case of hybrid speciation in Heliconius butterflies. We show that Heliconius elevatus is a hybrid species that is sympatric with both parents and has persisted as an independently evolving lineage for at least 180,000 years. This is despite pervasive and ongoing gene flow with one parent, Heliconius pardalinus, which homogenizes 99% of their genomes. The remaining 1% introgressed from the other parent, Heliconius melpomene, and is scattered widely across the H. elevatus genome in islands of divergence from H. pardalinus. These islands contain multiple traits that are under disruptive selection, including colour pattern, wing shape, host plant preference, sex pheromones and mate choice. Collectively, these traits place H. elevatus on its own adaptive peak and permit coexistence with both parents. Our results show that speciation was driven by introgression of ecological traits, and that speciation with gene flow is possible with a multilocus genetic architecture.


Conflict of interest statement

The authors declare no competing interests.

Figures

Fig. 1
Fig. 1. Summary of key findings, geographical distributions of species and evidence that H. elevatus has a hybrid genome.
a, Evolutionary relationships and main introgression events described in this study. We test the hypothesis that introgression of major pre-mating and post-mating ecological isolating traits from H. melpomene led to the establishment of H. elevatus as a new stable hybrid species. Mya, million years ago. b, Geographical distributions of major clades. Locations at which both H. elevatus and H. pardalinus were sampled are numbered. c, Distance-based network using genome-wide independent SNPs. This concatenated tree shows the existence of two distinct clusters, Amazonian versus non-Amazonian, in both H. elevatus and H. pardalinus. d, Topology weighting analysis (TWISST) showing the percentage of the 11,509 non-overlapping genomic windows of 1,000 SNPs in which the majority of subtrees (that is, topology weighting ≥ 0.5) clusters H. elevatus (ele) with either H. pardalinus (par) (93.2%; top) or H. melpomene (mel) (0.52%; bottom). Note that although H. elevatus groups with H. pardalinus in 93.2% of windows, only 1.61% of those trees yield the two species as reciprocally monophyletic. By contrast, all three species are monophyletic in 81% of the windows for which H. elevatus groups with H. melpomene. Subscripts indicate geographical distributions for H. elevatus and H. pardalinus (Ama, Amazon; And, Andes; Gui, Guianas) and subspecies for H. melpomene (Agl, aglaope; Ams, amaryllis). e, A multispecies coalescent model with introgression supports a hybrid origin of H. elevatus, with the introgression time coinciding closely with the origin of the species (the 95% HPD intervals are given within parenthesis). Images of butterfly wings are copyright of the authors and Michel Cast.
Fig. 2
Fig. 2. Genomic admixture between H. elevatus and H. pardalinus.
a, Gene flow between species in sympatry is typically significantly greater (f4 > 0, filled points) than the within-species gene flow between populations across the Amazon basin. Numbers next to the points indicate the population pairs compared (see Fig. 1b). A significant positive correlation indicates that the within-species gene flow between populations X and Y declines with increasing geographical distance relative to between-species gene flow at populations X and/or Y. b, Estimates of effective migration rate (Nm) within and between species using G-PhoCS. In the Amazon, between-species Nm (parAma/eleAma) is similar to within-species Nm between locations (parAma/parAma and eleAma/eleAma). The estimates for parAma/eleAma are denoted as filled and open circles and correspond to within and between location comparisons, respectively. c, The best supported demographic model based on the site-frequency spectrum analysis supports H. elevatus and H. pardalinus as reciprocally monophyletic (Extended Data Fig. 4). They initially diverged with continuous gene flow (933 to 221 kya) and after splitting into Amazonian and non-Amazonian populations, they came into secondary contact and continued exchanging genes until the present (45 kya to the present). Numbers within the blocks are effective population sizes in thousands. Arrows between groups represent continuous gene flow; numbers above or below arrows indicate 2Nm values.
Fig. 3
Fig. 3. Speciation of H. elevatus was driven by multilocus introgression of ecological traits.
Patterns of genomic divergence between sympatric H. elevatus and H. pardalinus in the Amazon together with locations of mapped traits. The black line and y axis show FST in 25-kb sliding windows across the genome. Coloured bars show significant QTLs for different traits, with the QTL peak indicated by the triangle and the Bayesian credible intervals by the length of the bar. For colour pattern and wing shape, only QTLs with non-overlapping credible intervals are shown. Most of the genome shows very low FST due to gene flow in the Amazon, causing the double paraphyly topology for H. elevatus and H. pardalinus in Fig. 1c. Genomic regions with rare phylogenetic topologies (bottom right) supporting introgression from H. melpomene (white circles, introgression tree) and resolving the pardalinuselevatus species tree (grey circles, species tree) are shown above the plot. These topologies often coincide with one another and with FST peaks. O, outgroup (Heliconius ethilla). FW, forewing; HW, hindwing.
Fig. 4
Fig. 4. Key species traits under divergent ecological and sexual selection.
a, Heliconius elevatus and H. pardalinus differ in host plant preference during egg-laying; female H. elevatus show a stronger preference for Passiflora venusta relative to Passiflora riparia. Heliconius melpomene has a very distinct host plant preference and lays eggs on neither of these plants (Extended Data Fig. 6). Point sizes here and in b,c are scaled by the log of sample size. Error bars are 95% confidence limits. b, The two species differ in flight dynamics; H. elevatus beats its wings significantly faster than H. pardalinus, and converges towards H. melpomene aglaope. c, Given a choice, male H. elevatus individuals preferentially court model female wings with their own colour pattern relative to H. pardalinus, whereas H. pardalinus males exhibit no preference. d, Principal component analysis (PCA) of forewing colour pattern in hybrid crosses with the parental species and H. melpomene aglaope rotated and projected into this space. Wings show the top 10% of pixels contributing to the variance in PC1. e, PCA of male sex pheromones in hybrid crosses, with parental species rotated and projected. Differences between the species are driven mainly by variance in alkanes. Selected loadings: (1) hexahydrofarnesylacetone; (2) (Z)-9-heneicosene; (3) (Z)-11-eicosenylacetate; (4) (Z)-9−tricosene; (5) 11-methylhexacosane; (6) 11-methylpentacosane; (7) heptacosane; (8) tricosane; (9) heneicosane (inset figure); and (10) homovanillyl alcohol. f, PCA of hindwing shape in hybrid crosses, with parental species rotated and projected. Inset wing shows changes in hindwing shape observed along PC2. Only landmarks along the margin of the wing are shown. Individual specimens are depicted as circles: H. elevatus, blue; H. pardalinus, red; F2s and backcrosses, grey; and H. melpomene, yellow.
Extended Data Fig. 1
Extended Data Fig. 1. Evaluating the hybrid speciation hypothesis under the MSCi model.
For each model, a schematic representation is depicted on top and the estimated values under the MSCi are presented in the table below. In the schematics, open circles denote internal nodes and arrows between internal nodes represent single migration pulses. Effective population sizes (Ne) are scaled to thousand individuals. The age (τ) of splits and nodes involved in hybridization events are given in kya. Introgression probabilities (φ) are depicted in blue and are given as a percentage. a, Model in which the two parental species, S (ancestral of H. melpomene) and T (ancestral of H. pardalinus), hybridize to originate the hybrid lineage H (ancestral of H. elevatus), with φ contribution from parent S and 1-φ from parent T. The nodes S and T may have distinct ages and are older than node H. b, Same as model a, but constraining introgression from S into H to occur after an initial split between H. elevatus and H. pardalinus (τH<τT). Introgression is instantaneous and occurs at time τH (which is the same as τS). c, Model allowing bidirectional migration between an H. melpomene ancestor (X) into the ancestral population of H. elevatus and H. pardalinus (Y), between an H. melpomene ancestor (S) and the lineage leading to H. elevatus (H), and between the lineage leading to H. elevatus (E) and the lineage leading to H. pardalinus (P). Note that in all models, the 95% HPD intervals of the age of gene flow from H. melpomene into H. elevatus and the split between H. elevatus with H. pardalinus overlap, in line with H. elevatus being a hybrid lineage. These are highlighted in red.
Extended Data Fig. 2
Extended Data Fig. 2. MSC analysis of H. elevatus and H. pardalinus.
Species-tree phylogeny along chromosomes calculated in blocks of 100 loci using BPP (ref. ). Only the five major topologies are depicted (minor topologies are coloured in grey).
Extended Data Fig. 3
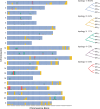
Extended Data Fig. 3. Species-diagnostic SNPs.
a, Number of species-diagnostic SNPs per chromosome. Species-diagnostic SNPs were defined as SNPs with an allelic difference of at least 0.8 between all Amazonian populations of H. elevatus and H. pardalinus. Chromosomes with at least 20 diagnostic SNPs are denoted with an asterisk (*) and shown in more detail in c. b, Triangular plot of hybrid index and observed heterozygosity, based on the 1,156 species-diagnostic SNPs, shows no evidence of early generation hybrids. c, Distribution of species-diagnostic SNPs along chromosomes in wild-caught H. elevatus and H. pardalinus. The physical location of SNPs along chromosomes (in Mb) are shown on top. Different blocks of SNPs within a chromosome, defined as groups of SNPs more than 500 kb apart, are denoted in alternating colours (black and grey). For visualization purposes, only chromosomes with at least 20 diagnostic SNPs are shown and SNP blocks were subsampled to show only one in every two SNPs. Long tracts of heterozygous genotypes (e.g. chromosome 19) suggest relatively recent hybridization followed by backcrossing.
Extended Data Fig. 4
Extended Data Fig. 4. Schematic of all demographic models tested with fastsimcoal2.
Two different tree topologies and 12 models per topology were tested. We considered the topology that retrieves both H. elevatus and H. pardalinus as monophyletic; that is, the species tree, (topology 1) and the most frequent topology across the genome (Extended Data Fig. 2), after excluding gene flow between H. elevatus and Amazonian H. pardalinus and in which H. p. sergestus is the first population to split (topology 2). The different demographic models are split into five main categories (depicted in different boxes): SI, strict isolation; AM, ancestral migration; SC, secondary contact; AM-SC, ancestral migration followed by secondary contact; IM, isolation with migration. Arrows between demes indicate gene flow (each direction being estimated as an independent parameter). Effective population sizes were allowed to change at split times. Note that for models under tree topology 1, the split times between H. elevatus populations and between H. pardalinus populations are different parameters and thus can assume different values.
Extended Data Fig. 5
Extended Data Fig. 5. Genetic evidence for current reproductive isolation between H. elevatus and H. melpomene.
a, Neighbour-joining tree based on autosomal sites sampled every 1 kb (166,989 sites). Values next to branches denote bootstrap values (based on 100 bootstrap iterations). Images of butterfly wings are copyright of the authors and Michel Cast. b, Distribution of species-diagnostic SNPs along chromosomes in wild-caught H. elevatus and H. melpomene. Species-diagnostic SNPs were defined as SNPs with an allelic difference of at least 0.8 between all Amazonian populations of H. elevatus and all H. melpomene populations. The physical location of SNPs along chromosomes (in Mb) are shown on top. For visualization purposes, SNP blocks were subsampled to show only 1 in every 20 SNPs. The lack of long tracts of heterozygous genotypes (or introgressed homozygous genotypes) suggests that there is no recent hybridization, followed by backcrossing, between these two species.
Extended Data Fig. 6
Extended Data Fig. 6. PCAs of male sex pheromones and host plant use show that H. elevatus, H. pardalinus and H. melpomene from the western Amazon form three distinct clusters in trait space.
a, PCA applied to concentrations of 30 male androconial volatiles. Loadings for selected compounds are annotated. b, PCA applied to oviposition preference of H. elevatus, H. pardalinus and H. melpomene for 21 species of Passiflora. Heliconius melpomene (24 females) laid 288 eggs and exhibited a strong preference for P. menispermifolia and P. triloba. Heliconius elevatus (35 females) laid 173 eggs and exhibited a preference for P. kaipiriensis. H. pardalinus butleri (51 females) laid 425 eggs and had a more generalized host plant use. To estimate the sample variance for each species, subsamples of 30 were drawn with replacement from the distribution of each species (1,000 replicates). PCA was then run on these bootstrapped replicates, polygons are minimum convex hulls encompassing all subsamples for each species. Images of butterfly wings are copyright of the authors and Michel Cast.
Extended Data Fig. 7
Extended Data Fig. 7. FST and genetic distances plotted against physical distance.
Physical distance is shown on the x axis; grey intervals are 1 Mb and black intervals are 5 Mb. Coloured bars show significant QTLs, with the QTL peak indicated by the triangle and the Bayesian credible intervals indicated by the length of the bar. Genetic distances are estimated using three crosses—within population (Heliconius elevatus; elev and Heliconius pardalinus; pard) and between population (F2). Candidate inversions (CIs; indicated by black arrows) are regions that recombine within species but not in hybrids (see Methods). The largest CI we identified was around 1.4 Mb long at the distal end of chromosome 16. However, we identified no CIs greater than 870 kb within the credible intervals of QTLs, and only one instance of a CI that was coincident with a QTL peak (on chromosome 15). Nonetheless, some CIs outside of QTLs present compelling targets for future investigation. Notably, at the proximal end of chromosome 19 and the distal end of chromosome 16, two large CIs overlap regions with elevated FST in which phylogenies resolve species boundaries (see Fig. 3).

Similar articles

Cited by

References

    1. Lamichhaney, S. et al. Rapid hybrid speciation in Darwin’s finches. Science359, 224–228 (2018). - PubMed
    1. Abbott, R. et al. Hybridization and speciation. J. Evol. Biol.26, 229–246 (2013). - PubMed
    1. Schumer, M., Rosenthal, G. G. & Andolfatto, P. How common is homoploid hybrid speciation? Evolution68, 1553–1560 (2014). - PubMed
    1. Lamichhaney, S. et al. Evolution of Darwin’s finches and their beaks revealed by genome sequencing. Nature518, 371–375 (2015). - PubMed
    1. Coyne, J. A. & Orr, H. A. Speciation (Sinauer Associates, 2004).

Publication types

MeSH terms