. 2024 May;629(8010):165-173.
doi: 10.1038/s41586-024-07298-z. Epub 2024 Apr 17.

Streptomyces umbrella toxin particles block hyphal growth of competing species

Affiliations

Streptomyces umbrella toxin particles block hyphal growth of competing species

Qinqin Zhao et al. Nature. 2024 May.

Abstract

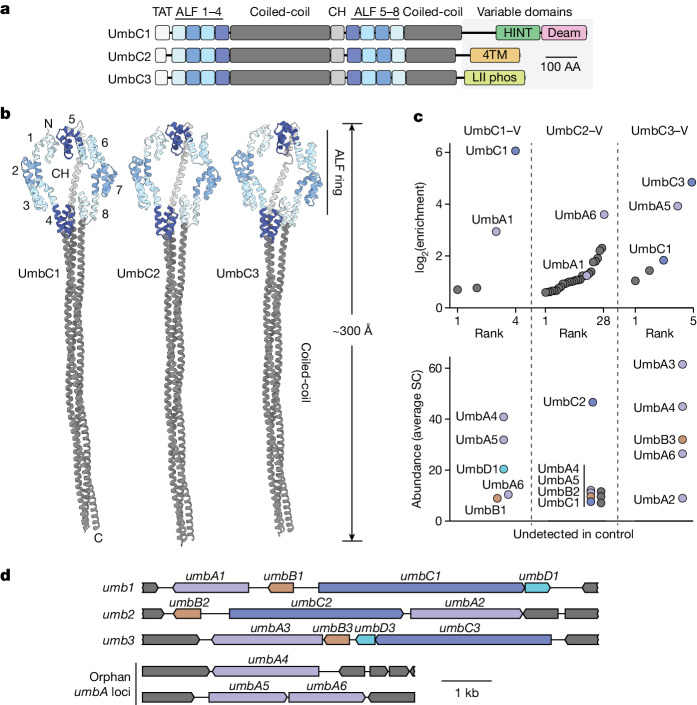
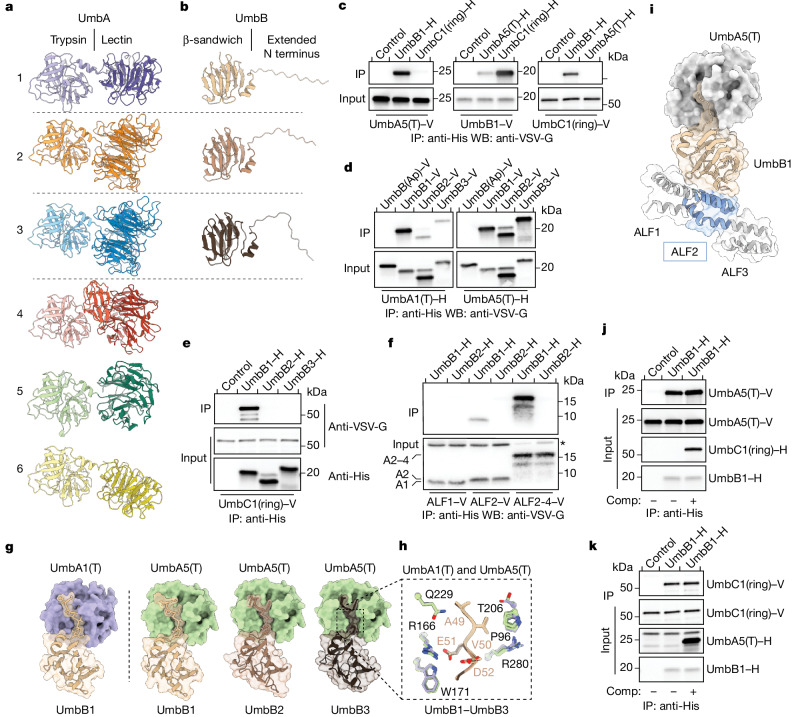
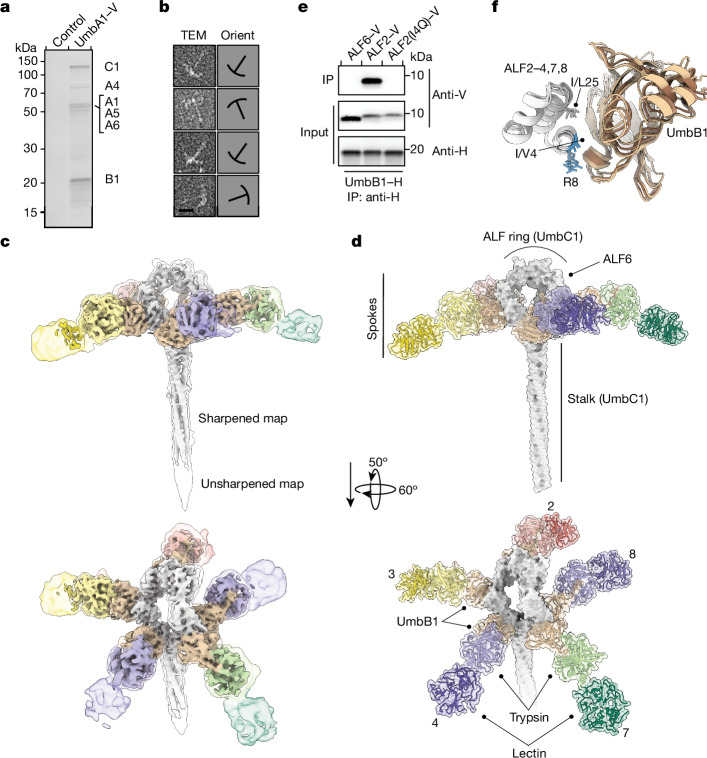
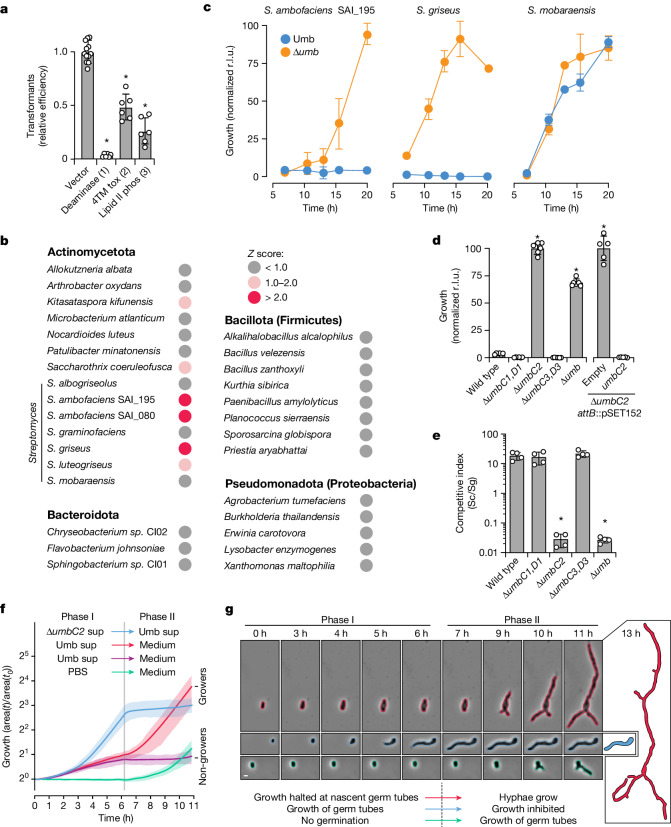
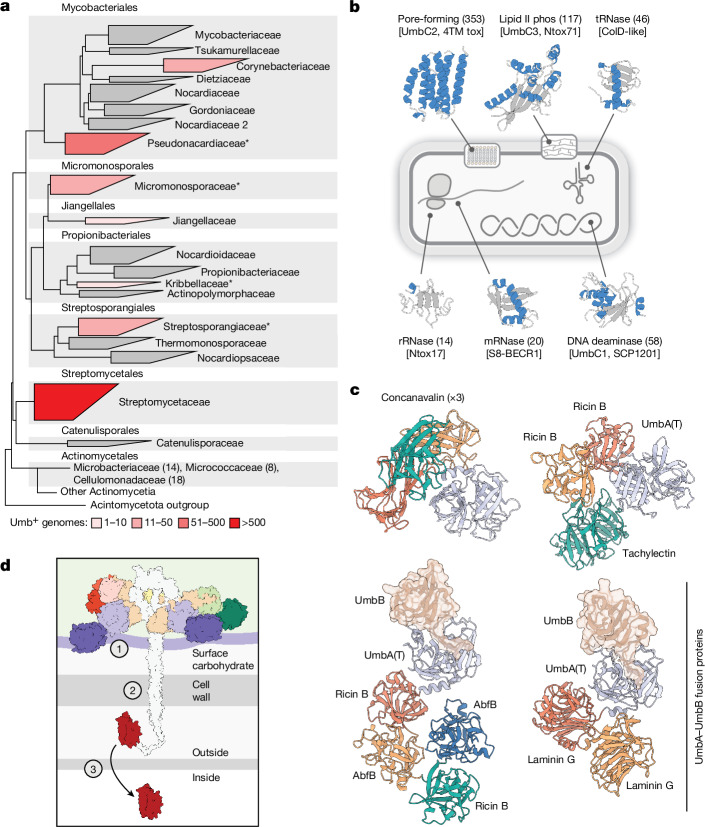
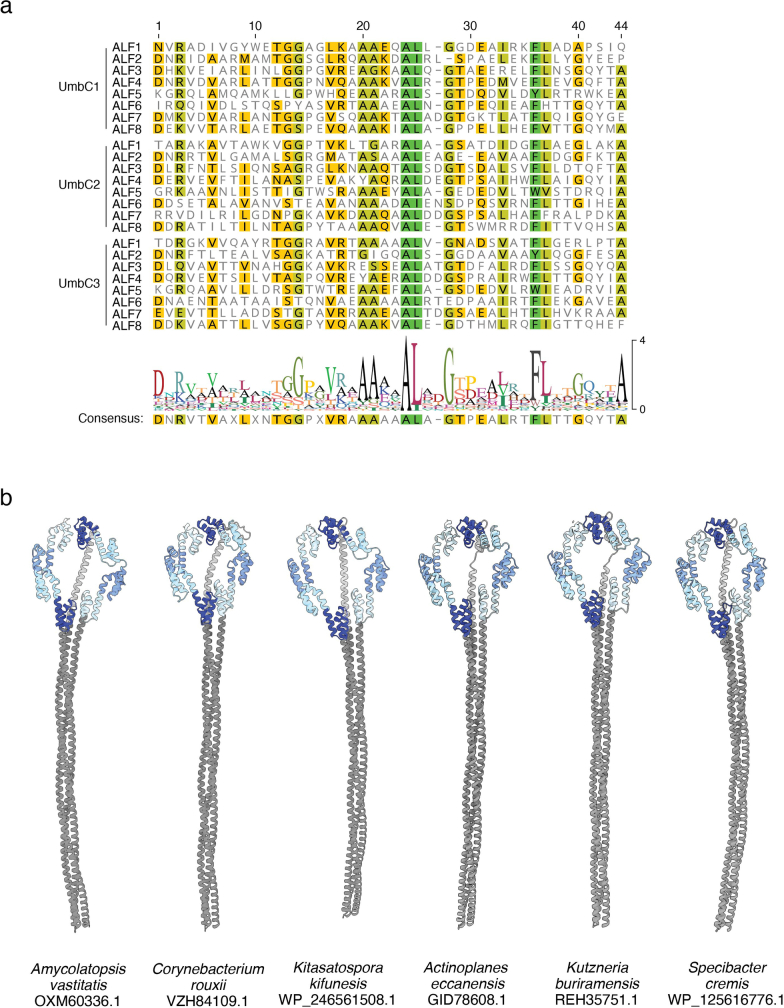
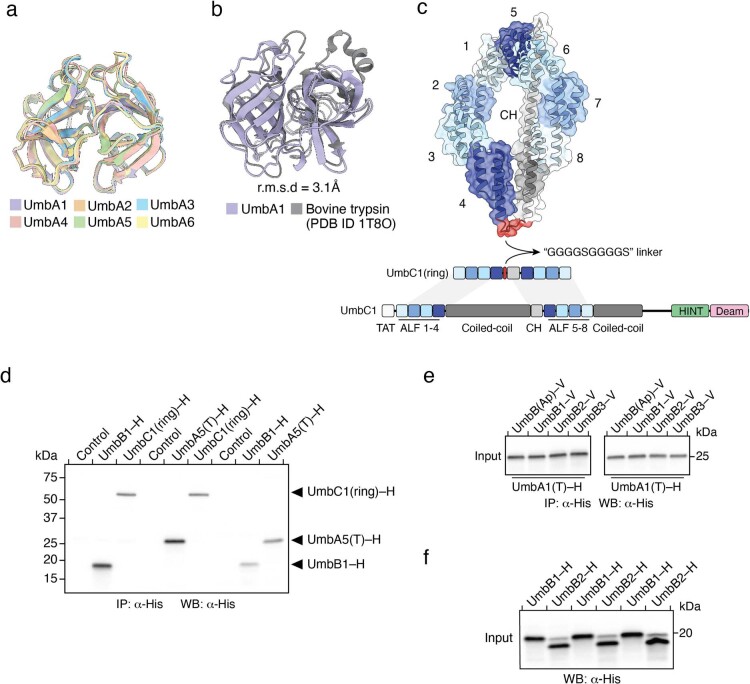
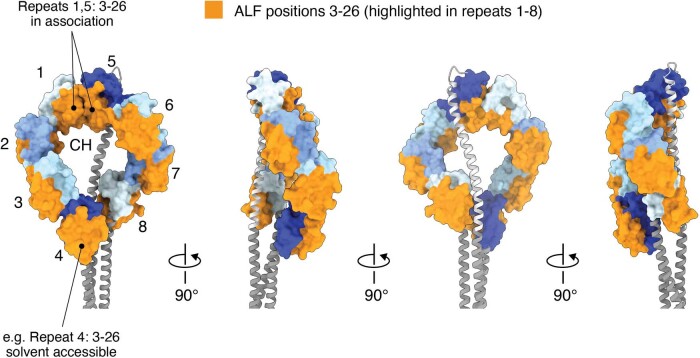
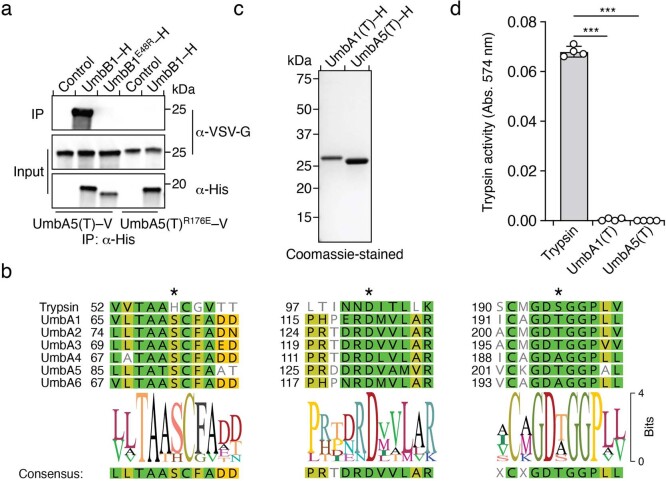
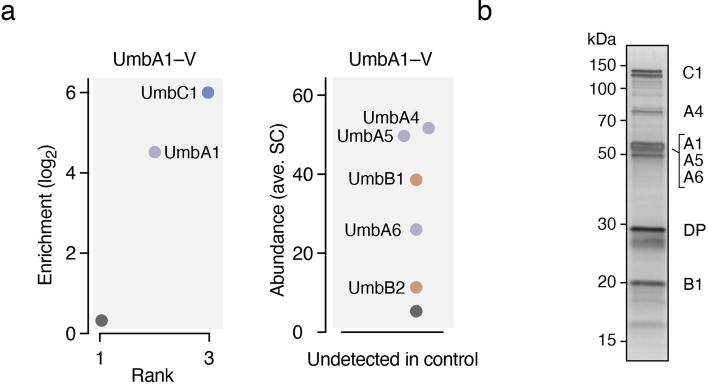
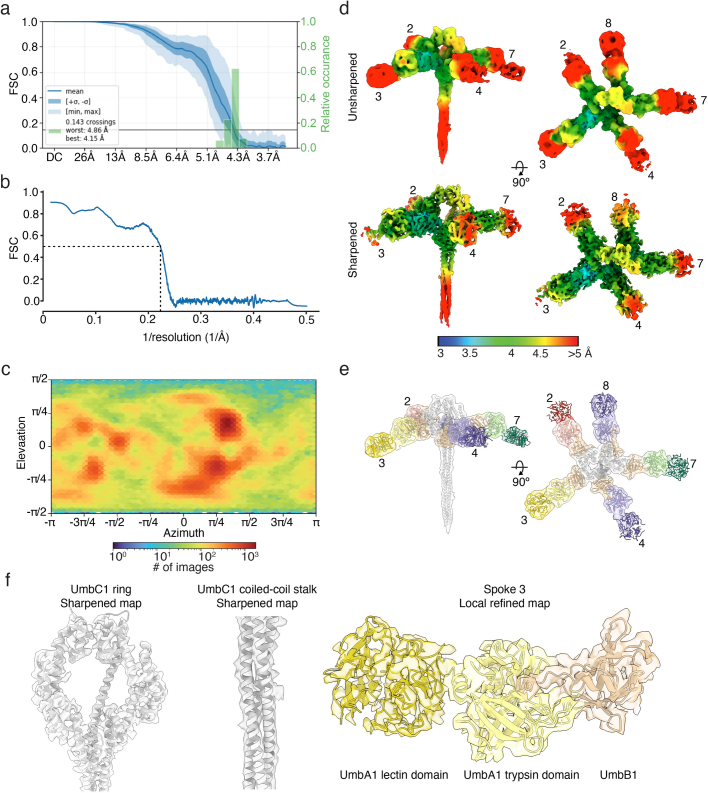
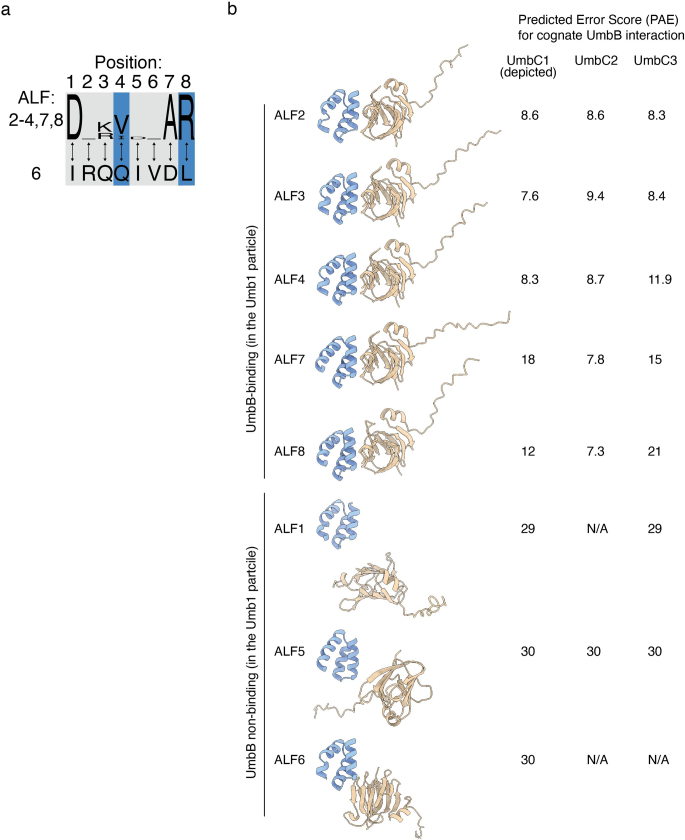
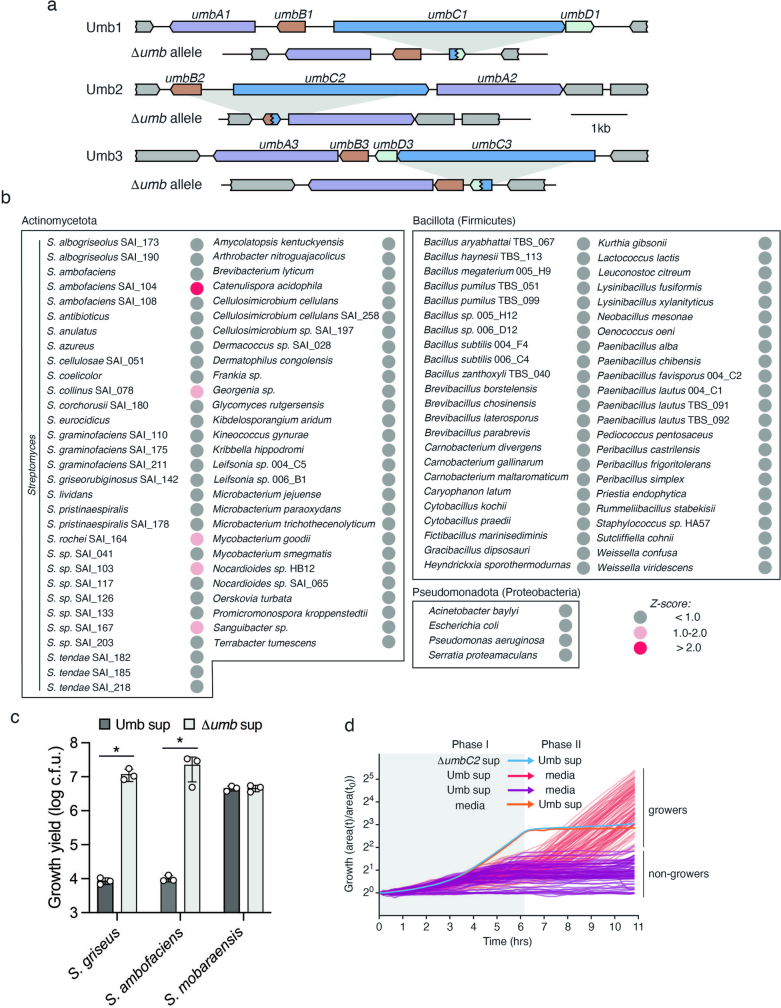
Streptomyces are a genus of ubiquitous soil bacteria from which the majority of clinically utilized antibiotics derive1. The production of these antibacterial molecules reflects the relentless competition Streptomyces engage in with other bacteria, including other Streptomyces species1,2. Here we show that in addition to small-molecule antibiotics, Streptomyces produce and secrete antibacterial protein complexes that feature a large, degenerate repeat-containing polymorphic toxin protein. A cryo-electron microscopy structure of these particles reveals an extended stalk topped by a ringed crown comprising the toxin repeats scaffolding five lectin-tipped spokes, which led us to name them umbrella particles. Streptomyces coelicolor encodes three umbrella particles with distinct toxin and lectin composition. Notably, supernatant containing these toxins specifically and potently inhibits the growth of select Streptomyces species from among a diverse collection of bacteria screened. For one target, Streptomyces griseus, inhibition relies on a single toxin and that intoxication manifests as rapid cessation of vegetative hyphal growth. Our data show that Streptomyces umbrella particles mediate competition among vegetative mycelia of related species, a function distinct from small-molecule antibiotics, which are produced at the onset of reproductive growth and act broadly3,4. Sequence analyses suggest that this role of umbrella particles extends beyond Streptomyces, as we identified umbrella loci in nearly 1,000 species across Actinobacteria.


Conflict of interest statement

The authors declare no competing interests.

Figures

Fig. 1
Fig. 1. S.coelicolor encodes three degenerate repeat-containing polymorphic toxins that interact with paralogous proteins.
a, Domain architecture of the UmbC proteins of S.coelicolor. Protein accession numbers and definitions of the variable C-terminal domains are available in Supplementary Tables 1 and 2. CH, connecting helix; Deam, deaminase; 4TM, 4TM tox; LII-phos, lipid II phosphatase, AA, amino acids. b, AlphaFold-predicted structural models of S.coelicolor UmbC proteins. UmbC1 and UmbC2 models were generated using template mode with UmbC3 as the reference. Colours correspond to a. ALF repeat numbering and location of the CH shown for UmbC1. The variable C-terminal domains, predicted to localize to the end of the stalk, could not be confidently modelled and are therefore not shown. c, IP–MS identification of proteins that interact with UmbC1, UmbC2 or UmbC3 from S.coelicolor. Top, average fold enrichment of proteins detected in both IP and control samples. Bottom, abundance (average spectral counts (SC)) for proteins detected only in IP samples. Colours indicate paralogous proteins; non-Umb proteins shown in grey. Note that additional background interacting proteins were identified for UmbC2, which we attribute to the lower abundance of this protein (46.5 SC) relative to UmbC1 (134.5 SC) and UmbC3 (781 SC) n = 2 biological replicates. V, VSV-G epitope. d, Loci encoding Umb protein complex components in S.coelicolor. Orphan umbA loci are those encoded distantly from other complex constituents. Colours consistent with c.
Fig. 2
Fig. 2. PPIs in the Umb complex.
a,b Predicted structural models for UmbA1–UmbA6 (a) and UmbB1–UmbB3 (b) of S.coelicolor. Dashed lines separate pairs of proximally encoded proteins. cf, Western blot (WB) analyses of IP experiments between the indicated heterologously expressed, tagged (hexahistidine (H) or VSV-G epitope (V)) Umb proteins. Control lanes correspond to beads in the absence of a bait protein. UmbB(Ap) is a UmbB protein from the distantly related species A.philippinensis. Bands corresponding to specific ALF repeats (ALF1 (A1), ALF2 (A2) and ALF2–ALF4 (A2–4)) and a background band (asterisk) are indicated in f. Additional input blots are provided in Extended Data Fig. 2. g,h, AlphaFold multimer-generated models for the interaction between the indicated UmbA and UmbB proteins of S.coelicolor, with surface representation highlighting the consistent predicted insertion of the N terminus of UmbB proteins into the major cleft of UmbA trypsin domains. Additional predicted N-terminal disordered residues of UmbB1–UmbB3 are removed for clarity. Inset in h depicts strictly conserved residues in UmbA and UmbB in proximity to the modelled interaction interface. Side chains coloured as in g, and numbering corresponds to positions in UmbA5 and UmbB3. i, Ternary complex combining AlphaFold multimer models of UmbB1–UmbA5(T) and UmbB1–ALF2 of UmbC1. Flanking ALF repeats in UmbC1 (grey) are shown for context. j,k, WB analyses of competitive binding experiments between UmbB1 and its partners UmbA5(T) and UmbC1(ring). Purified competitor (Comp) UmbC1(ring)–H (j) or UmbA5(T)–H (k) were added in excess to IP experiments involving UmbB1 and UmbA5(T) or UmbC1(ring), respectively. Uncropped blots are provided in Supplementary Fig. 1.
Fig. 3
Fig. 3. Structure of the Umb1 particle.
a, Silver-stained SDS–PAGE analysis of the Umb1 protein complex precipitated from cultures of S.coelicolor with chromosomally encoded UmbA1–V. Control represents the equivalent precipitation from wild-type S.coelicolor. Experiment shown is representative of three independent replicates. b, Transmission EM analyses of negative-stained, purified Umb1 particles. Outlines indicating particle orientation (Orient) are shown on the right. Complete micrographs are provided in Supplementary Fig. 2a. c, Cryo-EM maps of the Umb1 particle at 4.3 Å unsharpened (transparent, 0.43 binarization threshold) and sharpened (opaque, 1.16). Maps are coloured based on model subunit proximity. Regions encompassing UmbB1 and UmbC1 are coloured as in Fig. 2, and regions encompassing UmbA1 are coloured differently in each spoke to highlight the complement of UmbA proteins that associate with the Umb1 particle. d, Depiction of the Umb1 particle. The depiction represents the model derived from our cryo-EM data, with the exception that the lectin domains present in spokes 2, 4 and 7 are shown but were not included in the deposited model owing to their weak density. The C-terminal domains of UmbC1 were not resolved in our structure and are not included in the depiction. Spoke numbers correspond to the interacting ALF repeat of UmbC1. ALF1, ALF5 and ALF6 (indicated) do not interact with UmbB1. e, WB analysis of IP experiments between UmbB1 and the indicated native and variant ALF repeats. Protein tags are indicated. f, Superimposition of UmbB1-binding ALF repeats (white) in complex with their corresponding UmbB1 protomer (brown shades) extracted from the Umb1 particle model. Conserved residues at the ALF–UmbB1 interface are shown, with several side chains truncated at Cβ as in the model. Those not conserved in ALF6 are coloured blue.
Fig. 4
Fig. 4. Umb particles selectively inhibit vegetative hyphal growth of Streptomyces spp.
a, Staphylococcus aureus transformation efficiency of plasmids expressing UmbC toxin domains (1–3) relative to a vector control. Data represent the mean ± s.d. (n = 6 (experimental) or 12 (control)). b, Subset of Umb toxin susceptibility screening results. Z scores calculated from relative growth in the presence or absence of Umb toxins from two biological replicates of the screen; scores >2 indicate significant Umb-dependent inhibition. Additional strains screened shown in Extended Data Fig. 9b, and raw data provided in Supplementary Table 5. c, Growth of the indicated target and non-target strains treated with Umb or Δumb supernatant (10% (v/v), measured as relative luminescence units (r.l.u.)). Colony-forming units quantified at 16 h available in Extended Data Fig. 9c. d, Growth yields of S.griseus after 16 h of treatment with S.coelicolor Umb supernatant from the indicated strains. e, Outcome of growth competition assays between the indicated strains of S. coelicolor (Sc) and S. griseus (Sg). Data in d and e represent the mean ± s.d. (n = 3). f, Single-cell-based microscopy analysis of S.griseus growth as determined by cell area during exposure to the indicated treatments in a microfluidic flow cell. Phase I Umb supernatant-treated (sup) cells fell into two classes: those that resumed growth in toxin-free medium (growers) and those that did not (non-growers). Data for individual cells provided in Extended Data Fig. 9d and Supplementary Video 1. Shading indicates interquartile ranges. Red, n = 101; blue, n = 77; purple, n = 68; green, n = 78. g, Micrographs of representative cells from the indicated treatment groups in f outlined with Omnipose-generated segmentation masks. At 13 h, cell masks for two treatment groups are presented. Data shown in f and g are from one biological replicate representative of three. Scale bar, 2 μM. Asterisks indicate treatments significantly different from controls. P < 0.0001 (a,d) or P = 0.0003 (e), analysis of variance with Dunnett’s multiple comparisons test, two-sided. Source Data
Fig. 5
Fig. 5. Phylogenetic distribution and functional diversity of Umb proteins.
a, Phylogenetic tree of orders and families within Actinomycetia, coloured to indicate the number of genomes positive for Umb toxin particle loci. Within Actinomycetales, only those families containing umb loci are listed, with the number of umb-containing genomes in parentheses. Asterisks indicate families for which representative umb loci are shown in Supplementary Fig. 5. The width of boxes for each family is proportional to the number of species it contains. b, Schematic indicating the predicted molecular targets of select toxin domains commonly found in UmbC proteins and representative models for the domains generated using AlphaFold. Models coloured by secondary structure (blue, α-helices; grey, loops and β-strands). Numbers in parentheses indicate the number of UmbC proteins we detected carrying the indicated toxin domain. Toxin family names are provided in brackets and in Supplementary Table 2. c, Predicted structural models of example UmbA proteins selected by virtue of containing multiple distinct or repeated lectin domains (top) or fusions between UmbA and UmbB proteins (bottom). The UmbB domains of bifunctional UmbAB proteins are shown in transparent surface representation and in the same orientation to highlight their conserved interaction with the major cleft of the trypsin-like domain. Concanavalin, UAL-Con-1; Ricin B, Ricin_B_Lectin (Supplementary Table 4). d, Model for the intoxication of target cells by Umb toxins, with outstanding questions highlighted. These include the identity of receptor (or receptors) on target cells and the involvement of the lectin domains in mediating binding (1), the role of the stalk in toxin delivery (2) and the mechanism of toxin translocation into target cells (3).
Extended Data Fig. 1
Extended Data Fig. 1. Degenerate nature of ALF repeat sequences and example UmbC structural models with straight coiled-coil domains.
a, Alignment of ALF repeats 1-8 from each UmbC protein of S. coelicolor. The minimum ALF repeat unit was selected based on the structural model. b, Predicted structural models of assorted UmbC proteins, obtained using default AlphaFold parameters and without templating.
Extended Data Fig. 2
Extended Data Fig. 2. UmbA proteins contain a conserved trypsin-like domain, and construct design and input protein levels for studies of the interactions between proteins in the Umb complex.
a, Alignment of the trypsin-like domain of the UmbA proteins of S. coelicolor. b, Alignment of UmbA1(T) and bovine trypsin. c, Predicted structure and genetic architecture of our construct for the expression of UmbC1(ring). d-f, WB analyses of input samples from IP experiments between the indicated heterologously expressed, tagged (–H, hexahistidine; –V, VSV-G epitope) Umb proteins. Control lanes correspond to beads in the absence of a bait protein. UmbB(Ap) is a UmbB protein from the distantly related species Actinoplanes philippinensis.
Extended Data Fig. 3
Extended Data Fig. 3. ALF repeats 1 and 5 exhibit a distinct orientation.
Orange colouring indicates the residues of the ALF repeats of UmbC1 that are exposed to the surface in repeats predicted to interact with UmbB1 in structural models (ALF 2,3, 4-8). In repeats 1 and 5, many of the equivalent residues are buried in the interface between the ALF repeats.
Extended Data Fig. 4
Extended Data Fig. 4. The trypsin-like domain of UmbA proteins mediates binding with UmbB and lacks catalytic activity.
a, WB analysis from IP experiments of the indicated heterologously expressed, tagged Umb proteins. UmB1E48R–H and UmbA5(T)R176E–V contain substitutions of residues predicted to be critical for interaction between the two proteins. Experiment shown is representative of two independent replicates. b, Structure-guided alignments of the UmbA(T) regions normally encompassing the catalytic histidine, aspartate, serine triad typical of trypsin proteins, indicating the conserved substitutions found across the UmbA proteins of S. coelicolor. c, d, Coomassie-stained SDS-PAGE analysis (c) and proteolytic activity (d) of purified, heterologously expressed UmbA1(T) and UmbA5(T). Data in (d) represent mean ± SD (n = 4 technical replicates from one experiment, representative of two biological replicates conducted). Asterisks indicate significant differences from the positive control, porcine trypsin (p < 0.0001, two-tailed t-test). Source Data
Extended Data Fig. 5
Extended Data Fig. 5. Purification of the Umb1 complex using epitope-tagged UmbA1.
a, IP-MS identification of proteins that interact with UmbA1-VSV-G. Left panel indicates the average fold enrichment of proteins detected in both IP and control samples; right panel presents abundance (average spectral counts, SC) for proteins detected only in IP samples. Colours indicate paralogous proteins and correspond to Fig. 2; non-Umb proteins shown in grey, (n = 2 independent experiments). b, Silver-stained SDS-PAGE analysis of the Umb1 particle preparation employed in structural analysis, purified using UmbA1–8xHis, with bands corresponding to individual Umb1 proteins identified. DP, degradation product. The experiment is representative of >5 independent replicates.
Extended Data Fig. 6
Extended Data Fig. 6. Cryo-EM based structural characterization of the Umb1 particle.
a, FSC curve with a cutoff at 0.143 for the overall Umb1 map with the 3DFSC analysis of the full particle. b, Map to model FSC curve for the final Umb1 model (in which the lectin domains of UmbA for spokes 2, 4 and 7 were not modeled due to weak density) refined against the Umb1 overall map. c, Particle distribution and local resolution of the overall Umb1 map. d, Local resolution of the unsharpened (top, threshold of 0.43) and sharpened (bottom, threshold of 1.16) Umb1 cryo-EM map. Numbers correspond to the interacting ALF repeat for each spoke. e, The final model within the unsharpened map of the Umb1 particle at a threshold of 0.43. The depiction represents the model derived from our cryo-EM data, with the exception that the lectin domains present in spokes 2, 4, and 7 are shown but were not included in the deposited model due to their weak density. f. Close up views of the density corresponding to the UmbC1 ring (threshold of 1.61, sharpened map), UmbC1 stalk (threshold of 1.16, sharpened map), and a single spoke of UmbB1 and UmbA1 (spoke 3, threshold of 1.16, local refined map).
Extended Data Fig. 7
Extended Data Fig. 7. Structure and sequence-based differentiation of UmbB-interacting and non-interaction ALF repeats.
a, Probability sequence logo generated from an alignment of positions 1-8 of the UmbB1-interacting ALF repeats of UmbC1, compared to the analogous positions in AFL6. Positions located at the interaction interface and which have non-conservative substitutions in ALF6 are highlighted in blue. b, Predicted structural models for the interaction between each ALF repeat of UmbC1 with UmbB1, and RoseTTAFold2 predicted error scores (PAE) calculated for models of the ALF repeats of each S. coelicolor UmbC protein interacting with its cognate UmbB. PAE values: <10, high confidence; <20, moderate confidence; >20, low confidence. N/A, no interaction predicted.
Extended Data Fig. 8
Extended Data Fig. 8. The toxin domain of UmbC1 exhibits mutagenic cytosine deaminase activity.
a,b, Representation of single-nucleotide variants (SNVs) by chromosomal position, frequency, and density in E. coli Δung following 60 min induction of expression of the deaminase toxin domain from UmbC1 (a), or the equivalently-treated vector control strain (b). c, Frequency of the indicated substitutions among the SNVs shown in (a). d, Probability sequence logo of the region flanking mutated cytosines among the SNVs shown in (a).
Extended Data Fig. 9
Extended Data Fig. 9. Screen of diverse soil bacteria to identify targets of the Umb toxins of S. coelicolor.
a, Genetic loci schematic indicating deletions present in S. coelicolor Δumb. b, Umb toxin target screening results for strains not depicted in Fig. 4b, grouped by target strain phylum. Z-scores were calculated as in Fig. 4b; scores >2 indicate significant Umb-dependent inhibition. c, Growth yields (c.f.u, colony forming units) determined of the indicated strains grown in Umb or Δumb supernatant for 16 hr. Data represent means ± SD (n = 3). Asterisks indicate significant differences between the indicated treatments (p < 0.0001 for S. griseus, p = 0.0003 for S. ambofaciens, two-tailed t-test of log transformed data). d, Growth trajectories of individual S. griseus cells treated with Umb supernatant. After exchange of Umb supernatant with fresh medium, a portion of the population resumes growth (growers) while other treated cells remain arrested (non-growers). Average growth of ΔumbC2 supernatant or media-treated populations switched to Umb supernatant treatment in Phase II shown for comparison. Source Data

Similar articles

Cited by

References

    1. Alam K, et al. Streptomyces: the biofactory of secondary metabolites. Front. Microbiol. 2022;13:968053. doi: 10.3389/fmicb.2022.968053. - DOI - PMC - PubMed
    1. Kinkel LL, Schlatter DC, Xiao K, Baines AD. Sympatric inhibition and niche differentiation suggest alternative coevolutionary trajectories among Streptomycetes. ISME J. 2014;8:249–256. doi: 10.1038/ismej.2013.175. - DOI - PMC - PubMed
    1. Barka EA, et al. Taxonomy, physiology, and natural products of Actinobacteria. Microbiol. Mol. Biol. Rev. 2016;80:1–43. doi: 10.1128/MMBR.00019-15. - DOI - PMC - PubMed
    1. McCormick JR, Flardh K. Signals and regulators that govern Streptomyces development. FEMS Microbiol. Rev. 2012;36:206–231. doi: 10.1111/j.1574-6976.2011.00317.x. - DOI - PMC - PubMed
    1. Anthony MA, Bender SF, van der Heijden MGA. Enumerating soil biodiversity. Proc. Natl Acad. Sci. USA. 2023;120:e2304663120. doi: 10.1073/pnas.2304663120. - DOI - PMC - PubMed

Publication types

MeSH terms

LinkOut - more resources