. 2024 May;629(8012):624-629.
doi: 10.1038/s41586-024-07316-0. Epub 2024 Apr 17.

Refining the impact of genetic evidence on clinical success

Affiliations

Refining the impact of genetic evidence on clinical success

Eric Vallabh Minikel et al. Nature. 2024 May.

Abstract

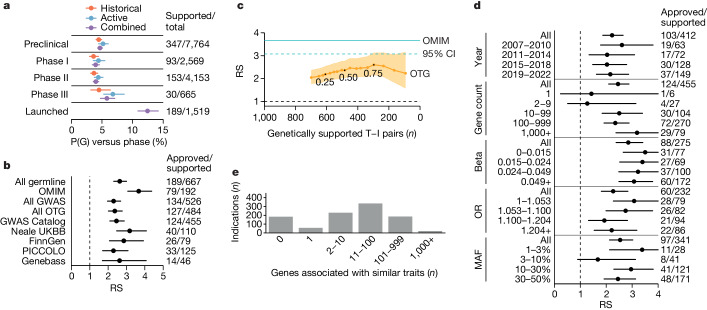
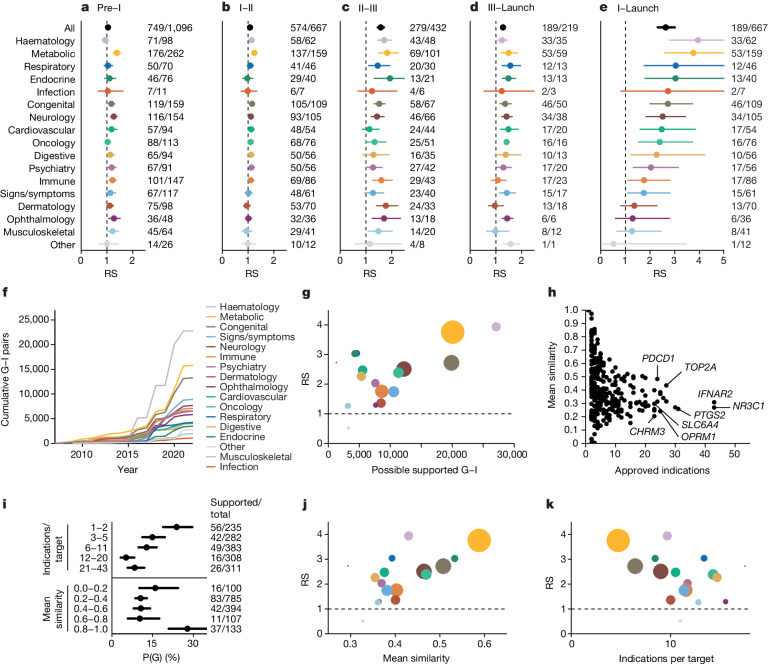
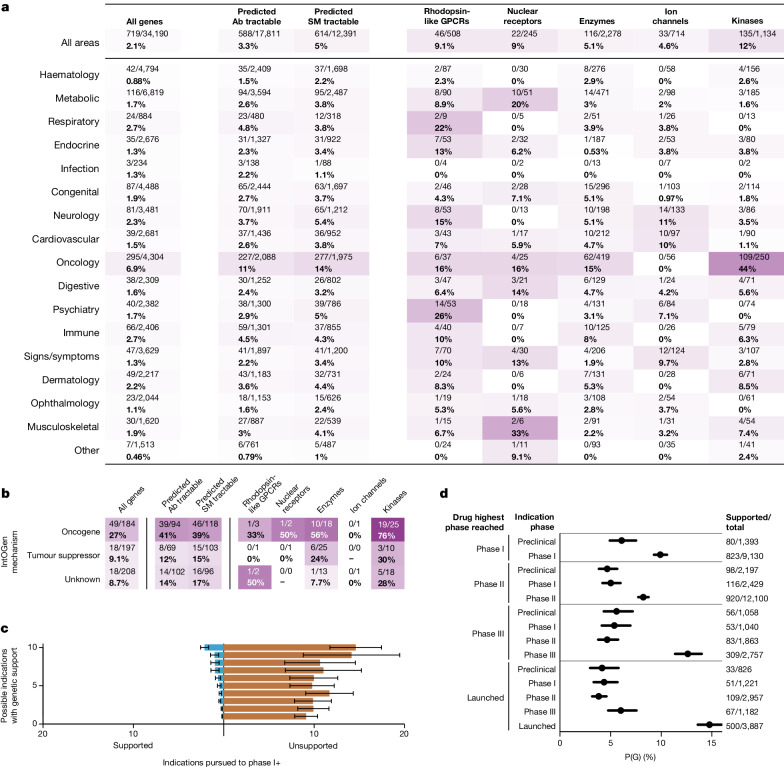
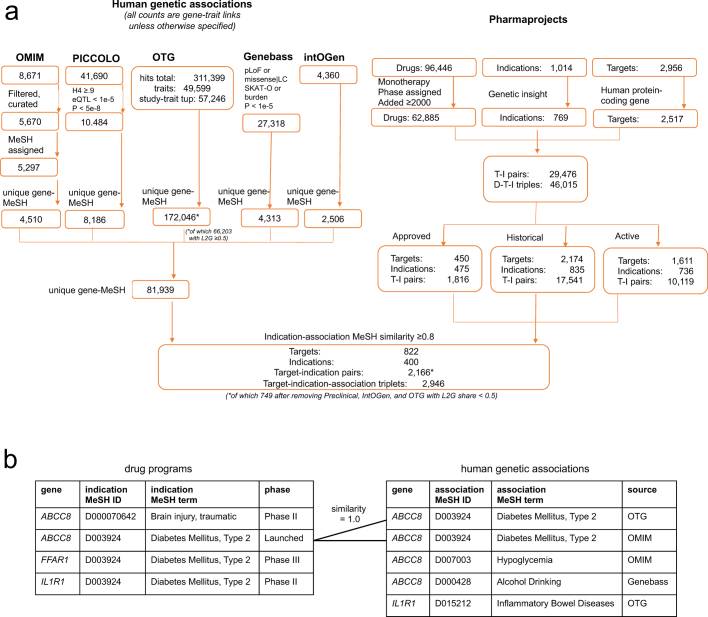
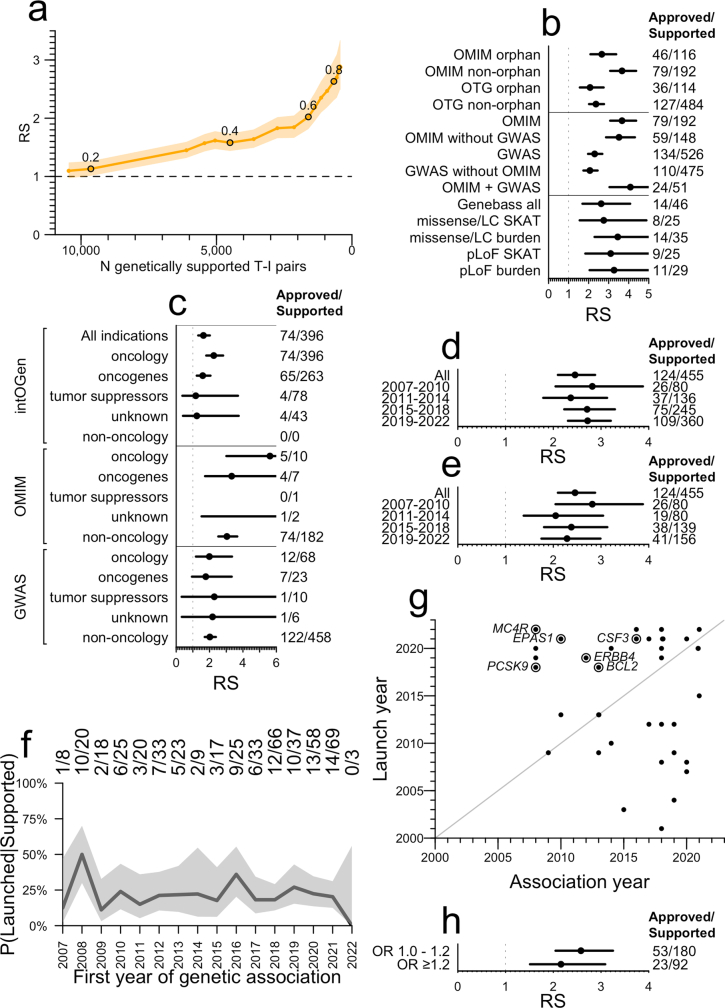
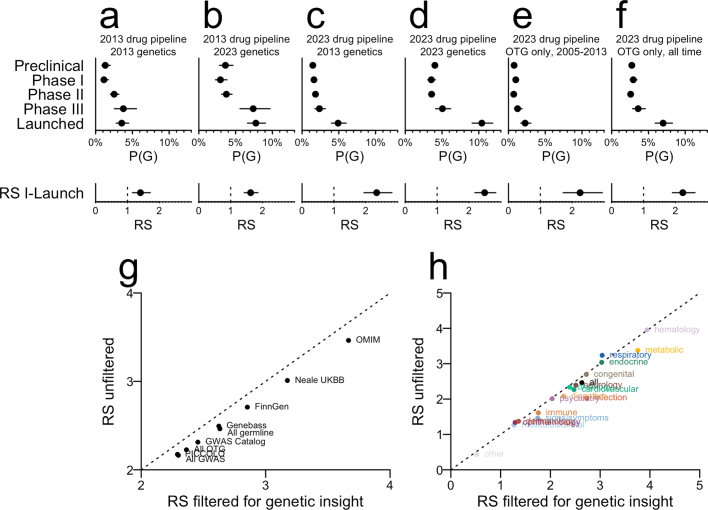
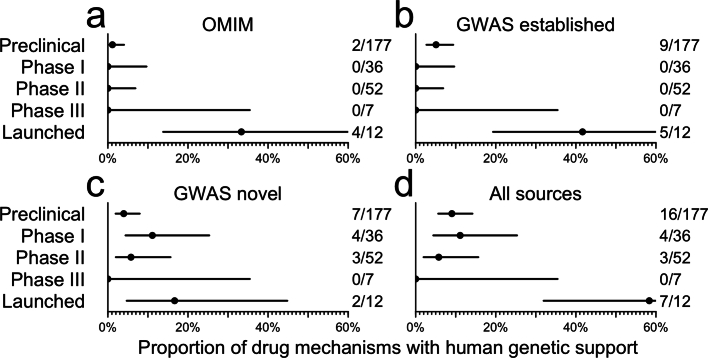
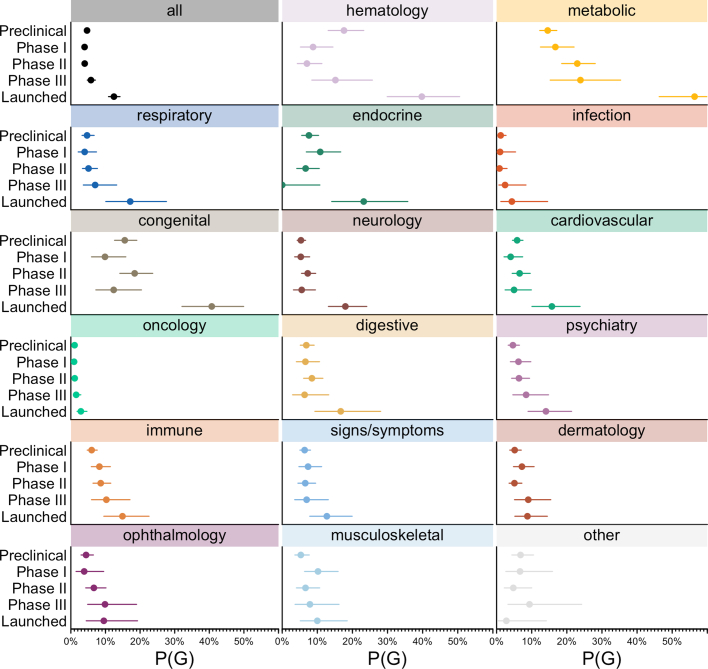
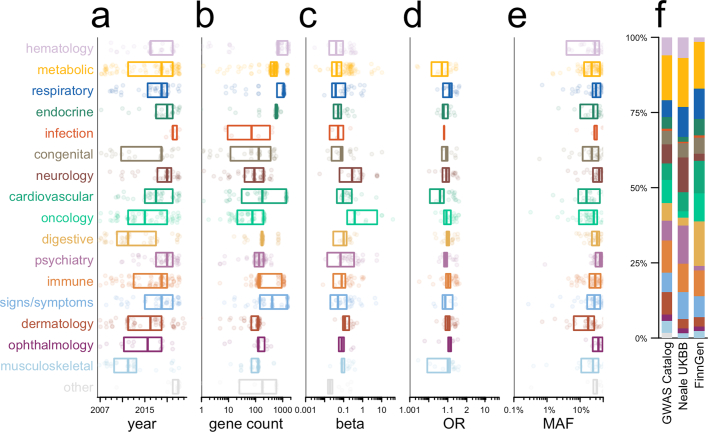
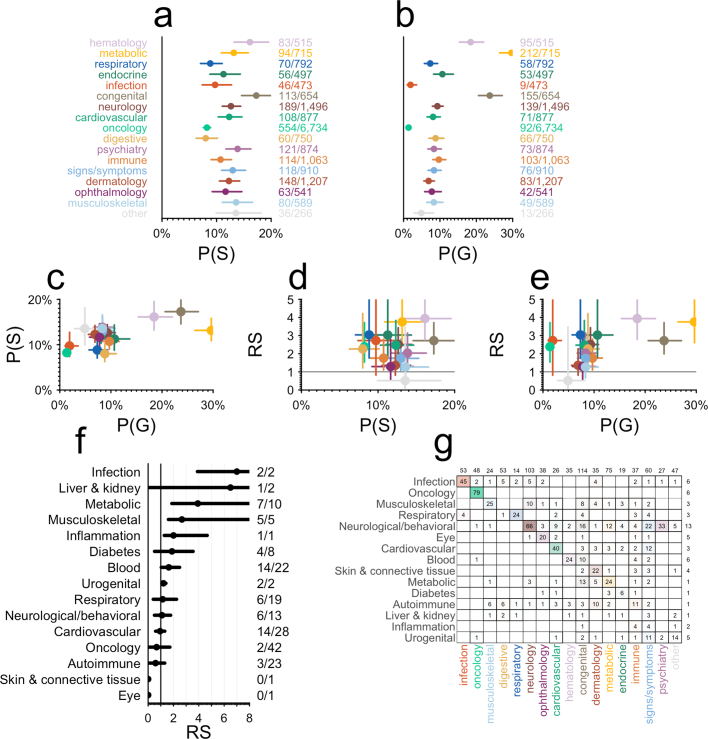
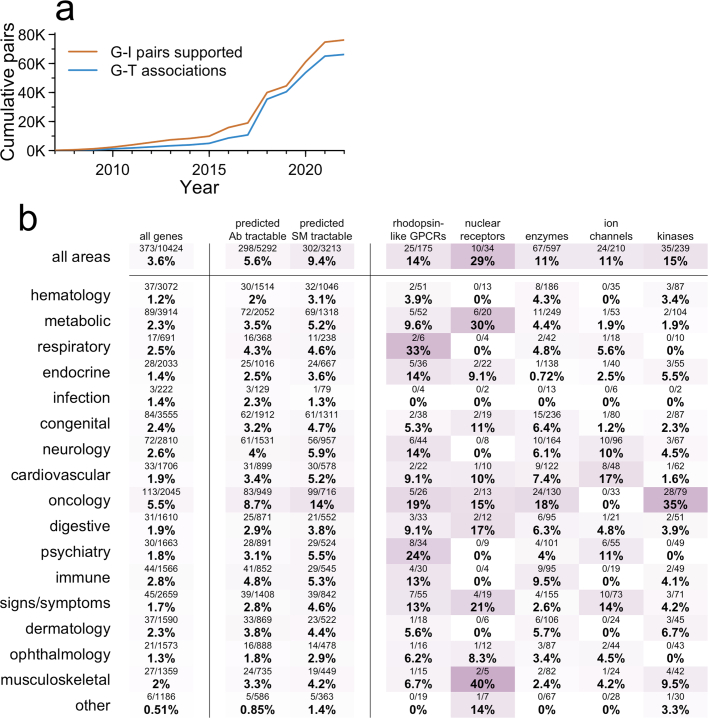
The cost of drug discovery and development is driven primarily by failure1, with only about 10% of clinical programmes eventually receiving approval2-4. We previously estimated that human genetic evidence doubles the success rate from clinical development to approval5. In this study we leverage the growth in genetic evidence over the past decade to better understand the characteristics that distinguish clinical success and failure. We estimate the probability of success for drug mechanisms with genetic support is 2.6 times greater than those without. This relative success varies among therapy areas and development phases, and improves with increasing confidence in the causal gene, but is largely unaffected by genetic effect size, minor allele frequency or year of discovery. These results indicate we are far from reaching peak genetic insights to aid the discovery of targets for more effective drugs.


Conflict of interest statement

M.R.N. is an employee of Deerfield and Genscience. C.C.D. is an employee of Deerfield. E.V.M. and J.L.P. are consultants to Deerfield. Unrelated to the current work, E.V.M. acknowledges speaking fees from Eli Lilly, consulting fees from Alnylam and research support from Ionis, Gate, Sangamo and Eli Lilly.

Figures

Fig. 1
Fig. 1. Impact of genetic evidence characteristics on RS.
a, Proportion of T–I pairs with genetic support, P(G), as a function of highest phase reached. n at right: denominator, number of T–I pairs per phase; numerator, number that are genetically supported. b, Sensitivity of phase I–launch RS to source of human genetic association. GWAS Catalog, Neale UKBB and FinnGen are subsets of OTG. n at right: denominator, number of T–I pairs with genetic support from each source; numerator, number of those launched. Note that RS is calculated from a 2 × 2 contingency table (Methods). Total n = 13,022 T–I pairs. c, Sensitivity of RS to L2G share threshold among OTG associations. Minimum L2G share threshold is varied from 0.1 to 1.0 in increments of 0.05 (labels); RS (y axis) is plotted against the number of clinical (phase I+) programmes with genetic support from OTG (x axis). d, Sensitivity of RS for OTG GWAS-supported T–I pairs to binned variables: (1) year that T–I pair first acquired human genetic support from GWASs, excluding replications and excluding T–I pairs otherwise supported by OMIM; (2) number of genes exhibiting genetic association to the same trait; (3) quartile of effect size (beta) for quantitative traits; (4) quartile of effect size (odds ratio, OR) for case/control traits standardized to be >1 (that is, 1/OR if <1); (5) order of magnitude of minor allele frequency bins. n at right as in b. Total n = 13,022 T–I pairs. e, Count of indications ever developed in Pharmaprojects (y axis) by the number of genes associated with traits similar to those indications (x axis). Throughout, error bars or shaded areas represent 95% CIs (Wilson for P(G) and Katz for RS) whereas centres represent point estimates. See Supplementary Fig. 1 for the same analyses restricted to drugs with a single known target. Source Data
Fig. 2
Fig. 2. Differences in RS between therapy areas and the number and diversity of indications per target.
ae, RS by therapy area and phase transitions: preclinical to phase I (a), phase I to II (b), phase II to III (c), phase III to launch (d) and phase I to launch (e). n at right: denominator, T–I pairs with genetic support; numerator, number of those that succeeded in the phase transition indicated at the top of the panel. For ‘all’, total n = 22,638 preclinical, 13,022 reaching at least phase I, 7,223 reaching at least phase II and 2,184 reaching at least phase III. Total n for each therapy area is provided in Supplementary Table 27. f, Cumulative number of possible genetically supported G–I pairs in each therapy (y axis) as genetic discoveries have accrued over time (x axis). g, RS (y axis) by number of possible supported G–I pairs (x axis) across therapy areas, with dots coloured as in panels ae and sized according to number of genetically supported T–I pairs in at least phase I. h, Number of launched indications versus similarity of those indications, by approved drug target. i, Proportion of launched T–I pairs with genetic support, P(G), binned by quintile of the number of launched indications per target (top panel) or by mean similarity among launched indications (bottom panel). Targets with exactly 1 launched indication (6.2% of launched T–I pairs) are considered to have mean similarity of 1.0. n at right: denominator, total number of launched T–I pairs in each bin; numerator, number of those with genetic support. j, RS (y axis) versus mean similarity among launched indications per target (x axis) by therapy area. k, RS (y axis) versus mean count of launched indications per target (x axis). Throughout, error bars or shaded areas represent 95% CIs (Wilson for P(G) and Katz for RS) whereas centres represent point estimates. See Supplementary Fig. 2 for the same analyses restricted to drugs with a single known target. Source Data
Fig. 3
Fig. 3. Clinical investigation of drug mechanisms with genetic evidence.
a, Heatmap of proportion of genetically supported T–I pairs that have been developed to at least phase I, by therapy area (y axis) and gene list (x axis). b, As panel a, but for genetic support from IntOGen rather than germline sources and grouped by the direction of effect of the gene according to IntOGen (y axis), and also grouped by target rather than T–I pair. Thus, the denominator for each cell is the number of targets with at least one genetically supported indication, and each target counts towards the numerator if at least one genetically supported indication has reached phase I. c, Of targets that have reached phase I for any indication, and have at least one genetically supported indication, the mean count (x axis) of genetically supported (left) and unsupported (right) indications pursued, binned by the number of possible genetically supported indications (y axis). The centre is the mean and bars are Wilson 95% CIs. n = 1,147 targets. d, Proportion of D–I pairs with genetic support, P(G) (x axis), as a function of each D–I pair’s phase reached (inner y-axis grouping) and the drug’s highest phase reached for any indication (outer y-axis grouping). The centre is the exact proportion and bars are Wilson 95% CIs. The n is indicated at the right, for which the denominator is the total number of D–I pairs in each bin, and the numerator is the number of those that are genetically supported. See Supplementary Fig. 3 for the same analyses restricted to drugs with a single known target. Ab, antibody; SM, small molecule. Source Data
Extended Data Fig. 1
Extended Data Fig. 1. Data processing schematic.
A) Dataset size, filters, and join process for Pharmaprojects and human genetic evidence. Note that a drug can be assigned multiple targets, and can be approved for multiple indications. The entire analysis described herein has also been run restricted to only those drugs with exactly one target annotated (Figs. S1–S11). B) Illustration of the definition of genetic support. A table of drug development programs with one row per target-indication pair (left) is joined to a table of human genetic associations based on the identity of the gene encoding the drug target and the similarity between the drug indication MeSH term and the genetically associated trait MeSH term being ≥ 0.8. Drug program rows with a joined row in the genetic associations table are considered to have genetic support.
Extended Data Fig. 2
Extended Data Fig. 2. Further analysis of influence of characteristics of genetic associations on relative success.
A) Sensitivity of RS to the similarity threshold between the MeSH ID for the genetically associated trait and the MeSH ID for the clinically developed indication. The threshold is varied by units of 0.05 (labels) and the results are plotted as RS (y axis) versus number of genetically supported T-I pairs (x axis). B) Breakdown of OTG and OMIM RS values by whether any drug for each T-I pair has had orphan status assigned. The N of genetically supported T-I pairs (denominator) and, of those, launched T-I pairs (numerator) is shown at right. Values for the full 2×2 contingency table including the non-supported pairs, used to calculate RS, are provided in Table S12. Total N = 13,022 T-I pairs, of which 3,149 are orphan. The center is the RS point estimate and error bars are Katz 95% confidence intervals. C) RS for somatic genetic evidence from IntOGen versus germline genetic evidence, for oncology and non-oncology indications. Note that the approved/supported proportions displayed for the top two rows are identical because all IntOGen genetic support is for oncology indications, yet the RS is different because the number of non-supported approved and non-supported clinical stage programs is different. In other words, in the “All indications” row, there is a Simpson’s paradox that diminishes the apparent RS of IntOGen — IntOGen support improves success rate (see 2nd row) but also selects for oncology, an area with low baseline success rate (as shown in Extended Data Fig. 6a). N is displayed at right as in (B), with full contingency tables in Table S13. Total N = 13,022 T-I pairs, of which 6,842 non-oncology, 6,180 oncology, 1,287 targeting IntOGen oncogenes, 284 targeting tumor suppressors, and 176 targeting IntOGen genes of unknown mechanism. The center is the RS point estimate and error bars are Katz 95% confidence intervals. D) As for top panel of Fig. 1d, but without removing replications or OMIM-supported T-I pairs. N is displayed as in (B), with full contingency tables in Table S14. Total N = 13,022 T-I pairs. The center is the RS point estimate and error bars are Katz 95% confidence intervals. E) As for top panel of Fig. 1d, removing replications but not removing OMIM-supported T-I pairs. N is displayed as in (B), with full contingency tables in Table S15. Total N = 13,022 T-I pairs. The center is the RS point estimate and error bars are Katz 95% confidence intervals. F) Proportion of T-I pairs supported by a GWAS Catalog association that are launched (versus phase I-III) as a function of the year of first genetic association. G) Launched T-I pairs genetically supported by OTG GWAS, shown by year of launch (y axis) and year of first genetic association (x axis). Gene symbols are labeled for first approvals of targets with at least 5 years between association and launch. Of 104 OTG-supported launched T-I pairs (Fig. 1d), year of drug launch was available for N = 38 shown here, of which 18 (47%) acquired genetic support only in or after the year of launch. The true proportion of launched T-I whose GWAS support is retrospective may be larger if the T-I with a missing launch year are more often older drug approvals less well annotated in Pharmaprojects. H) Lack of impact of GWAS Catalog lead SNP odds ratio (OR) on RS when using the same OR breaks as used by King et al.. N is displayed as in (B), with full contingency tables in Table S18. Total N = 13,022 T-I pairs. The center is the RS point estimate and error bars are Katz 95% confidence intervals. See Fig. S4 for the same analyses restricted to drugs with a single known target. Source Data
Extended Data Fig. 3
Extended Data Fig. 3. Sensitivity to changes in genetic data and drug pipeline over the past decade and to the ‘genetic insight’ filter.
“2013” here indicates the data freezes from Nelson et al. (that study’s supplementary dataset 2 for genetics and supplementary dataset 3 for drug pipeline); “2023” indicates the data freezes in the present study. All datasets were processed using the current MeSH similarity matrix, and because “genetic insight” changes over time (more traits have been studied genetically now than in 2013), all panels are unfiltered for genetic insight (hence numbers in panel D differ from those in Fig. 1a). Every panel shows the proportion of combined (both historical and active) target-indication pairs with genetic support, or P(G), by development phase. A) 2013 drug pipeline and 2013 genetics. B) 2013 drug pipeline and 2023 genetics. C) 2023 drug pipeline and 2013 genetics. D) 2023 drug pipeline and 2023 genetics. E) 2023 drug pipeline with only OTG GWAS hits through 2013 and no other sources of genetic evidence. F) 2023 drug pipeline with only OTG GWAS hits for all years, no other sources of genetic evidence. We note that the increase in P(G) over the past decade is almost entirely attributable to new genetic evidence (e.g. contrast B vs. A, D vs. C, F vs. E) rather than changes in the drug pipeline (e.g. compare A vs. C, B vs. D). In contrast, the increase in RS is due mostly to changes in the drug pipeline (compare C, D, E, F vs. A, B), in line with theoretical expectations outlined by Hingorani et al. and consistent with the findings of King et al. We note that both the contrasts in this figure, and the fact that genetic support is so often retrospective (Extended Data Fig. 2g) suggest that P(G) will continue to rise in coming years. For 2013 drug pipeline, N = 8,624 T-I pairs (1,605 preclinical, 1,772 phase I, 2,779 phase II, 636 phase III, and 1,832 launched); for 2023 drug pipeline, N = 29,464 T-I pairs (N = 12,653 preclinical, 4,946 phase I, 8,268 phase II, 1,781 phase III, and 1,816 launched). Details including numerator and denominator for P(G) and full continency tables for RS are provided in Tables S19 - S20. In A-F, the center is exact proportion and error bars are Wilson binomial 95% confidence intervals. Because all panels here are unfiltered for genetic insight, we also show the difference in RS across G) sources of genetic evidence and H) therapy areas when this filter is removed. In general, removing this filter decreases RS by 0.17; this varies only slightly between sources and areas. The largest impact is seen in Infection, where removing the filter drops the RS from 2.73 to 2.03. The relatively minor impact of removing the genetic insight filter is consistent with the findings of King et al., who varied the minimum number of genetic associations required for an indication to be included, and found that risk ratio for progression (i.e. RS) was slightly diminished when the threshold was reduced. See Fig. S5 for the same analyses restricted to drugs with a single known target. Source Data
Extended Data Fig. 4
Extended Data Fig. 4. Proportion of type 2 diabetes drug targets with human genetic support by highest phase reached.
A) OMIM, B) established (2019 and earlier) GWAS genes, C) novel (new in Vujkovic 2020 or Suzuki 2023) GWAS genes, or D) any of the above. See Methods for details on GWAS dataset processing. N is indicated at right of each panel, with denominator being the number of T2D targets at each stage and the numerator being the number of those that are genetically supported. Total N = 284 targets. The center is the exact proportion and error bars are Wilson binomial 95% confidence intervals. Source Data
Extended Data Fig. 5
Extended Data Fig. 5. P(G) by phase versus therapy area.
Each panel represents one therapy area, and shows the proportion of target-indication pairs in that area with genetic support, or P(G), by development phase. The genetically supported and total number of T-I pairs at each phase in each therapy area are provided in Table S33. Total number of T-I pairs in any area: N = 10,839 preclinical, N = 4,421 phase I, N = 7,383 phase II, N = 1,551 phase III, N = 1,519 launched. The center is the exact proportion and error bars are Wilson binomial 95% confidence intervals. See Fig. S6 for the same analyses restricted to drugs with a single known target. Source Data
Extended Data Fig. 6
Extended Data Fig. 6. Confounding between therapy areas and properties of supporting genetic evidence.
In panels A-E, each point represents one GWAS Catalog-supported T-I pair in phase I through launched, and boxes represent medians and interquartile ranges (25th, 50th, and 75th percentile). Each panel A-E represents the cross-tabulation of therapy areas versus the properties examined in Fig. 1d. Kruskal-Wallis tests treat each variable as continuous, while chi-squared tests are applied to the discrete bins used in Fig. 1d. A) Year of discovery, Kruskal-Wallis P = 1.1e-11, chi-squared P = 2.9e-16, N = 686 target-indication-area (T-I-A) triplets; B) gene count, Kruskal-Wallis P = 6.2e-35, chi-squared P = 7.1e-47, N = 770 T-I-A triplets; C) absolute beta, Kruskal-Wallis P = 1.2e-5, chi-squared P = 1.7e-7, N = 461 T-I-A triplets; D) absolute odds ratio, Kruskal-Wallis P = 2.5e-5, chi-squared P = 4.3e-6, N = 305 T-I-A triplets; E) minor allele frequency, Kruskal-Wallis P = 5.7e-4, chi-squared P = 4.3e-3, N = 584 T-I-A triplets; F) Barplot of therapy areas of genetically supported T-I by source of GWAS data within OTG, chi-squared P = 2.4e-7. See Fig. S7 for the same analyses restricted to drugs with a single known target. Source Data
Extended Data Fig. 7
Extended Data Fig. 7. Further analyses of differences in relative success among therapy areas.
A) Probability of success, P(S), by therapy area, with Wilson 95% confidence intervals. The N shown at right indicates the number of launched T-I pairs (numerator) and number of T-I pairs reaching at least phase I (denominator). The center is the exact proportion and error bars are Wilson binomial 95% confidence intervals. B) Probability of genetic support, P(G), by therapy area, with Wilson 95% confidence intervals. The N shown at right indicates the number of genetically supported T-I pairs reaching at least phase I (numerator) and total number of T-I pairs reaching at least phase I (denominator). The center is the exact proportion and error bars are Wilson binomial 95% confidence intervals. C) P(S) vs. P(G), D) RS s. P(S), and E) RS vs. P(G) across therapy areas, with centers indicating point estimates and crosshairs representing 95% confidence intervals on both dimensions — Katz for RS and Wilson for P(G) and P(S). For A-E, total N = 13,022 unique T-I pairs, but because some indications belong to > 1 therapy area, N = 16,900 target-indication-area (T-I-A) triples. For exact N and full contingency tables, see Table S28. F) Re-analysis of RS (x axis) broken down by therapy area using data from supplementary table 6 of Nelson et al.. G) Confusion matrix showing the categorization of unique drug indications into therapy areas in Nelson et al. versus current. Note that the current categorization is based on each indication’s position in the MeSH ontological tree and one indication can appear in > 1 area, see Methods for details. Marginals along the top edge are the number of drug indications in each current therapy area that were absent from the 2015 dataset. Marginals along the right edge are the number of drug indications in each 2015 therapy area that are absent from the current dataset. See Fig. S8 for the same analyses restricted to drugs with a single known target. Source Data
Extended Data Fig. 8
Extended Data Fig. 8. Level of utilization of genetic support among targets.
As for Fig. 3, but grouped by target instead of T-I pair. Thus, the denominator for each cell is the number of targets with at least one genetically supported indication, and each target counts towards the numerator if at least one genetically supported indication has reached phase I. See Fig. S9 for the same analyses restricted to drugs with a single known target. Source Data

Similar articles

Cited by

References

    1. DiMasi JA, Grabowski HG, Hansen RW. Innovation in the pharmaceutical industry: new estimates of R&D costs. J. Health Econ. 2016;47:20–33. doi: 10.1016/j.jhealeco.2016.01.012. - DOI - PubMed
    1. Hay M, Thomas DW, Craighead JL, Economides C, Rosenthal J. Clinical development success rates for investigational drugs. Nat. Biotechnol. 2014;32:40–51. doi: 10.1038/nbt.2786. - DOI - PubMed
    1. Wong CH, Siah KW, Lo AW. Estimation of clinical trial success rates and related parameters. Biostatistics. 2019;20:273–286. doi: 10.1093/biostatistics/kxx069. - DOI - PMC - PubMed
    1. Thomas D. et al. Clinical Development Success Rates and Contributing Factors 2011–2020 (Biotechnology Innovation Organization, 2021); https://go.bio.org/rs/490-EHZ-999/images/ClinicalDevelopmentSuccessRates...
    1. Nelson MR, et al. The support of human genetic evidence for approved drug indications. Nat. Genet. 2015;47:856–860. doi: 10.1038/ng.3314. - DOI - PubMed