. 2024 May;629(8013):951-956.
doi: 10.1038/s41586-024-07327-x. Epub 2024 Apr 17.

Stepwise activation of a metabotropic glutamate receptor

Affiliations

Stepwise activation of a metabotropic glutamate receptor

Kaavya Krishna Kumar et al. Nature. 2024 May.

Erratum in

Abstract

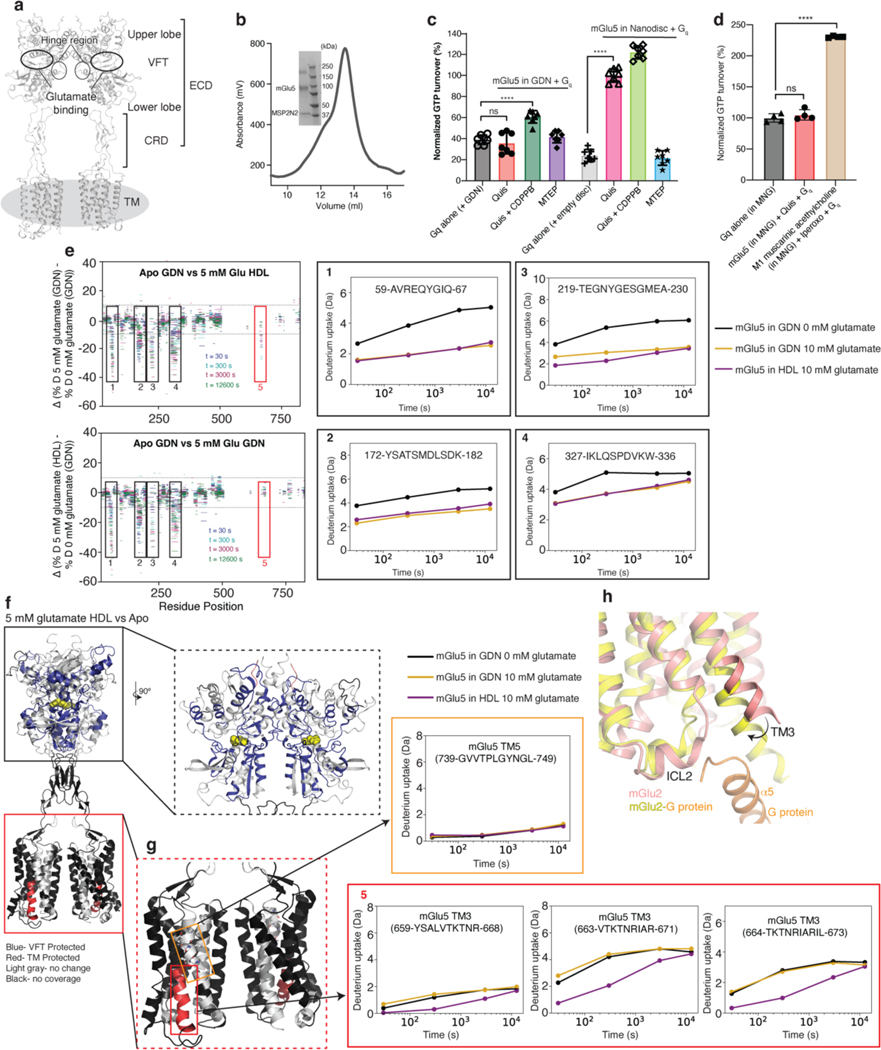
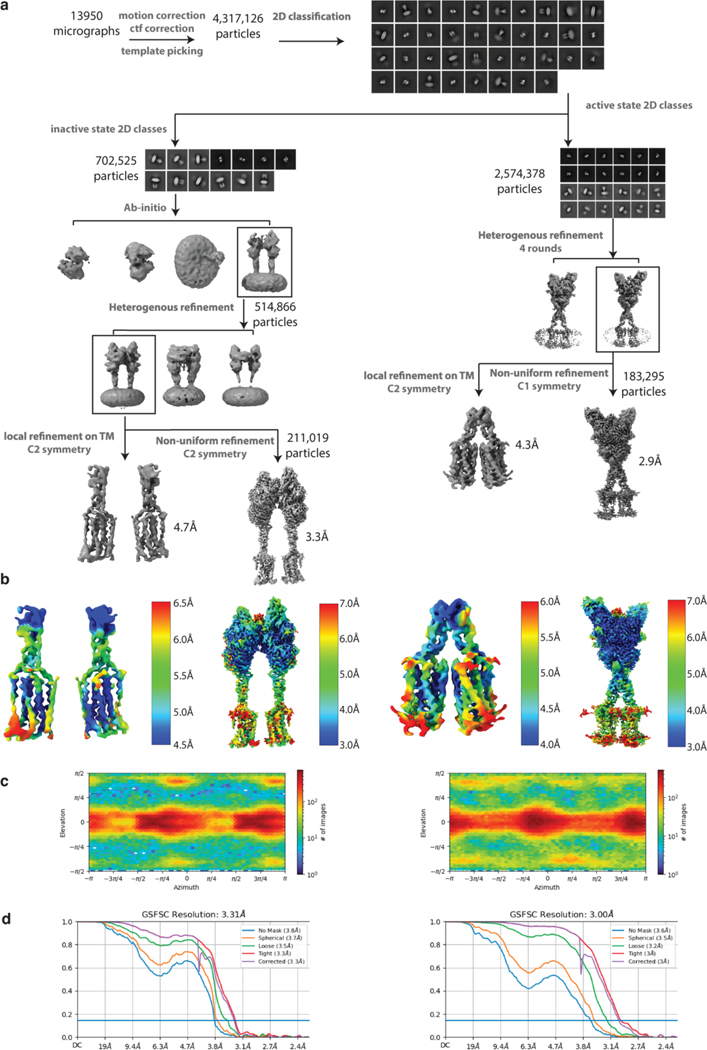
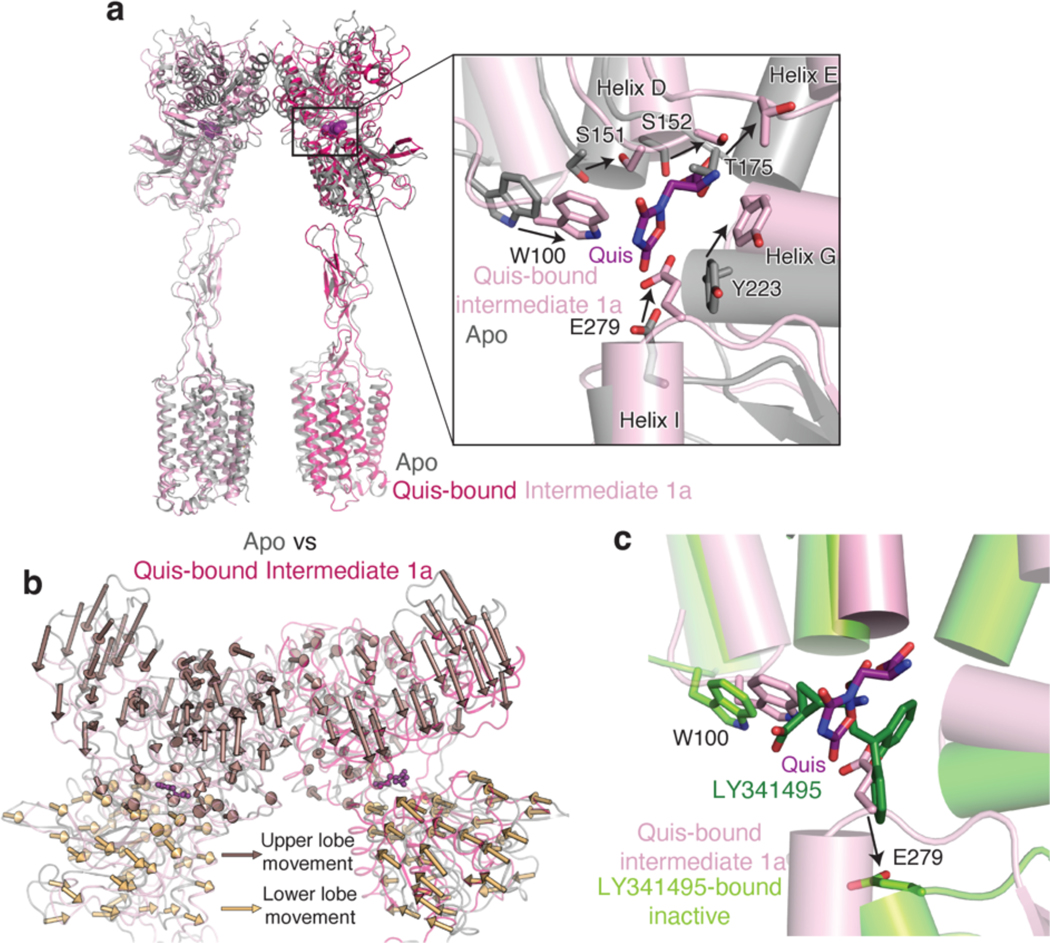
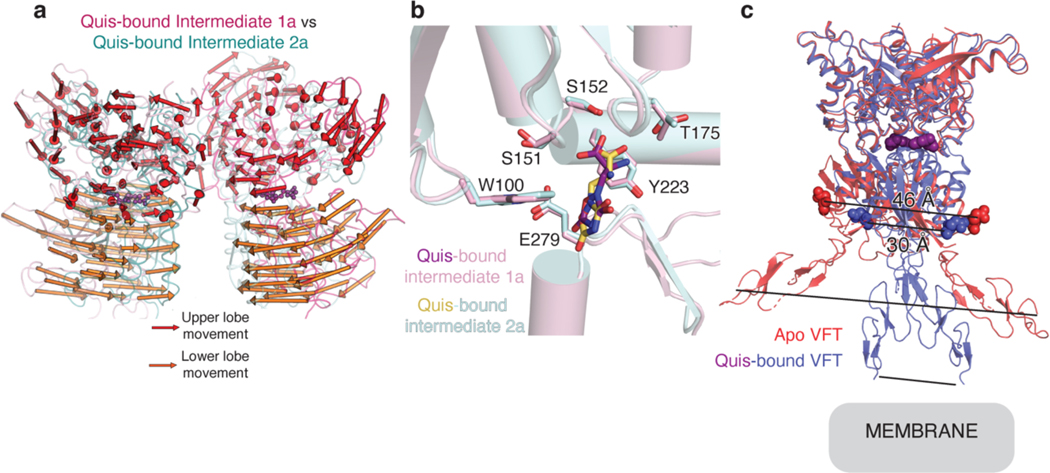
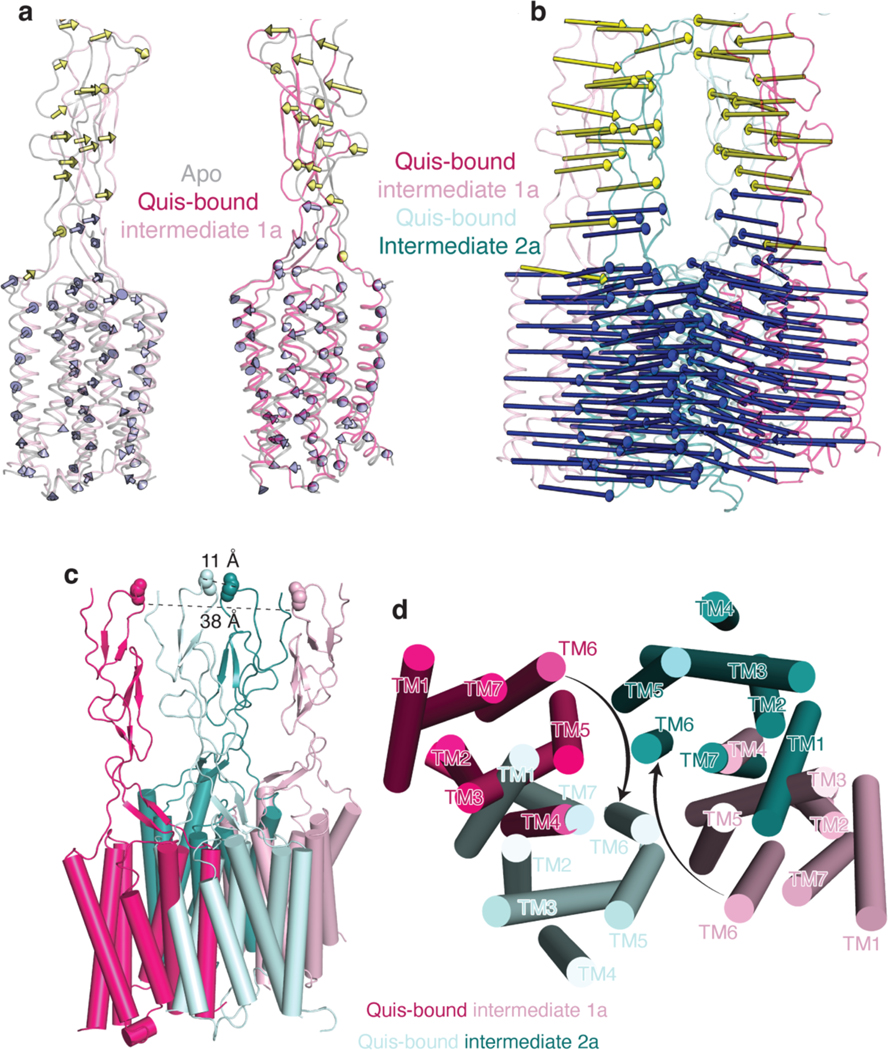
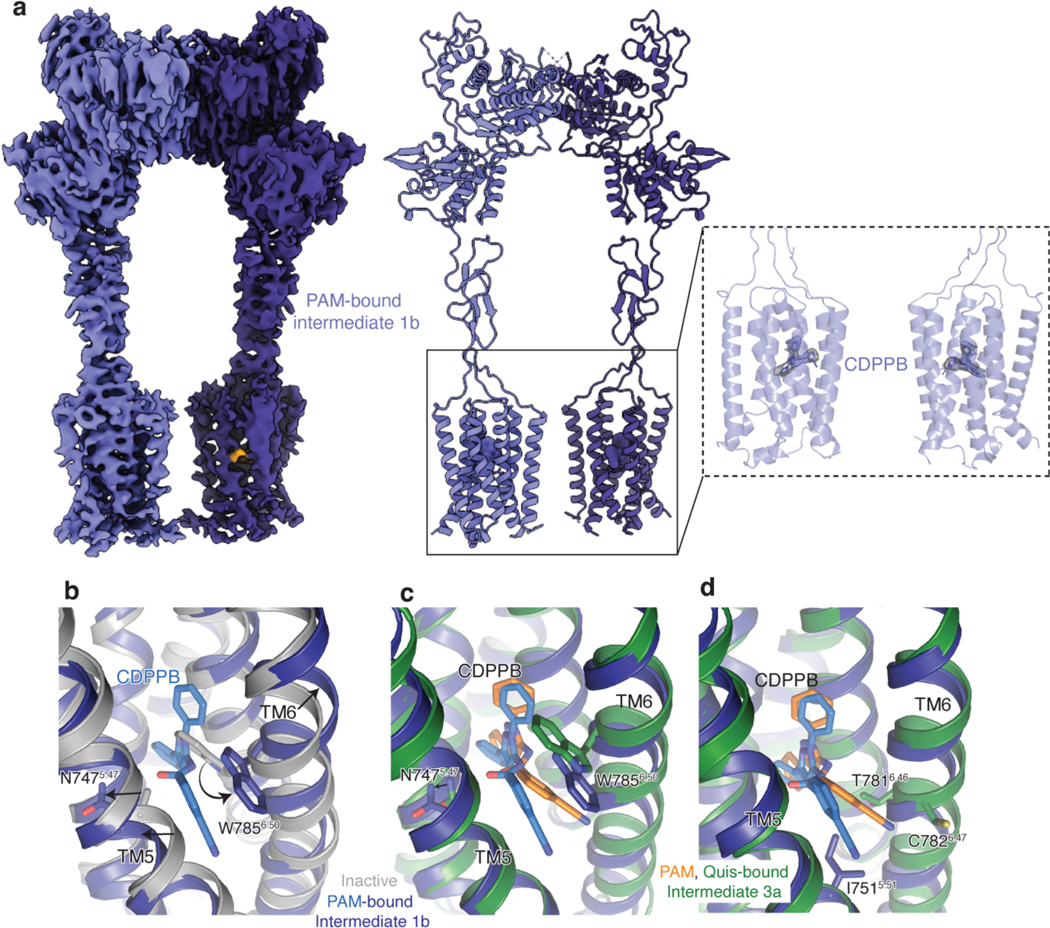
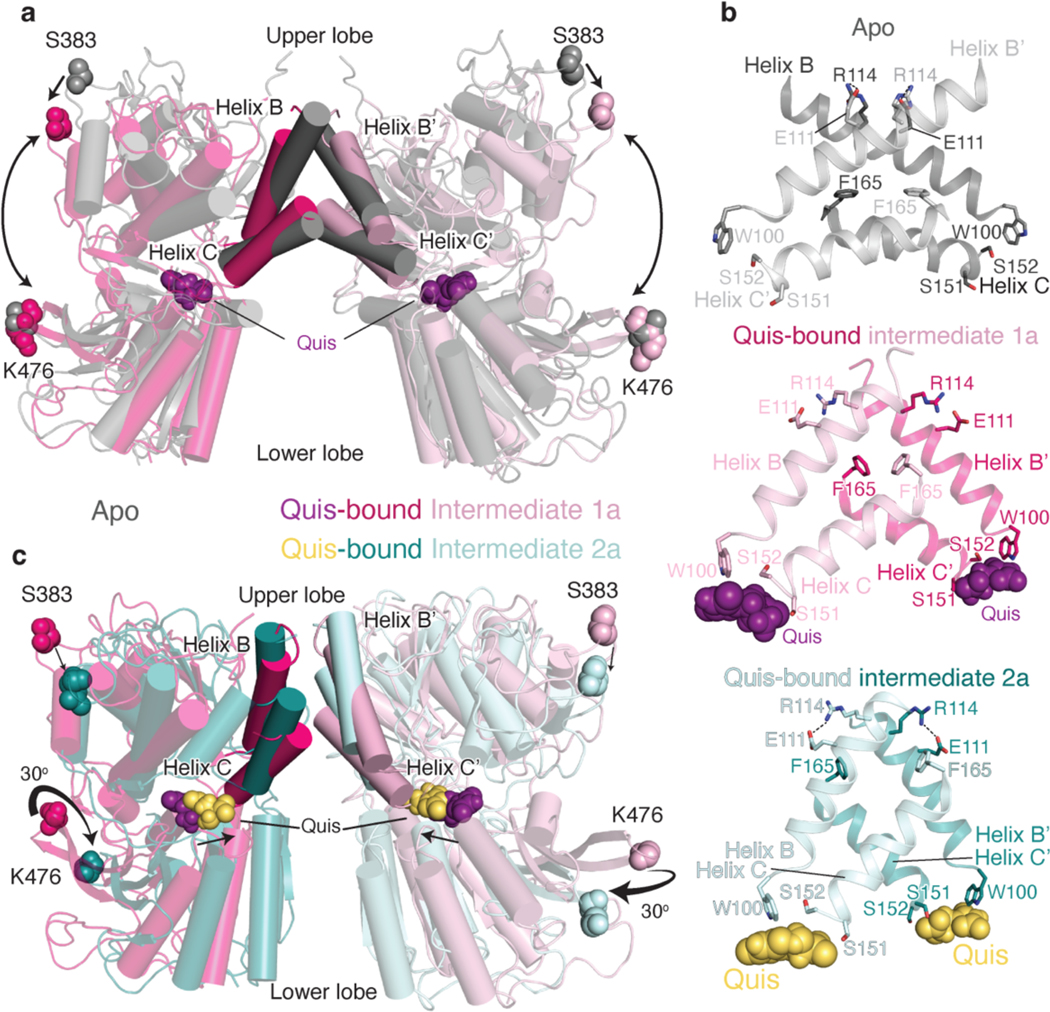
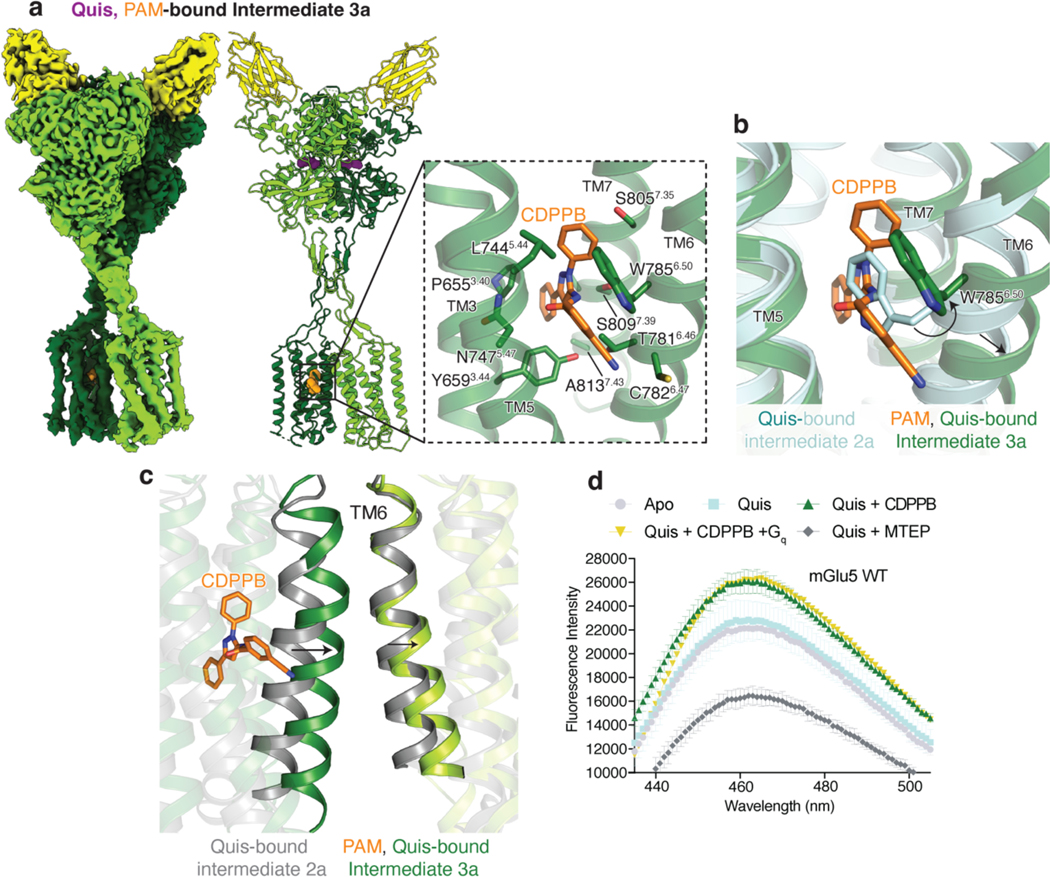
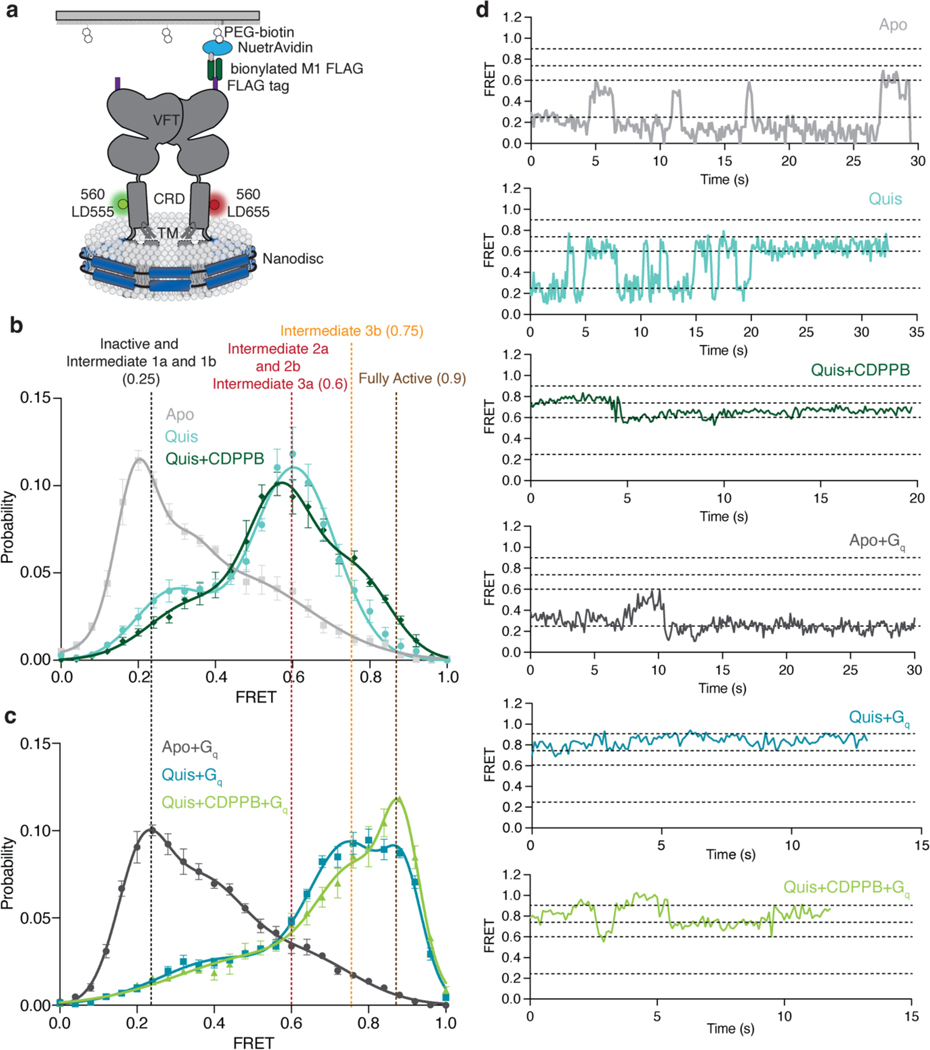
Metabotropic glutamate receptors belong to a family of G protein-coupled receptors that are obligate dimers and possess a large extracellular ligand-binding domain that is linked via a cysteine-rich domain to their 7-transmembrane domain1. Upon activation, these receptors undergo a large conformational change to transmit the ligand binding signal from the extracellular ligand-binding domain to the G protein-coupling 7-transmembrane domain2. In this manuscript, we propose a model for a sequential, multistep activation mechanism of metabotropic glutamate receptor subtype 5. We present a series of structures in lipid nanodiscs, from inactive to fully active, including agonist-bound intermediate states. Further, using bulk and single-molecule fluorescence imaging, we reveal distinct receptor conformations upon allosteric modulator and G protein binding.


Conflict of interest statement

Competing Interests

Brian Kobilka is co-founder of and consultant for ConfometRx. The remaining authors declare no competing interest.

Figures

Extended Data Figure 1:
Extended Data Figure 1:. mGlu5 activation in detergent compared to lipid environment
(a) Structural domains of mGlu5. (b) SEC trace and SDS-PAGE gel of mGlu5 in nanodisc. (c) GTP turnover assay showing mGlu5 induced Gq turnover. In the presence of agonist Quis, mGlu5 in detergent does not induce significant Gq (red) turnover compared to Gq alone (grey). The addition of Quis and CDPPB (dark green) to mGlu5 in detergent results in a significant G protein turnover. With mGlu5 in nanodiscs, the addition of Quis significantly increases Gq turnover (magenta). Quis and CDPPB (light green) further increase the GTP turnover of Gq. The negative allosteric modulator, MTEP inhibits turnover in mGlu5 nanodiscs condition (blue). Data represented as mean ± SD, ns= 0.4124, p < 0.0001****, unpaired t-test (two-tailed), n= 7 individual experiments (data normalization was done with the average value of Quis-bound mGlu5 in nanodiscs as 100% and receptor alone as 0%). (d) In the presence of the agonist iperoxo, muscarinic acetylcholine M1 receptor (in MNG) induces significant GTP turnover in Gq ( p < 0.0001****). But no difference is seen with Quis-bound mGlu5 (in MNG) and Gq (ns= 0.5374). Data represented as mean ± SD, p values are from unpaired t-test (two-tailed), n= 4 individual experiments. Data normalization was done with the average value of Gq in MNG as 100% and buffer alone as 0%. (e) HDX-MS data is plotted as the difference in the percent deuteration for a given peptide at a given time point against the sequence position for Apo mGlu5 in detergent (GDN) vs 5 mM glutamate-bound mGlu5 in detergent (GDN) (top) and Apo mGlu5 in detergent (GDN) vs 5 mM glutamate-bound mGlu5 in nanodisc (HDL) (bottom). Black boxes numbered 1–4 are example regions in the VFT that show no difference between mGlu5 in detergent (GDN) and nanodisc (HDL) (the corresponding deuterium uptake plots are shown on the right). The red box is a region in the TM that shows a difference between agonist-bound mGlu5 in detergent and nanodisc (HDX-MS exchange curves shown in Extended Figure 1g). (f) HDX-MS changes in Apo mGlu5 in detergent and agonist-bound mGlu5 in nanodisc are plotted onto the mGlu5 structure (PDB code: 6N51). (g) Colored red is the TM3 region, where peptides were observed in HDX-MS measurements. Deuterium uptake plots of these TM3 peptides (red box in Extended Fig 1e) show that Apo (black) and receptor in GDN in the presence of 5 mM glutamate (yellow) overlay well. Whereas, TM3 peptides of mGlu5 in nanodisc (magenta) do not overlay with Apo. Shown in the orange box is a TM5 peptide showing no change in deuterium uptake between the conditions. (h) Agonist-bound mGlu2 (PDB code: 7MTR) is overlayed with agonist-bound mGlu2-G protein complex (PDB code: 7MTS) showing conformational changes in the intracellular region of TM3.
Extended Data Figure 2:
Extended Data Figure 2:. Cryo-EM data processing workflow and resolution assessment of Quis-bound maps
(a) Workflow of cryo-EM data processing to obtain Quis-bound Intermediate 1a and Quis-bound Intermediate 2a structures. (b) Local resolution maps of the Quis-bound structures. (c) Angular particle distribution of the Quis-bound structures. (d) Gold-standard FSC curves of the structures.
Extended Data Figure 3:
Extended Data Figure 3:. Comparison of Apo and Quis-bound Intermediate 1a structures
(a) Overlay of the Apo (grey, PDB: 6N52) and Quis-bound Intermediate 1a showing CRDs and TMs in an “inactive” state. Insert shows the Quis binding pocket. (b) Movement of the VFTs upon agonist binding in Quis-bound Intermediate 1a state compared to the Apo state (PDB 6N52, grey). Arrows represent the movement of every 5 Cα atoms from the Apo to the Intermediate 1a state upon Quis binding. Nb43 is shown in yellow. (c) To get insights into structural changes needed to initiate activation, we compared the Quis-bound Intermediate 1a (light pink) and the antagonist, LY341495-bound (PDB: 7FD9, dark green) mGlu5 structures. LY341495 binding to the receptor inhibits the movement of residues W100 and E279.
Extended Data Figure 4:
Extended Data Figure 4:. Comparison of Quis-bound Intermediate 1a and Quis-bound Intermediate 2a structures
(a) Comparing the movement of the VFTs in the Quis-bound Intermediate 1a (light pink, magenta) and the Quis-bound Intermediate 2a states (cyan and teal) show large rearrangements in the lower lobe, with relatively smaller changes in the upper lobe. Arrows represent the movement of every 5 Cα atoms from the Intermediate 1a state to the Intermediate 2a state. (b) Single protomer alignment of Quis-bound Intermediate 2a (cyan) and Quis-bound Intermediate 1a (light pink) structures show no change in the Quis binding pocket. (c) VFT-only Apo (PDB: 6N50, red) and Quis-bound (PDB: 6N4Y, blue) structures with Nb43 (not shown in figure). The presence of Nb43 causes the closure of the upper lobe in both structures. The presence of Quis reduces the distance of the intersubunit lower lobes (PDB: 6N4Y, blue) and brings the CRDs close to each other to keep the TMs within the membrane. However, in the Apo state (PDB: 6N50, red), the lower lobes and the CRDs are apart, which will put the TMs outside the membrane.
Extended Data Figure 5:
Extended Data Figure 5:. mGlu5 transmembrane changes upon activation
a) Overlay of Apo (grey, PDB: 6N52) and Quis-bound Intermediate 1a states show minimal changes in the CRDs and TMs. Arrows represent the movement of every 5 Cα atoms from Apo to Intermediate 1a. b) Large changes in the CRDs and TMs are seen when comparing the Quis-bound Intermediate 1a and the Quis-bound Intermediate 2a states. Arrows represent the movement of every 5 Cα atoms from Intermediate 1a state to Intermediate 2a. c) The CRDs in the Quis-bound Intermediate 1a structure are separated by ~ 38 Å (as measured at residue E527). In the Quis-bound Intermediate 2a state, the twisting of the lower lobe enables the CRDs (~ 11 Å at residue E527) and TMs to move adjacent to each other. d) The TMs in the Quis-bound Intermediate 1a structure are far apart with TM5 being the most proximal helix pair (~ 21 Å). In the Quis-bound Intermediate 2a state the TMs of the protomers, in addition to moving closer to each other, rotate ~ 20° to form a TM6-TM6 interface, a hallmark of Family C activation.
Extended Data Figure 6:
Extended Data Figure 6:. Cryo-EM data processing workflow and resolution assessment of CDPPB, Quis-bound map
(a) Workflow of cryo-EM data processing to obtain CDPPB, Quis-bound mGlu5 structure, Intermediate 3a. (b) Local resolution maps of the CDPPB, Quis-bound mGlu5 structure. (c) Angular particle distribution of the structure. (d) Gold-standard FSC curves of the Quis-bound mGlu5 structure.
Extended Data Figure 7:
Extended Data Figure 7:. Cryo-EM data processing workflow and resolution assessment of CDPPB-bound map
(a) Workflow of cryo-EM data processing to obtain CDPPB-bound mGlu5 Intermediate 1b structure. (b) Local resolution maps of the CDPPB-bound mGlu5 structure. (c) Angular particle distribution of the structure. (d) Gold-standard FSC curves of the CDPPB-bound mGlu5 structure.
Extended Data Figure 8:
Extended Data Figure 8:. CDPPB-bound structure analysis
(a) Cryo-EM density and model of CDPPB-bound mGlu5 Intermediate 1b in nanodisc. Also shown is the density for the two bound CDPPB, one in each TM domain. (b) Comparison of the allosteric binding pocket in Apo (PDB:6N52, grey) and CDPPB-bound mGlu5 (dark blue), shows changes in TM5 (N7475.47) and TM6 (W7856.50) to accommodate CDPPB (slate). (c) Overlay of CDPPB from Intermediate 1b (dark blue) and Intermediate 3a structures showing minimal changes in the conformation of TM5 and TM6. (d) Residues that interact with CDPPB only in Intermediate 3a are shown in green (T7816.46 and C7826.47) and those that interact with CDPPB only in Intermediate 1b are shown in blue (I7515.51).
Extended Data Figure 9:
Extended Data Figure 9:. CDPPB, Quis-bound structural analysis
(a) Overlay of intersubunit B and C helices in Quis-bound Intermediate 2a state and CDPPB, Quis-bound Intermediate 3a structure. Residues R114 and E111 interact in both structures. (b) Overlay of Quis binding pocket in Quis-bound Intermediate 2a and CDPPB, Quis-bound Intermediate 3a structures, showing no difference in the ligand pocket. (c) The conformation of residue W7856.50 is different in the structure with the NAM, MPEP (PDB: 6FFI, brown) compared to that with the PAM, CDPPB (dark green). (d) TM6 in the CDPPB-bound Protomer 1 has moved outward compared to Protomer 2 with no CDPPB bound. In CDPPB-bound Protomer 1, Y7796.44 points towards the intersubunit interface, as seen in (e). Though we cannot model the Y7796.44 sidechain in Protomer 1 with confidence due to a lack of good density, we have added the most frequently occurring rotomer of Tyr. (f) Comparison of the allosteric pocket in CDPPB-bound protomer (protomer 1, dark green and CDPPB shown as orange) and the protomer with no CDPPB (protomer 2, green).
Extended Data Figure 10:
Extended Data Figure 10:. Characterisation of minimal cysteine mGlu5 and ICL2 conformation
(a) Residues Cys6914.30 and Cys681ICL2 that contribute to background labeling with dyes are shown as spheres. Other cysteine residues in the receptor are shown as yellow sticks. (b) mGlu5 full-length and ECD alone (VFT and CRD) were labeled with the cysteine reactive dye, monobromobimane. Though no signal was seen for ECD (dark grey), full-length (FL) mGlu5 produced a bimane spectrum (light grey). This implies that mGlu5 TMs have cysteine residues that are exposed to being labeled with bimane. n = 1 individual experiment. (c) WT and minimal cysteine (C6914.30A and C681ICL2A) constructs were labeled with Atto488. Unlike WT, the minimal cysteine construct exhibits almost no background labeling for the times tested. (d) Fluorescence intensity at 464 nm for mGlu5 WT labeled with bimane (reading out on ICL2 conformation from Fig 3e) is plotted for the different ligand conditions. Though there is no significant difference between Apo (light grey) and Quis (cyan), the addition of Quis and CDPPB (dark green) showed a significant change. No further change was detected with the addition of Gq to the Quis and CDPPB condition (yellow). The addition of MTEP resulted in a significant decrease in fluorescence intensity (dark grey). Data represented as mean ± SD, ns = 0.5326, p= 0.0001***, p = 0.0026**, p < 0.0001****, unpaired t-test (two-tailed), n = 3 individual experiments. (e) Bimane spectra of mGlu5 in nanodiscs labeled only at C681ICL2 (C6914.30A construct). Unlike adding Quis (cyan) which resulted in no change in the spectrum, the addition of CDPPB alone (blue) or Quis and CDPPB (dark green) increases the fluorescence. On the other hand, LY341495 and MTEP (brown) cause a decrease in fluorescence. Data represented as mean ± SEM, n = 3 individual experiments. (f) Plotting the fluorescence intensity at 464 nm for bimane data in Extended Data Figure 10e shows a significant difference between CDPPB alone (blue), Quis and CDPPB (dark green), and LY341495 and MTEP (brown) compared to Apo (grey). Data represented as mean ± SEM, ns = 0.5713, p < 0.0001, p = 0.0257* (Apo vs CDPPB), p < 0.0160* (Apo vs Quis + CDPPB), unpaired t-test (two-tailed), n = 3 individual experiments. (g) Comparison of Quis-bound (cyan) and CDPPB, Quis-bound structures (dark green) showing changes in TM3 and TM4. Also shown is the position of residue C6914.30 which is bimane labeled in the WT construct (Figure 3e, Extended Figure 10e).
Extended Data Figure 11:
Extended Data Figure 11:. smFRET fitting statistics and analysis
(a) Interdye distance between residue D560 in Apo (grey, 71.3 Å) and Quis-bound Intermediate 2a (36.3 Å). Both these distances correlated well with the observed FRET values (Figure 4b). (b) Plot of the Akaike information criterion (corrected for small sample size, AICc) values for analysis with 1 to 5 Gaussians fits for the smFRET data. The AICc values showed broad minima at 3 and 4 fits. 3 Gaussians were used to fit the data. (c) smFRET data showing the comparison of Apo (grey, N=319) and antagonist-bound mGlu5 (brown, N=245). (d) The addition of CDPPB alone results in two FRET peaks, one at ~ 0.25, Intermediate 1b state, and the other at ~ 0.6, the Intermediate 2b state (slate, N=329). In the presence of Quis (teal), the same two FRET peaks are seen except with different relative proportions of the two states. (e) The addition of Gq to the Quis-alone sample shifts the population to the high FRET states, Intermediate 3b (~ 0.75) and Fully Active (~ 0.9) at the expense of the Intermediate 2a (~ 0.6) and Intermediate 1a (~ 0.25) peaks. For the CDPPB alone sample, the addition of Gq results in the appearance of a high FRET peak with a decrease, but not complete disappearance of the Intermediate 2b (~ 0.6) and Intermediate 1b (~ 0.25) peaks. (f) 3Dflex analysis of frames 0 and 40 showing a change in distance between the CRDs. (g) Example smFRET traces showing donor (green), and acceptor (red) intensity values as well as the calculated FRET values (blue) for a series of ligand conditions with and without Gq.
Fig 1:
Fig 1:. Sequential activation of mGlu5 in lipid environment
a) Using the data from this study we propose a model for mGlu5 activation. The addition of an orthosteric agonist (e.g. glutamate) results in the closing of the upper lobe (Intermediate 1a). This conformation is in equilibrium with a conformation in which the twisting of the lower lobe brings the CRDs and TMs in close proximity (Intermediate 2a). The addition of a PAM stabilizes the CRDs and TMs, including ICL2 in an active conformation (Intermediate 3a). Intermediate 3a is in equilibrium with Intermediate 3b, which is characterized by a smaller intersubunit distance. In the presence of an orthosteric agonist, the PAM binds to one protomer (Intermediate 3a and 3b), whereas in its absence the PAM binds to both the protomers symmetrically (Intermediate 1b). Further addition of G protein to the agonist and PAM-bound mGlu5 results in the stabilization of a unique fully active conformation of the receptor (Fully active). b) Cryo-EM density and model of Quis-bound mGlu5 in nanodisc, representing an Intermediate 1a state, where Quis is bound to the VFTs, however, the CRDs and TMs are far apart mimicking the inactive state. VFT binding Nb43 is shown in yellow. c) Cryo-EM density and model of nanodisc-incorporated Quis-bound mGlu5, Intermediate 2a state. The CRDs and TMs are in an active conformation (close together).
Fig 2:
Fig 2:. Structures of Quis-bound conformations of mGlu5 in nanodisc
a) VFTs of Apo (grey, PDB: 6N52) and Quis-bound Intermediate 1a are overlayed. Upon Quis binding the upper lobe closes, as seen by the movement of S383, whereas not much change is seen in the lower lobe (comparing K476 between the structures). Also shown is the comparison of the B and C helices at the intersubunit interface in the Apo and Quis-bound Intermediate 1a state. b) The intersubunit rearrangement upon Quis binding reorients the B and C helices leading to a reduction in the helix angle. Top: Apo, Middle: Quis-bound Intermediate 1a and Bottom: Quis-bound Intermediate 2a. Residue R114 interacts with E111 in the Apo and Quis-bound Intermediate 2a states and not in the Quis-bound Intermediate 1a structure. The residue F165 is shown to illustrate the change in the position of the C helix. There is a downward movement of W100 towards Quis in Intermediates 1a and 2a. Due to the lower lobe rotation in Intermediate 2a, a further inward movement of Quis is seen. c) Overlay of VFTs of Quis-bound Intermediate 1a and Quis-bound Intermediate 2a showing a small change in the upper lobe (movement of S383). The lower lobes twist 30° and move closer together as seen by comparing K476 between the structures. The B and C helices at the protomer-protomer interface in the Quis-bound Intermediate 2a state show an upward shift compared to the Quis-bound Intermediate 1a. This likely is the result of the inward movement of Quis (from purple to yellow) and the rearrangement of the lower lobe.
Fig 3:
Fig 3:. Structural changes of upon PAM binding to mGlu5
a) Cryo-EM density and model of CDPPB (orange) and Quis-bound mGlu5 in nanodisc. The structure represents the Intermediate 3a state with the CRDs and TMs in close proximity. Nb43 is shown in yellow. Insert: Binding pocket of CDPPB in the TM region showing residues within 4Å as sticks. b) CDPPB binding to the TM causes the rearrangement of W7856.50 to accommodate the ligand. c) Quis-bound Intermediate 2a and CDPPB, Quis-bound Intermediate 3a structures show differences in the conformation of TM6 at the protomer interface. d) Bimane spectra of mGlu5 in nanodiscs labeled at positions C6914.30 (end of TM4) and C681ICL2. Adding Quis (cyan) results in no change in the spectra compared to Apo (grey). However, Quis and CDPPB increase the fluorescence (dark green), indicating a change in the ICL2 environment. Further addition of Gq does not result in a change in the bimane spectrum (yellow). The addition of Quis and MTEP causes a decrease in fluorescence. Data represented as mean ± SD, n = 3 individual.
Fig 4:
Fig 4:. Ligand stabilised conformations of mGlu5 in nanodisc
a) A schematic representation of the smFRET experiment. b) In the Apo state (grey) a dominant inactive FRET peak at ~ 0.25 is observed ( N=319). The binding of the agonist, Quis results in the appearance of a ~ 0.6 FRET state (Intermediate 2a, cyan, N=392) with a minor peak at ~ 0.25 (Intermediate 1a). The addition of CDPPB to Quis-bound mGlu5 stabilizes the ~ 0.6 FRET state (Intermediate 3a), decreases the occupancy of the ~ 0.25 state, and results in the appearance of a new FRET peak at ~ 0.75 (Intermediate 3b, dark green, N=329). High FRET (~ 0.6 and ~ 0.75) represents the active state population of the receptor with the CRDs and TMs in close proximity. Histograms are shown with a 3-Gaussian fit to the data and represented as mean ± SEM. c) The coupling of Gq to Apo (dark grey, N=329) remains largely unchanged compared to Apo alone (Figure 4b), while the addition of Gq in the presence of Quis results in the near complete abrogation of the ~ 0.6 FRET peak in favor of the ~ 0.75 peak (Intermediate 3b) and a new peak at ~ 0.9 (Fully Active) (teal, N=306), which is further stabilized in the presence of CDPPB (light green, N=317). Histograms are shown with a 3-Gaussian fit to the data and represented as mean ± SEM. d) Example FRET traces are shown for each ligand condition.

Similar articles

Cited by

References

    1. Pin J-P & Bettler B. Organization and functions of mGlu and GABAB receptor complexes. Nature 540, 60–68 (2016). - PubMed
    1. Koehl A. et al. Structural insights into the activation of metabotropic glutamate receptors. Nature 566, 79–84 (2019). - PMC - PubMed
    1. Moustaine El, D. et al. Distinct roles of metabotropic glutamate receptor dimerization in agonist activation and G-protein coupling. Proc. Natl. Acad. Sci. U.S.A 109, 16342–16347 (2012). - PMC - PubMed
    1. Gasparini F. & Spooren W. Allosteric modulators for mGlu receptors. Curr Neuropharmacol 5, 187–194 (2007). - PMC - PubMed
    1. Ritchie TK et al. Chapter 11 - Reconstitution of membrane proteins in phospholipid bilayer nanodiscs. Methods Enzymol 464, 211–231 (2009). - PMC - PubMed

MeSH terms

Substances