. 2024 May;629(8010):146-153.
doi: 10.1038/s41586-024-07311-5. Epub 2024 Apr 17.

Network-level encoding of local neurotransmitters in cortical astrocytes

Affiliations

Network-level encoding of local neurotransmitters in cortical astrocytes

Michelle K Cahill et al. Nature. 2024 May.

Erratum in

Abstract

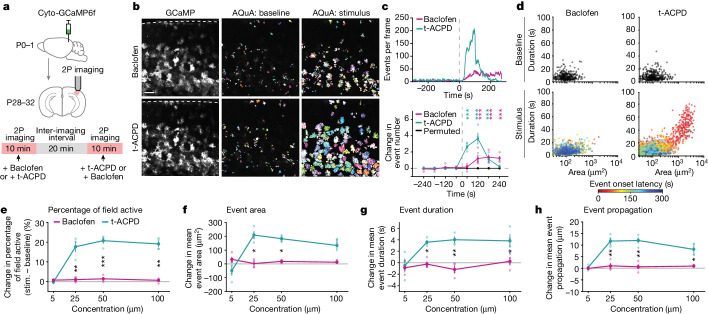
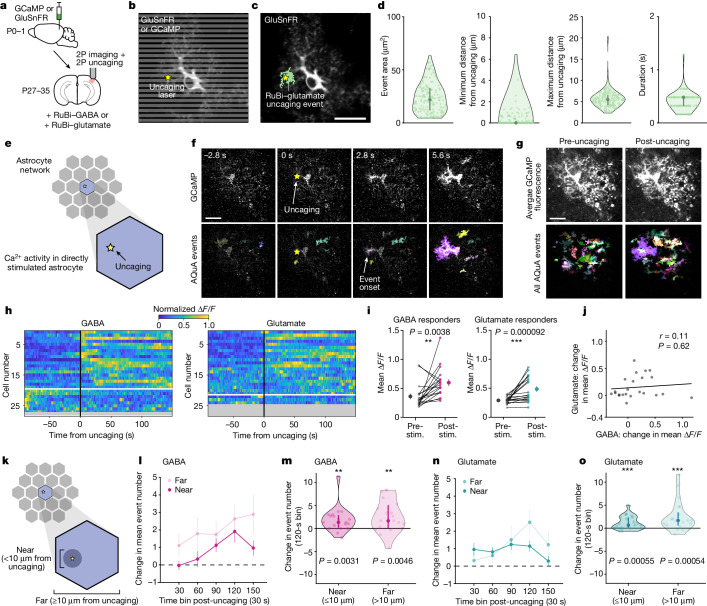
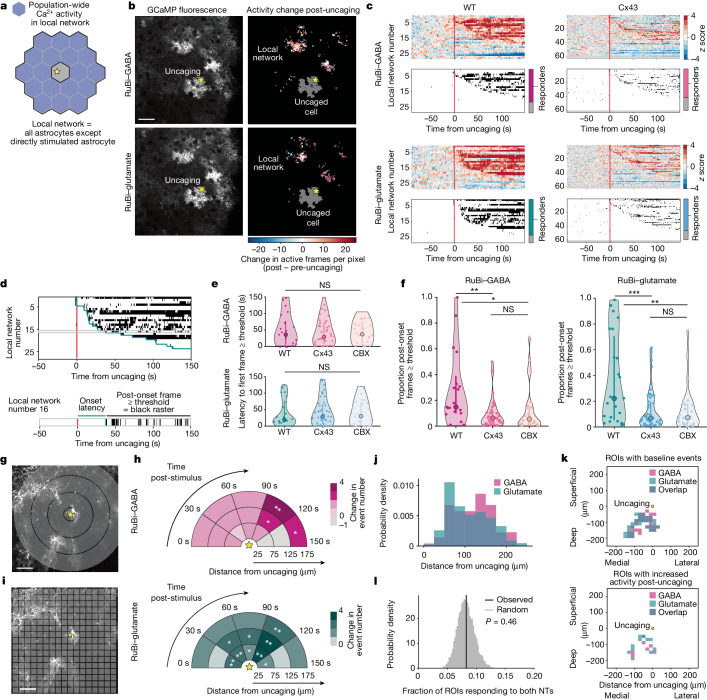
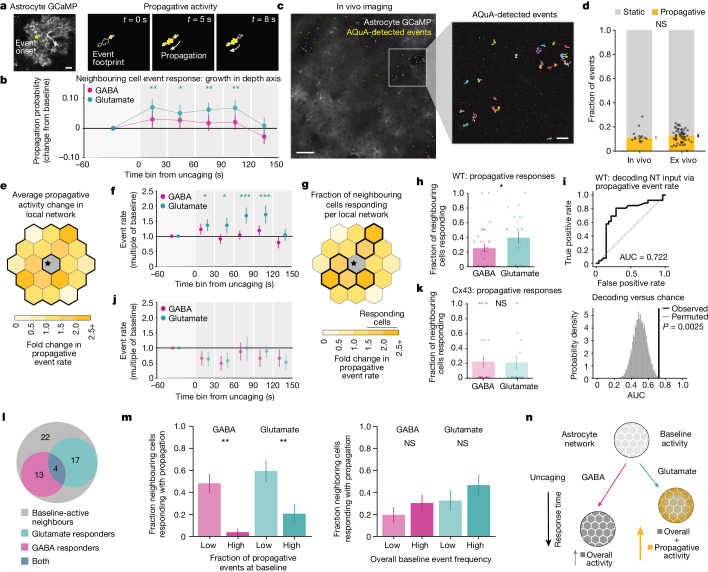
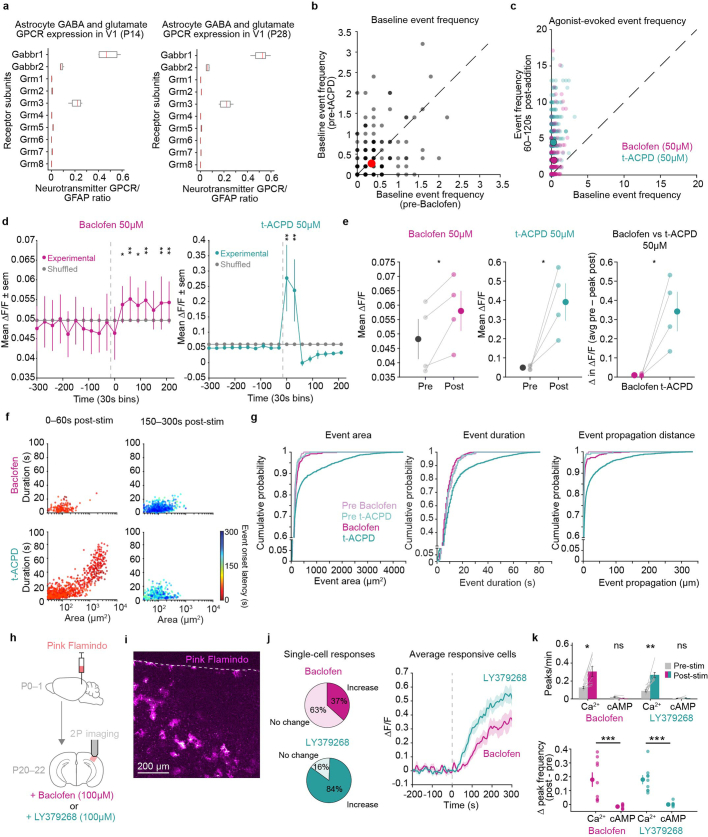
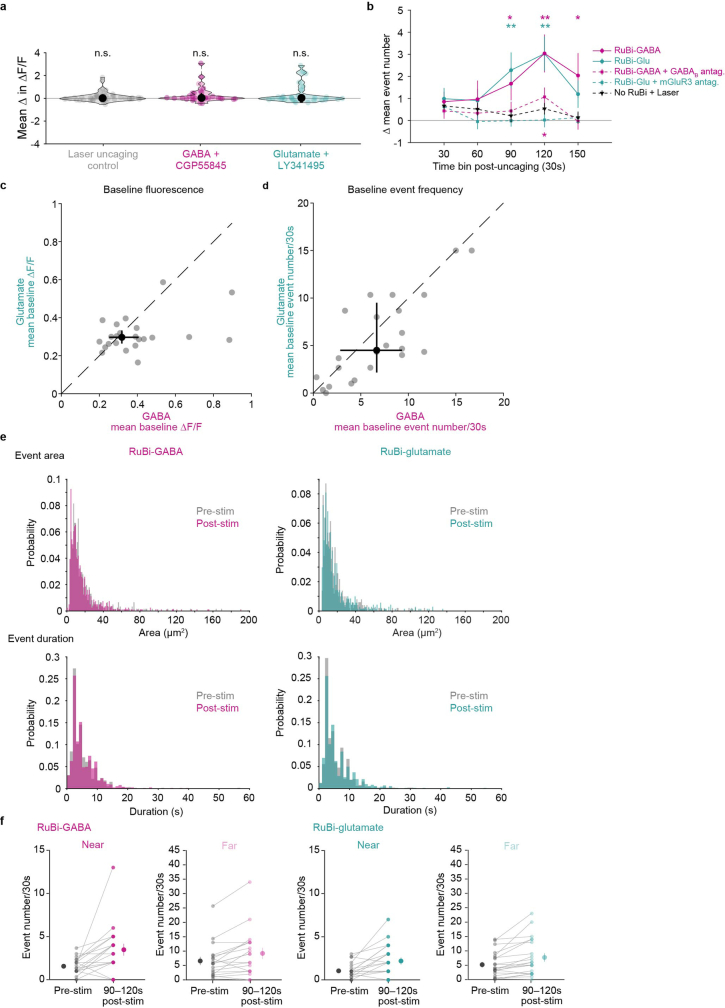
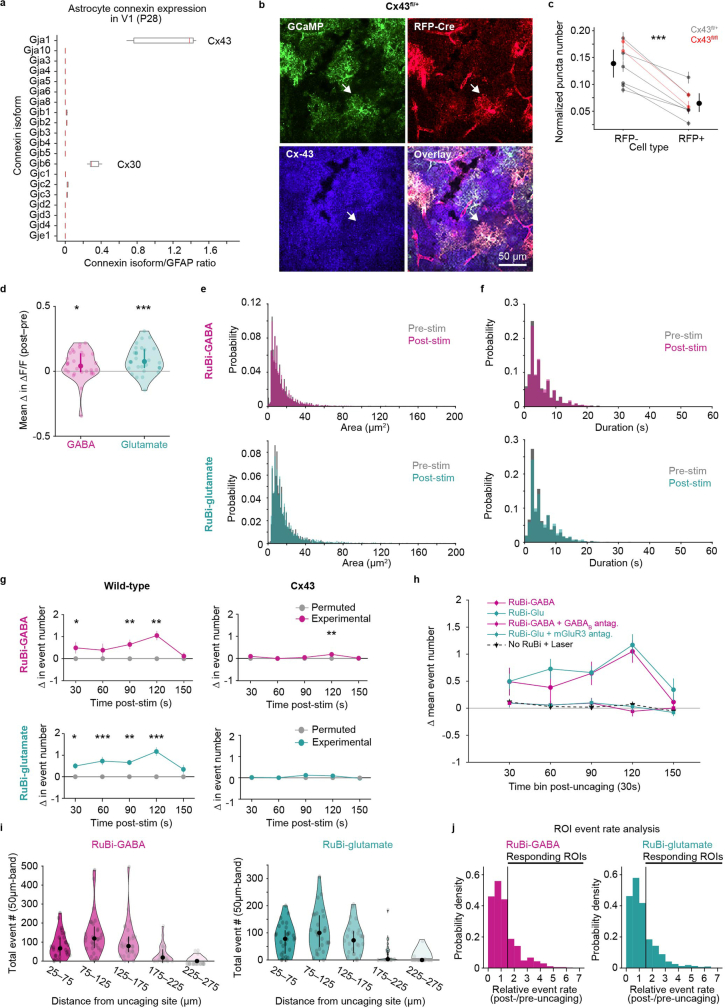
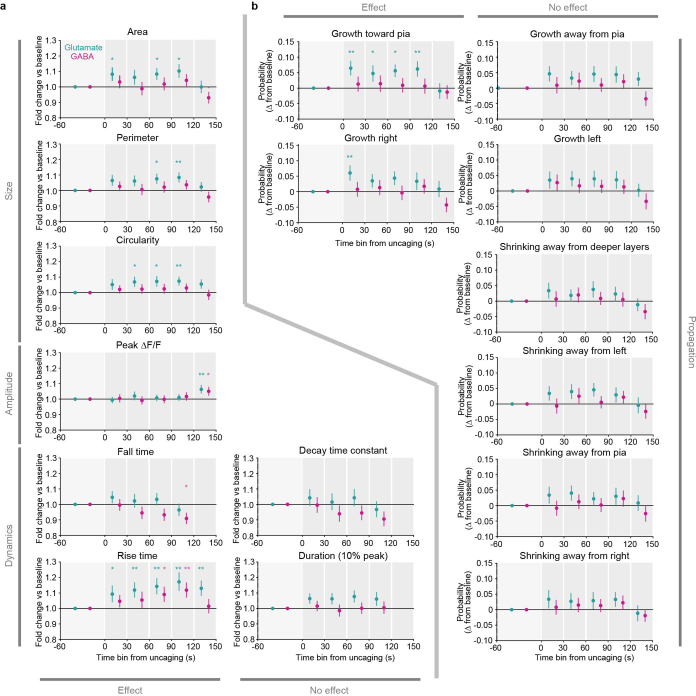
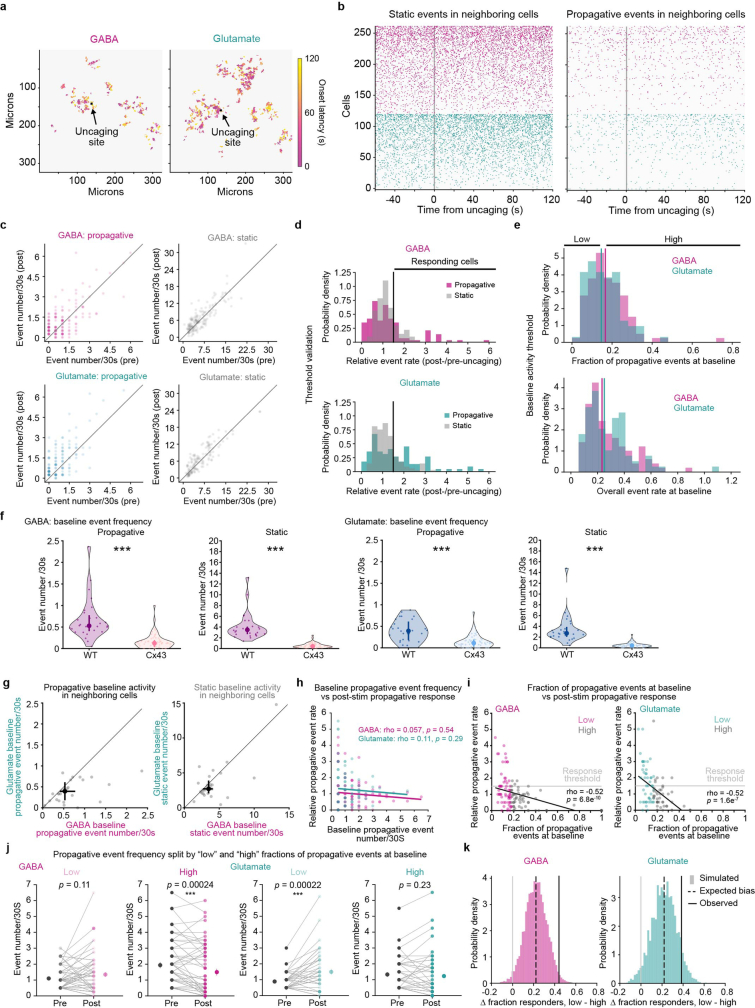
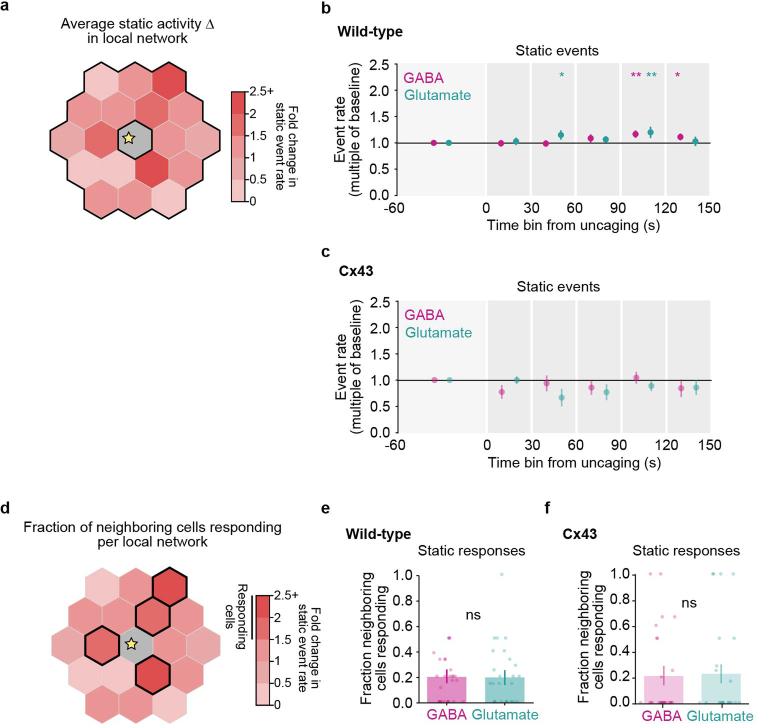
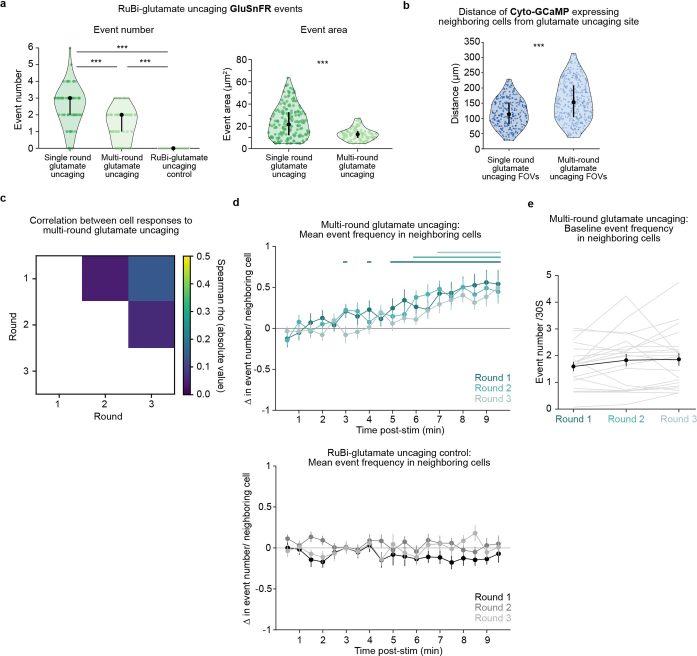
Astrocytes, the most abundant non-neuronal cell type in the mammalian brain, are crucial circuit components that respond to and modulate neuronal activity through calcium (Ca2+) signalling1-7. Astrocyte Ca2+ activity is highly heterogeneous and occurs across multiple spatiotemporal scales-from fast, subcellular activity3,4 to slow, synchronized activity across connected astrocyte networks8-10-to influence many processes5,7,11. However, the inputs that drive astrocyte network dynamics remain unclear. Here we used ex vivo and in vivo two-photon astrocyte imaging while mimicking neuronal neurotransmitter inputs at multiple spatiotemporal scales. We find that brief, subcellular inputs of GABA and glutamate lead to widespread, long-lasting astrocyte Ca2+ responses beyond an individual stimulated cell. Further, we find that a key subset of Ca2+ activity-propagative activity-differentiates astrocyte network responses to these two main neurotransmitters, and may influence responses to future inputs. Together, our results demonstrate that local, transient neurotransmitter inputs are encoded by broad cortical astrocyte networks over a minutes-long time course, contributing to accumulating evidence that substantial astrocyte-neuron communication occurs across slow, network-level spatiotemporal scales12-14. These findings will enable future studies to investigate the link between specific astrocyte Ca2+ activity and specific functional outputs, which could build a consistent framework for astrocytic modulation of neuronal activity.


Conflict of interest statement

The authors declare no competing interests.

Figures

Fig. 1
Fig. 1. Direct GABAergic and glutamatergic receptor activation drive distinct astrocyte Ca2+ activity.
a, Experimental strategy for cyto-GCaMP6f expression and two-photon (2P) imaging of astrocytic Ca2+ in acute V1 cortical slices during pharmacological activation through bath-application. Receptor agonists sequentially bath-applied to the same slice, with an inter-imaging interval of >20 min, including >10-min washout period. P0, postnatal day 0. b, Left: representative astrocytic GCaMP6f fluorescence during bath-application of baclofen (top) and t-ACPD (bottom). Dashed line: pia. Middle and right: all AQuA-detected events 300 s before (middle) and after (right) agonist addition (50 µM). Scale bar, 100 μm. c, Top: representative traces (AQuA events per frame) of FOV in b. Bottom: average change from baseline in events per minute. Periods of 300–0 s before and 0–240 s after agonist addition were used to calculate change in events per 60 s per active astrocyte (≥1 AQuA-detected event). Data shown by slice (n = 4 slices stimulated with 50 μM agonist); mean ± s.e.m. Permutation test used to determine significance. P values in Supplementary Table 1. 0 s: time of agonist addition. d, Features of individual Ca2+ events at baseline (top, black) and after bath-application of baclofen (bottom left) or t-ACPD (bottom right). Events following agonist addition colour-coded by onset time. Dots: individual Ca2+ events from n = 4 slices stimulated with 50 µM agonist. eh, Average change in Ca2+ features with bath-application of baclofen (pink) or t-ACPD (green) at four concentrations. Agonist order alternated between conditions: baclofen added first at 5 and 50 μM and second at 25 and 100 μM. Change calculated by comparing 120 s before and after agonist entry. Data shown by slice (n = 4 slices, 4 mice for each concentration); mean ± s.e.m. Paired t-tests between agonists at each concentration followed by Bonferroni–Holm correction with family-wise error rate ≤ 0.05. P values in Supplementary Table 2. All statistical tests are two-sided. NS: P ≥ 0.05; *P < 0.05; **P < 0.01; ***P < 0.001.
Fig. 2
Fig. 2. Subcellular, spatiotemporally restricted NT release increases Ca2+ activity within directly stimulated astrocytes.
a, Experimental strategy for simultaneous ex vivo two-photon imaging of astrocyte Ca2+ (cyto-GCaMP6f) or extracellular glutamate (GluSnFR) and two-photon NT uncaging. b, Imaging and uncaging schematic. Grey lines: scanning laser. Yellow star: NT uncaging site. c, A representative GluSnFR event during RuBi–glutamate uncaging. d, GluSnFR event features post RuBi–glutamate uncaging. Data shown by individual glutamate events; median and 25th and 75th percentiles (n = 72 trials, 12 recordings, 4 slices, 2 mice). e, Schematic highlighting directly stimulated astrocyte. Analysis throughout figure includes only events from directly stimulated cells. f, Representative GCaMP6f fluorescence in astrocyte before and after RuBi–GABA uncaging. Yellow star: uncaging location and frame. g, Average GCaMP fluorescence 150–0 s pre- and 0–150 s post-stimulus from the astrocyte in f. h, Astrocyte Ca2+ stimulated by GABA or glutamate uncaging. Rows: average ΔF/F from AQuA-detected events per cell, normalized between 0 and 1 per cell. Cells sorted by onset time. Red line: NT uncaging. The white line separates responding (above) and non-responding cells (below). Responder cells: ≥1 post-stimulus frame with ∆F/F ≥ baseline mean + 3 s.d. Greyed-out rows: cells excluded because of baseline event frequency. i, Mean fluorescence pre- and post-stimulus from astrocytes responding to NT uncaging. Data are shown by cell and as mean ± s.e.m. j, Fluorescence change in stimulated astrocytes following NT uncaging. Pearson’s correlation shows no significant relationship between fluorescence change following GABA and glutamate uncaging (P = 0.62). k, A schematic of stimulated astrocyte compartments near and far from uncaging. Far compartment: uncaging outside NT spread radius (d, maximum distance from uncaging). l,n, Event frequency (events per 30 s) change near and far from GABA (l) and glutamate (n) uncaging within responding, stimulated cells. Data shown as mean ± s.e.m. m,o, Event frequency change during high activity period (90–120 s after uncaging, ‘120-s’ bin) from l and n, respectively. Data shown by cell; median and 25th and 75th percentiles. hj,lo, Pre-stimulus: 90–0 s before uncaging; post-stimulus: 0–150 s following uncaging. n = 27 (GABA) and 24 (glutamate) cells in h, 19/27 cells responded to GABA and 21/24 to glutamate in i,lo and 24 paired cells in j all from 27 FOVs, 7 slices, 4 mice. i,m,o, Wilcoxon signed-rank test. All statistical tests are two-sided. Scale bars, 20 μm (c,f,g). NS: P ≥ 0.05; *P < 0.05; **P < 0.01; ***P < 0.001.
Fig. 3
Fig. 3. Subcellular release of NTs increases Ca2+ activity in the local astrocyte network through Cx43.
a, Analysis throughout the figure is of population-wide Ca2+ activity from all astrocytes in the FOV not directly stimulated by uncaging. b, Representative astrocytic GCaMP6f fluorescence (left) and spatial heat maps of Ca2+ changes in local astrocyte network (right) following GABA and glutamate uncaging. Pre- and post-uncaging periods: 150 s before and after uncaging. Activity in the uncaged cell (dark grey) is excluded. c, Top: Ca2+ from all recorded local networks; rows show mean ΔF/F traces from AQuA-detected events per local network. Networks sorted by onset time. Red line: time of NT uncaging. Greyed-out rows: networks without detected events. Bottom: binarized raster plots show frames with z scores ≥ 3 (threshold). Stacked bar graphs: proportion of local networks exhibiting ≥1 post-stimulus frame ≥ threshold (responder). Two-sided Fisher’s exact test compares the proportion of responders across conditions: P = 0.62 (GABA WT versus Cx43-floxed), 0.78 (glutamate WT versus Cx43-floxed), 0.75 (GABA WT versus glutamate WT). d, Top: example binarized raster plot from c. Green line: response onset for each network (first post-stimulus frame ≥ threshold). Bottom: example local network, showing onset latency (green) as time between NT uncaging and response onset, and post-onset frames ≥ threshold (black ticks). e, Onset latency. One-way analysis of variance compares onset latency across conditions. P = 0.82 (GABA), 0.89 (glutamate). f, Persistence of network-level responses (proportion of post-onset frames ≥ threshold). One-way analysis of variance followed by Tukey–Kramer test for each NT. GABA: P = 0.0010 (WT versus Cx43-floxed), 0.025 (WT versus CBX), 0.72 (Cx43-floxed versus CBX). Glutamate: P = 0.00034 (WT versus Cx43-floxed), 0.0032 (WT versus CBX), 0.98 (Cx43-floxed versus CBX). g, Sholl-like analysis. Grey circles: 50-µm bands. Yellow star: NT uncaging site. h, Ca2+ event frequency change in local network after NT uncaging. Permutation test to determine significance. Two-sided P values in Supplementary Table 6. i, Grid-based ROI (20 µm2). j, Distances from uncaging site to centre of ROIs active post-uncaging. Active ROIs: ROIs with ≥50% event frequency increase post-uncaging. n = 195 active ROIs (GABA), 171 active ROIs (glutamate) from 27 paired FOVs. k, Example FOV of ROIs with baseline events (left) and active ROIs post-uncaging (right). Yellow dot: NT uncaging site. l, Fraction of ROIs active (responding) following both GABA and glutamate uncaging, among all active ROIs for uncaging of either NT (black vertical line; 8.27 ± 1.34%, mean ± sem; n = 27 paired FOVs). One-sided P value compares observed overlap fraction (Jaccard index) to surrogate data (grey distribution). e,f, Data shown by responding network; median, and 25th and 75th percentiles. n = 28 networks, 7 slices, 4 mice (WT) in c,h, 63 networks, 16 slices, 8 mice (Cx43-floxed) in c, 21 networks responding to GABA and 23 to glutamate from 7 slices, 4 mice (WT); 42 networks responding to GABA and 47 to glutamate in 16 slices, 8 mice (Cx43-floxed); 24 networks responding to GABA and 24 to glutamate in 8 slices, 4 mice (CBX) in e,f. Scale bars, 50 µm (b,g,i). NS: P ≥ 0.05; *P < 0.05; **P < 0.01; ***P < 0.001.
Fig. 4
Fig. 4. Propagative activity distinguishes astrocyte network responses to GABA and glutamate.
a, Astrocytic GCaMP6f fluorescence with initial territory (left) and subsequent trajectory (right) of a propagating event in yellow. Outline: total event territory. b, Probability change of Ca2+ event growing in the depth axis (relative to pia) among all events from neighbouring cells after NT uncaging. Data shown as overall probability ± standard error (n = 142 cells, 28 FOV (GABA), 120 cells, 27 FOV (glutamate)). Two-sided P and q values by permutation testing (Supplementary Table 8). c, Two-photon image of in vivo astrocyte GCaMP6f in V1. Overlay: Ca2+ events from 90-s stationary period. d, Propagative event fraction in V1 during stationary wakefulness in vivo and baseline in acute V1 slices. Data shown by recording; median ± standard error by bootstrapping (n = 15 recordings, 5 mice (in vivo), 55 recordings, 4 mice (ex vivo)). Two-sided rank-sum test (P = 0.57). e,f,j, Schematic (e) and quantification of fold change in propagative event rate across neighbouring cells per FOV after NT uncaging in WT (f) or Cx43-floxed (j) slices. Data shown as median across FOVs ± standard error. One-sided P and q values by permutation testing (see Supplementary Tables 9 and 10). As in Fig. 3, directly stimulated astrocyte excluded from all figure analyses. g,h,k, Schematic (g) and quantification of fraction of neighboring cells per FOV with ≥50% propagative event rate increase (‘responding’) after NT uncaging in WT (h) or Cx43-floxed (k) slices. Data shown by FOV; mean ± sem (see Supplementary Table 9). Two-sided P values by permutation testing, P = 0.046 (WT), 1.0 (Cx43-floxed). i, Top: receiver operating characteristic curve decoding NT identity by thresholding relative propagative event rate change across all neighbouring cells per FOV. Bottom: observed area under the receiver operating characteristic curve (AUC) = 0.72 ± 0.077 (value ± bootstrapped standard error), compared to permuted distribution through permuting NT labels (P = 0.0025, n = 55 FOVs, one-sided). l, Neighbouring cell numbers responding to one or both NTs with propagative activity increases, among cells with baseline propagative activity (n = 56 cells, 24 paired recordings, 7 slices, 4 mice). Permutation testing measures of correlation (two-sided Spearman ρ, P = 0.24) or overlap (one-sided Jaccard index, P = 0.96) between GABA and glutamate responses. m, Fraction of neighbouring cells responding with propagative increases after NT uncaging, cells equally divided by low and high baseline activity features (split at 50th percentile). Baseline activity features: fraction of propagative events (left), overall event rate (right, see Extended Data Fig. 5e). Data shown as mean ± s.e.m. (see Supplementary Table 11). Response fractions for cells with ‘low’ and ‘high’ baseline fractions were compared by permuting cells’ baseline propagation fractions for GABA (P = 1.0 × 10–4) and glutamate (P = 0.0012); responses for cells with ‘low’ and ‘high’ overall baseline event rates were compared similarly (GABA: P = 0.25; glutamate: P = 0.25). n, Integrated model of astrocyte network responses. Astrocyte networks increase general Ca2+ with both NTs, and propagative activity specifically with glutamate. Network responses to glutamate are faster than those to GABA. b,f,h,j,k,m, error bars by hierarchical bootstrapping. b,f, *q < 0.05, **q < 0.01, ***q < 0.001, h,m, *P < 0.05, **P < 0.01. Scale bars, 10 μm (a,c (right)) and 50 μm (c (left)).
Extended Data Fig. 1
Extended Data Fig. 1. Different responses to activation of astrocytic glutamatergic and GABAergic receptors via pharmacological bath-application.
a, Ribosomal-mRNA expression in visual cortex astrocytes of P14 (n = 4 biological replicates) and P28 (n = 5 biological replicates) mice from the Farhy-Tselnicker et al. publicly available dataset (NCBI Gene Expression Omnibus, GSE161398). Visual cortex astrocytes show expression of GABAB receptors and mGluR3, but low expression of all other mGluRs, including mGluR5 (ref. ). Similar expression levels are found in the Srinivasan et al. dataset available at http://astrocyternaseq.org/. Ratio of FPKM for the gene of interest / FPKM for GFAP were calculated to normalize for potential differences in the sequencing depth of replicates. Center line: median; box limits: 25th and 75th percentiles; whiskers: minimum and maximum values. b, Baseline event frequency (events/60 s) for each active astrocyte prior to bath application of baclofen (50 µM, x-axis) and t-ACPD (50 µM, y-axis). Data shown by astrocyte (grey dots, from n = 4 slices) and mean (red dot). Dashed line = unity line. Baseline event frequencies prior to baclofen and t-ACPD application were compared for each astrocyte using a paired two-sided t-test (p = 0.14). c, Event frequency (events/60 s) for each active astrocyte 300–0 s before and 60–120 s after addition of agonist (50 µM). Data shown by astrocyte (light dots, from n = 4 slices) and mean (solid dots) for baclofen (pink) and t-ACPD (green). Dashed line = unity line; all astrocytes above the unity line display increased activity in presence of agonist. For b & c, 300–0 s before addition of agonist was used to calculate mean baseline event frequency per astrocyte; an active astrocyte is any cell with ≥ 1AQuA-detected event. Note the difference in axes between graphs in b & c, reflecting the low baseline event frequency for all astrocytes. d, Time-series traces of average ΔF/F in 30 s windows from active cells in each slice. 300–0 s before and 0–240 s after bath-application of agonist used to calculate event average ΔF/F /30 s. Data shown as mean ± sem (n = 4 slices, 4 mice stimulated with 50 μM agonist). Permutation test used to determine significance. One-sided p-values for all timepoints are in Supplementary Table 3. 0 s = frame of agonist entry into the imaging chamber. ΔF/F values were calculated using a moving 10 s baseline window, averaging the lower 50% of values in the window. Active cells were cells with ≥ 1 AQuA event detected in either the baclofen or t-ACPD recording. e, Left and center: Average ΔF/F before and after bath-application of baclofen (50 μM, left) and t-ACPD (50 μM, center). ΔF/F after bath-application of agonist is from the 30 s time window with the highest average ΔF/F for each slice (“peak post”). Right: Change in average ΔF/F after bath-application of agonist. Data shown as slices (light dots and grey lines, n = 4 slices, 4 mice) and mean ± sem (dark dots and error bars). Two-sided paired t-test compares conditions. Baclofen: p = 0.046, t-ACPD: p = 0.031 and Δ in ΔF/F: p = 0.033. f, Scatter plots of the area and duration of individual Ca2+ events 0–60 s (left) and 150–300 s (right) after bath-application of baclofen (top) or t-ACPD (bottom). Separating events into these two time-windows highlights events occurring early that are covered in Fig. 1d by those with longer onset latencies. Events following bath-application of agonists color-coded by onset time. Dots represent individual Ca2+ events from n = 4 slices stimulated with 50 µM agonist. Note: these are the same data, with the same onset latency color scale, as shown in Fig. 1d, bottom. g, Distributions of event area, duration and propagation 120–0 s before (“Pre”) or 0–120 s after addition of baclofen (50 μM) or t-ACPD (50 μM). One-way ANOVA followed by Tukey-Kramer Test determine significant pairwise comparisons between conditions. p-values in Supplementary Table 4. Note that, for all features, pre-baclofen, pre-tACPD, and baclofen events are not significantly different from one another. Only events following addition of t-ACPD show a rightward shift for all features. h, Experimental strategy for Pink Flamindo expression and 2 P imaging of astrocytic cAMP in acute cortical slices. i, Representative Pink Flamindo fluorescence in V1 FOV; dotted line denotes pia. j, Left: Percent of total astrocytes that increase fluorescence or show no change with bath-application of baclofen (top, pink) or mGluR3-specific agonist LY379268 (bottom, green) (n = 147 astrocytes) in the presence of TTX and CBX. Right: Average ∆F/F trace only from responsive cells in each slice (mean ± sem across slices from n = 54 responsive astrocytes [baclofen] and 123 responsive astrocytes [LY379268] from 8 slices, 3 mice). To capture steady-state changes, ∆F/F values were calculated using raw – background fluorescence and a fixed baseline window (frames 1–100), then lowpass filtered at 0.01 Hz. k, Top: Average Ca2+ or cAMP peaks/minute/astrocyte before and after bath-application of baclofen (pink) or LY379268 (green). Data shown as slices (grey lines) and corresponding mean ± sem. Two-sided paired t-test compares pre- and post-agonist values for each condition. P-values corrected for multiple comparisons using Bonferroni-Holm correction FWER ≤ 0.05. Baclofen: p = 0.019 (Ca2+) and 0.057 (cAMP). LY379268: p = 0.0017 (Ca2+) and 0.66 (cAMP). Bottom: Average change in Ca2+ or cAMP peaks/minute following bath-application of baclofen (pink) or LY379268 (green). Data shown by slice (light dots) and corresponding mean ± sem (dark dots and error bars). Two-sided rank sum tests compare Ca2+ and cAMP frequency changes for each agonist. p = 0.000082 (baclofen) and 0.000082 (LY379268). Cyto-GCaMP: n = 809 active astrocytes (baclofen) and 1033 active astrocytes (LY379268), 9 slices, 3 mice. Pink Flamindo: n = 147 astrocytes, 8 slices, 3 mice. To detect transient fluctuations, ∆F/F was calculated using a moving 10 s baseline window, with peaks determined for each astrocyte if ∆F/F ≥ 3 SD above mean baseline ∆F/F.
Extended Data Fig. 2
Extended Data Fig. 2. Characterization of, and controls for, increased Ca2+ activity in astrocytes directly stimulated by NT uncaging.
a, Average change in ΔF/F with laser uncaging control (laser stimulation without RuBis, grey, n = 46 astrocytes, 9 slices, 3 mice) and with uncaging in the presence of antagonist (RuBi-GABA + GABABR antagonist [magenta, n = 28 astrocytes, 8 slices, 5 mice] or RuBi-glutamate + mGluR2/3 antagonist [green, n = 28 astrocytes, 7 slices, 4 mice]). GABABR antagonized using CGP55845, a potent and selective GABABR antagonist, and mGluR3 antagonized using LY341495, a potent mGluR2/3 antagonist also known to antagonize other mGluR subtypes at higher concentrations. Data shown by astrocyte, median, 25th and 75th percentile. Wilcoxon signed-rank test compares change from baseline. p-values corrected for multiple comparisons using Bonferroni-Holm correction with FWER ≤ 0.05. Laser uncaging control: p = 0.50, RuBi-GABA + CGP55845: p = 0.11 and RuBi-glutamate + LY341495: p = 0.41. b, Event frequency change after NT uncaging (GABA: solid magenta lines, n = 27 astrocytes, 7 slices, 4 mice; glutamate: solid green lines, n = 24 astrocytes, 7 slices, 4 mice), NT uncaging in the presence of antagonist (dotted magenta and green lines), and laser uncaging control (dotted black line). 90–0 s before and 0–150 s after uncaging used to calculate event number/30 s. Data shown by mean ± sem. Permutation test used to determine significance. p-values in Supplementary Table 5. c,d, Baseline fluorescence (c) and event frequency (d) prior to GABA and glutamate uncaging. 90–0 s before uncaging used to calculate mean ∆F/F (c) and mean number of events/30 s (d) per cell. Data shown by cell (grey dots, n = 24 astrocytes), median, and 25th and 75th percentile (black dots and crosshairs). Dashed line = unity line. Wilcoxon signed-rank tests show no significant difference between baseline features of directly stimulated astrocytes prior to GABA and glutamate uncaging (p = 0.089 [c, baseline fluorescence], 0.068 [d, baseline event frequency]). e, Distribution of event area and duration pre- and post-uncaging of RuBi-GABA (left) and RuBi-glutamate (right) from “responder” uncaging cells. Detected events 120 s pre- and post-uncaging are included from n = 19 astrocytes, 7 slice, 4 mice (GABA), 21 astrocytes, 7 slices, 4 mice (glutamate). Rank-sum test compares pre- and post-uncaging event features. Area: p = 0.58 (GABA) and 0.95 (glutamate). Duration: p = 0.083 (GABA) and 0.13 (glutamate). f, Event frequency in responding astrocytes directly stimulated with NT. Events from directly stimulated astrocytes separated into events near and far from GABA and glutamate uncaging. 90–0 s before used to calculate average event number/30 s (“pre-stim”). Data shown by cell (light dots and grey lines) and mean ± sem (dark dots and error bars). All statistical tests are two-sided.
Extended Data Fig. 3
Extended Data Fig. 3. Confirmation of Cx43 knockdown and network-level controls after NT uncaging.
a, Ribosomal-mRNA expression in visual cortex astrocytes of P28 mice (n = 5 biological replicates) from the Farhy-Tselnicker et al. publicly available dataset (NCBI Gene Expression Omnibus, GSE161398). Visual cortex astrocytes preferentially express Cx43 (Gja1) over other connexins, including Cx30 (Gjb6). Similar expression levels are found in the Srinivasan et al. dataset available at http://astrocyternaseq.org. Ratio of FPKM for the gene of interest / FPKM for GFAP were calculated to normalize for potential differences in the sequencing depth of replicates. Center line: median; box limits: 25th and 75th percentiles; whiskers: minimum and maximum values. b, Representative micrographs of immunohistochemistry in a Cx43fl/+ slice demonstrating reduced numbers of Cx43 puncta in Cre+ astrocytes. White arrow points to individual cell expressing GCaMP (green) and RFP-Cre (red), with reduced Cx43 (blue). c, Average Cx43 puncta/astrocyte in RFP-Cre and RFP-Cre+ astrocytes; puncta counts are normalized by area of each astrocyte. Data are shown by mouse averages (light dots, error bars and connecting lines, grey = Cx43fl/+ and red = Cx43fl/fl mice) and mean ± sem (dark dots and error bars). Cx43 puncta counts were similar for Cx43fl/+ and Cx43fl/fl mice; data from both genotypes were pooled together for all analyses and referred to as Cx43floxed (n = 8 mice). Paired two-sided t-test compares average Cx43 puncta counts in RFP-Cre and RFP-Cre+ astrocytes. p = 0.00013. d, Average change in ∆F/F in WT astrocyte networks after RuBi-GABA (magenta) and RuBi-glutamate (green) uncaging. Data shown by trial/FOV, median and 25th and 75th percentile. Wilcoxon signed-rank test compares change from baseline. p = 0.016 (GABA) and 0.00032 (glutamate). e,f, Distribution of event area and duration pre- and post-uncaging of RuBi-GABA (top) and RuBi-glutamate (bottom). Detected events 120 s pre- and post-uncaging are included. Rank-sum test compares pre- and post-uncaging event features. Area: p = 0.025 (GABA) and 0.0050 (glutamate). Duration: p = 0.063 (GABA) and 0.0000045 (glutamate). g,h, Event frequency change in neighboring astrocytes after GABA (g, top) and glutamate (g, bottom) uncaging in WT and Cx43floxed slices. WT data from g replotted in h (circular markers) with laser uncaging control (laser stimulation without RuBis, dotted black line and triangular markers) and with uncaging in the presence of antagonist (RuBi-GABA + GABABR antagonist [magenta line and square markers] or RuBi-glutamate + mGluR2/3 antagonist [green line and square markers]). 90–0 s before and 0–150 s after uncaging used to calculate event number/30 s in neighboring astrocytes with ≥ 1 AQuA-detected event. Data shown by mean ± sem. Permutation test used to determine significance. p-values in Supplementary Table 7. i, Total number of AQuA-detected events in 50 µm bands radiating out from the uncaging site. All events 90 s before and 150 s after NT uncaging are included. Data shown by trial/FOV, median and 25th and 75th percentile. j, Distribution of relative event rates from 20×20 µm ROIs following uncaging of RuBi-GABA (left) and RuBi-glutamate (right). Validation for threshold used to define ROIs with increased activity post-uncaging; chosen threshold: ≥ 50% event frequency increase post-uncaging. n = 28 networks, 7 slices, 4 mice (WT) in di, 61 networks, 16 slices, 8 mice (Cx43floxed) in g,h, 48 networks, 9 slices, 3 mice (laser uncaging control), 32 networks, 8 slices, 5 mice (RuBiGABA + GABABR antagonist), 28 networks, 7 slices, 4 mice (RuBi-glutamate + mGluR2/3 antagonist) in h. All statistical tests are two-sided.
Extended Data Fig. 4
Extended Data Fig. 4. Change in individual astrocyte Ca2+ event features post NT-uncaging.
a, Fold change in indicated Ca2+ event features among all events from all neighboring cells after GABA or glutamate uncaging, relative to 60–0 s pre-uncaging. Data shown as overall mean ± sem determined from hierarchical bootstrapping (see Methods). Two-sided p- and q-values for changes versus baseline were obtained by circularly shifting each cell’s events in time (see Methods; Supplementary Table 12). b, Change in the probability of a Ca2+ event growing or shrinking in the indicated direction among all events from neighboring cells after GABA or glutamate uncaging, relative to 60–0 s pre-uncaging. Data shown as overall probability ± standard error determined from hierarchical bootstrapping (see Methods). Two-sided p- and q-values for changes versus baseline were obtained by circularly shifting each cell’s events in time (see Methods; Supplementary Table 13). n = 142 cells in 28 FOV [GABA], 120 cells in 27 FOV [glutamate] in a,b.
Extended Data Fig. 5
Extended Data Fig. 5. Validating changes in propagative event activity following NT-uncaging.
a, Representative spatial maps of Ca2+ events in the same astrocyte network 0–120 s after GABA (left) or glutamate (right) uncaging. Events are color-coded by onset time. Black dot = NT uncaging site. Events from all time-points are distributed throughout the imaging field, with no visible wavefront of activity traveling across the imaging field or emanating from the uncaging site. Note that all panels except for (f) are data from WT slices. b, Raster plots of Ca2+ event onsets for static (left) or propagative (right) events before and after GABA (magenta) or glutamate (green) uncaging. Raster plots show all neighboring cells (astrocytes not directly stimulated by NT-uncaging) from all FOVs, with each row showing events from an individual astrocyte. Within each NT and event type, cells were sorted by the overall rate of static events from 0–120 s post-uncaging (i.e., the same sorting was used for the left and right raster plots). Grey line = NT uncaging start. c, Scatter plots of event rates (event number/30 s) within neighboring cells during the period 60–0 s pre-uncaging (x-axis) versus 0–120 s post-uncaging (y-axis). Rates of propagative (left) and static (right) events are shown for recordings of GABA (top) and glutamate (bottom) uncaging. Dots are individual neighboring cells; darker dots indicate multiple overlapping cells. d, Distribution of post-/pre-uncaging ratio of static (grey) or propagative (color) event rates among neighboring cells with any baseline events of the corresponding type, after GABA (magenta, top) or glutamate (green, bottom) uncaging. Ratios computed per-cell as the rate from 0–120 s post-uncaging divided by the rate from 60–0 s pre-uncaging. Vertical black lines indicate the threshold used to determine “responding” cells in Fig. 4h, l, m and Extended Data Fig. 6e (i.e., ≥ 1.5-fold). e, Top: Distribution of the fraction of events during the baseline window (60–0 s pre-uncaging) that were propagative in each neighboring cell before GABA (magenta) or glutamate (green) uncaging, among those cells that had any baseline propagative activity. Vertical magenta and green lines indicate the thresholds (50th percentile) for recordings of GABA and glutamate uncaging, respectively, used in Fig. 4m left to delineate “Low” and “High” fraction of propagative events at baseline among neighboring cells. Bottom: Distribution of the overall event rate during the baseline window of 60–0 s pre– GABA (magenta) or glutamate (green) uncaging, in each neighboring cell that had baseline propagative activity. Vertical magenta and green lines indicate the thresholds (50th percentile) for recordings of GABA and glutamate uncaging, respectively, used in Fig. 4m right to delineate cells with “Low” and “High” overall event rates at baseline. f, Baseline propagative (left) and static (right) event frequencies of astrocytes in WT or Cx43floxed slices. Baseline period: 90–0 s prior to uncaging. Individual data points show average event rate from active neighboring astrocytes ( ≥ 1 AQuA-detected event during recording) for each FOV. Data shown by FOV (WT: n = 28 FOV for GABA and glutamate, 7 slices, 4 mice; Cx43floxed: n = 63 FOV for GABA and 61 FOV for glutamate, 16 slices, 8 mice), median, 25th and 75th percentile. Wilcoxon rank sum test compares WT and Cx43floxed baseline event frequencies (GABA: p = 1.6e-10 [propagative], 7.7e-14 [static]; glutamate: p = 9.0e-7 [propagative], 1.1e-12 [static]). g, Baseline propagative (left) and static (right) event frequencies in WT networks prior to GABA and glutamate uncaging. 90–0 s before uncaging used to calculate mean number of events/30 s. Event rate per FOV calculated by averaging the event rates of active astrocytes in the FOV ( ≥ 1 AQuA-detected event during the recording), excluding the uncaging astrocyte. Data shown by FOV (grey dots, n = 28), median, 25th and 75th percentile (black dot and crosshairs). Wilcoxon signed-rank test compares baseline event frequencies prior to GABA and glutamate uncaging (p = 0.00022 [propagative] and 0.052 [static]). h, Spearman correlation between baseline propagative event rate and relative post-stim propagative event rate for neighboring cells in GABA (magenta) and glutamate (turquoise) recordings. Data shown by individual neighboring astrocyte (for h–i, n = 121 cells [GABA], 91 cells [glutamate] with ≥ 1 baseline propagative event); solid lines: linear regression lines. For h–i, 60–0 s before uncaging used for baseline window and relative post-stim propagative rate calculated as in d. i, Spearman correlation between fraction of propagative events at baseline and relative post-stim propagative event rate for neighboring cells in GABA (left) and glutamate (right) recordings. Data shown by individual neighboring astrocyte color-coded by baseline activity composition category (“low” in magenta or turquoise, “high” in grey). Light grey horizontal line = response threshold (responders ≥ 1.5-fold increase in propagative activity from baseline). Note a majority of astrocytes responding to either NT (at or above the response threshold line) display a low fraction of propagative events at baseline. j, Propagative event frequency pre- and post-uncaging for neighboring cells with “low” and “high” fractions of propagative events at baseline (as for Fig. 4m, left). 60–0 s before (“Pre”) and 0–120 s after (“Post”) used to calculate average event number/30 s. Data shown by cell (light dots and grey lines; n = 61 cells [GABA “low”], 60 cells [GABA “high”], 46 cells [glutamate “low”], 45 cells [glutamate “high”]) and mean ± sem (dark dots and error bars). Wilcoxon signed-rank test compare pre-and post-stim frequencies for each category. k, Contextualization of observed differences in response fraction among neighbor cells, between low and high fraction of propagative events at baseline, compared with surrogate distribution from structured point process simulations. The fraction of simulations with low–high differences larger than the observed difference is indicated. Note limitations on direct comparison between observed values and simulation results (Methods). All statistical tests are two-sided.
Extended Data Fig. 6
Extended Data Fig. 6. Static activity changes in the local astrocyte network are similar in response to GABA and glutamate.
a, Analysis schematic illustrating average static activity change across all neighboring cells in the local network, as reported in b and c. Heterogeneous responses of individual neighboring cells are averaged in b and c. bc, Fold-change in rate of static Ca2+ events among neighboring cells after GABA or glutamate uncaging in acute slices from WT mice (b) or Cx43floxed mice (c), relative to 60–0 s pre-uncaging. Data shown as median across FOVs ± standard error via hierarchical bootstrapping (Methods; n in Supplementary Table 9). One-sided p- and q-values were obtained via circular permutation testing (Methods; Supplementary Table 10); *: q < 0.05, **: q < 0.01. d, Analysis schematic illustrating the fraction of neighboring cells per FOV that respond to NT with increases in static activity, as reported in e and f. ef, Fraction of neighboring cells per FOV with ≥ 50% increase in static Ca2+ events (responding) after GABA or glutamate uncaging in WT (e) or Cx43floxed slices (f). Data shown as mean ± sem via hierarchical bootstrapping; dots denote individual FOVs (see Methods; n in Supplementary Table 9). Permutation testing was used to compare fraction of cells responding to GABA and glutamate in WT slices (two-sided p = 1.0) and Cx43floxed slices (two-sided p = 1.0).
Extended Data Fig. 7
Extended Data Fig. 7. Individual neighboring astrocytes exhibit variable Ca2+ responses across multiple rounds of glutamate uncaging in WT networks.
a, GluSnFR event features after RuBi-glutamate uncaging for three types of uncaging datasets. For number of events/uncaging site (left), data shown by uncaging trial, median, 25th and 75th percentile. For GluSnFR event area (right), data shown by GluSnFR event, median, 25th and 75th percentile (single round glutamate uncaging: n = 72 trials, 12 recordings, 4 slices, 2 mice; multi-round glutamate uncaging: n = 66 trials, 11 recordings, 2 slices, 1 mouse; RuBi-glutamate uncaging control: n = 66 trials, 11 recordings, 2 slices, 1 mouse). For number of events, one-way ANOVA followed by Tukey-Kramer Test determine significant pairwise comparisons between laser stimulation conditions. p = 9.7e-10 (single round glutamate uncaging v multi-round glutamate uncaging), 9.6e-10 (single round glutamate uncaging v RuBi-glutamate uncaging control) and 9.6e-10 (multi-round glutamate uncaging vs RuBi-glutamate uncaging control). For event area, rank sum test compares single round glutamate uncaging vs. multi-round glutamate uncaging, p = 3.6e-10. All datasets were collected in the presence of RuBi-glutamate. For single round and multi-round glutamate uncaging, the uncaging laser power was set to 70 A.U. (~8 mW at the sample). Laser re-alignment between these datasets leads to a small difference in amount of glutamate uncaged with laser stimulation (see event area on right). For RuBi-glutamate uncaging controls, the uncaging laser power was set to 25 A.U. (~2 mW at the sample), a stimulation that did not lead to detectable glutamate uncaging (see event number on left). b, Distance of Cyto-GCaMP-expressing neighboring astrocytes from the glutamate uncaging site. Distance measured from the centroid of each neighboring astrocyte to the centroid of the uncaging site. Data shown by active astrocyte (≥1 AQuA-detected event 0–300 s from recording onset), median, 25th and 75th percentile (single round glutamate uncaging: n = 28 FOV, 7 slices, 4 mice; multi-round glutamate uncaging: n = 23 FOV, 9 slices, 5 mice). Rank sum test compares datasets; p = 3.4e-15. c, Correlation between the propagative Ca2+ responses of individual neighboring cells to multiple rounds of glutamate uncaging. Individual cells’ binary responses to glutamate uncaging are not significantly correlated across rounds (Spearman rho = 0.040, p = 1.0, n = 32 cells, 15 recordings, 8 slices, 5 mice [round 1 vs 2]; Spearman rho = 0.14, p = 0.70, n = 30 cells, 16 recordings, 7 slices, 5 mice [round 1 vs 3]; Spearman rho = 0.059, p = 0.74, n = 38 cells, 17 recordings, 8 slices, 5 mice [round 2 vs 3]), showing that the response of an individual cell is variable from round to round. In each round, activity was recorded 150–0 s before and 0–600 s following uncaging, with glutamate uncaged over an area of ~12 µm2 (as in a, right “Multi-round glutamate uncaging”). Rounds of imaging/uncaging for each FOV were separated by ≥ 25 min. Cells included in analysis for each round had ≥ 1 propagative event during 60–0 s before uncaging. Responding cells exhibited ≥ 50% increase in propagative event frequency 300–420 s following uncaging, a time window in which activity began to increase across rounds, compared to 60–0 s before uncaging. d, Event frequency change in neighboring astrocytes across three rounds of glutamate uncaging (top) and RuBi-glutamate uncaging controls (bottom). 90–0 s before and 0–570 s after uncaging used to calculate mean event number/30 s in active astrocytes (astrocytes in the local network with ≥1 AQuA-detected event during recording, excluding the stimulated cell). Data shown by mean ± sem (multi-round glutamate uncaging: n = 23 FOV for Round 1 and 3, 21 FOV for Round 2, 9 slices, 5 mice; RuBi-glutamate uncaging control: n = 20 FOV, 8 slices, 5 mice). Permutation test used to determine significance. p-values in Supplementary Table 14. The responses in multi-round glutamate uncaging are delayed compared to the single round glutamate uncaging dataset (Extended Data Fig. 3g). Two factors may account for this delay. First, less NT is released in the multi-round glutamate uncaging dataset (a). Second, the distance of astrocytes in the local network from the uncaging site is greater in the multi-round uncaging dataset compared to the single round uncaging dataset (b). e, Baseline event frequencies for neighboring astrocytes across three rounds of glutamate uncaging. 90–0 s before uncaging used to calculate mean event number/30 s/active astrocytes in each FOV. Data shown by FOV (light grey lines, n = 21 FOV, 9 slices, 5 mice) and mean ± sem (black dots and error bars). Repeated measures ANOVA compares baseline frequencies across rounds (F(2,40) = 1.51, p = 0.23). All statistical tests are two-sided.

Update of

References

    1. Poskanzer KE, Yuste R. Astrocytes regulate cortical state switching in vivo. Proc. Natl Acad. Sci. USA. 2016;113:E2675–E2684. doi: 10.1073/pnas.1520759113. - DOI - PMC - PubMed
    1. Mariotti L, Losi G, Sessolo M, Marcon I, Carmignoto G. The inhibitory neurotransmitter GABA evokes long-lasting Ca2+ oscillations in cortical astrocytes. Glia. 2016;64:363–373. doi: 10.1002/glia.22933. - DOI - PMC - PubMed
    1. Bindocci E, et al. Three-dimensional Ca2+ imaging advances understanding of astrocyte biology. Science. 2017;356:eaai8185. doi: 10.1126/science.aai8185. - DOI - PubMed
    1. Di Castro MA, et al. Local Ca2+ detection and modulation of synaptic release by astrocytes. Nat. Neurosci. 2011;14:1276–1284. doi: 10.1038/nn.2929. - DOI - PubMed
    1. Vaidyanathan TV, Collard M, Yokoyama S, Reitman ME, Poskanzer KE. Cortical astrocytes independently regulate sleep depth and duration via separate GPCR pathways. eLife. 2021;10:e63329. doi: 10.7554/eLife.63329. - DOI - PMC - PubMed

Publication types