. 2024 May;629(8011):481-488.
doi: 10.1038/s41586-024-07331-1. Epub 2024 Apr 17.

Promiscuous G-protein activation by the calcium-sensing receptor

Affiliations

Promiscuous G-protein activation by the calcium-sensing receptor

Hao Zuo et al. Nature. 2024 May.

Abstract

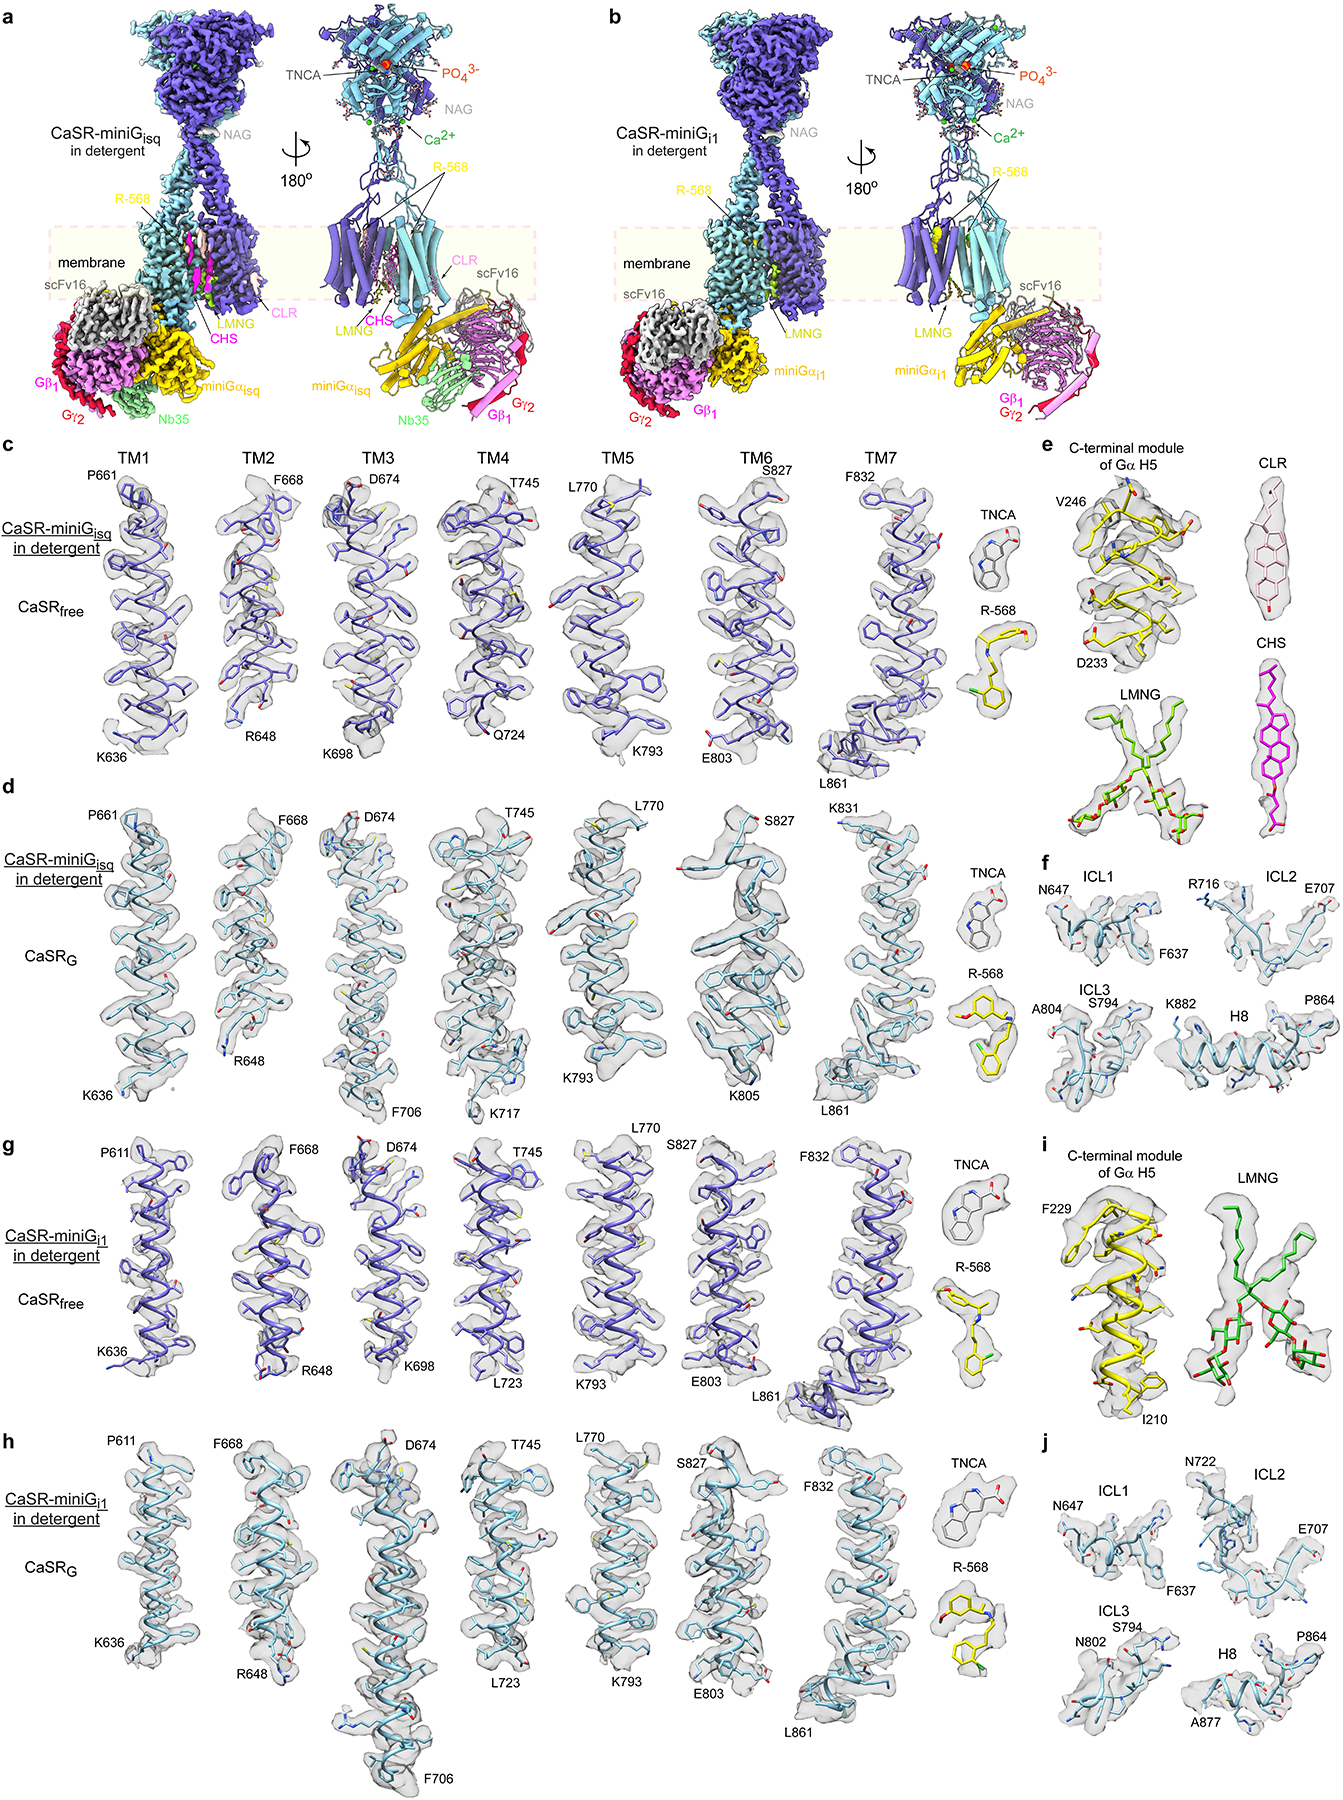
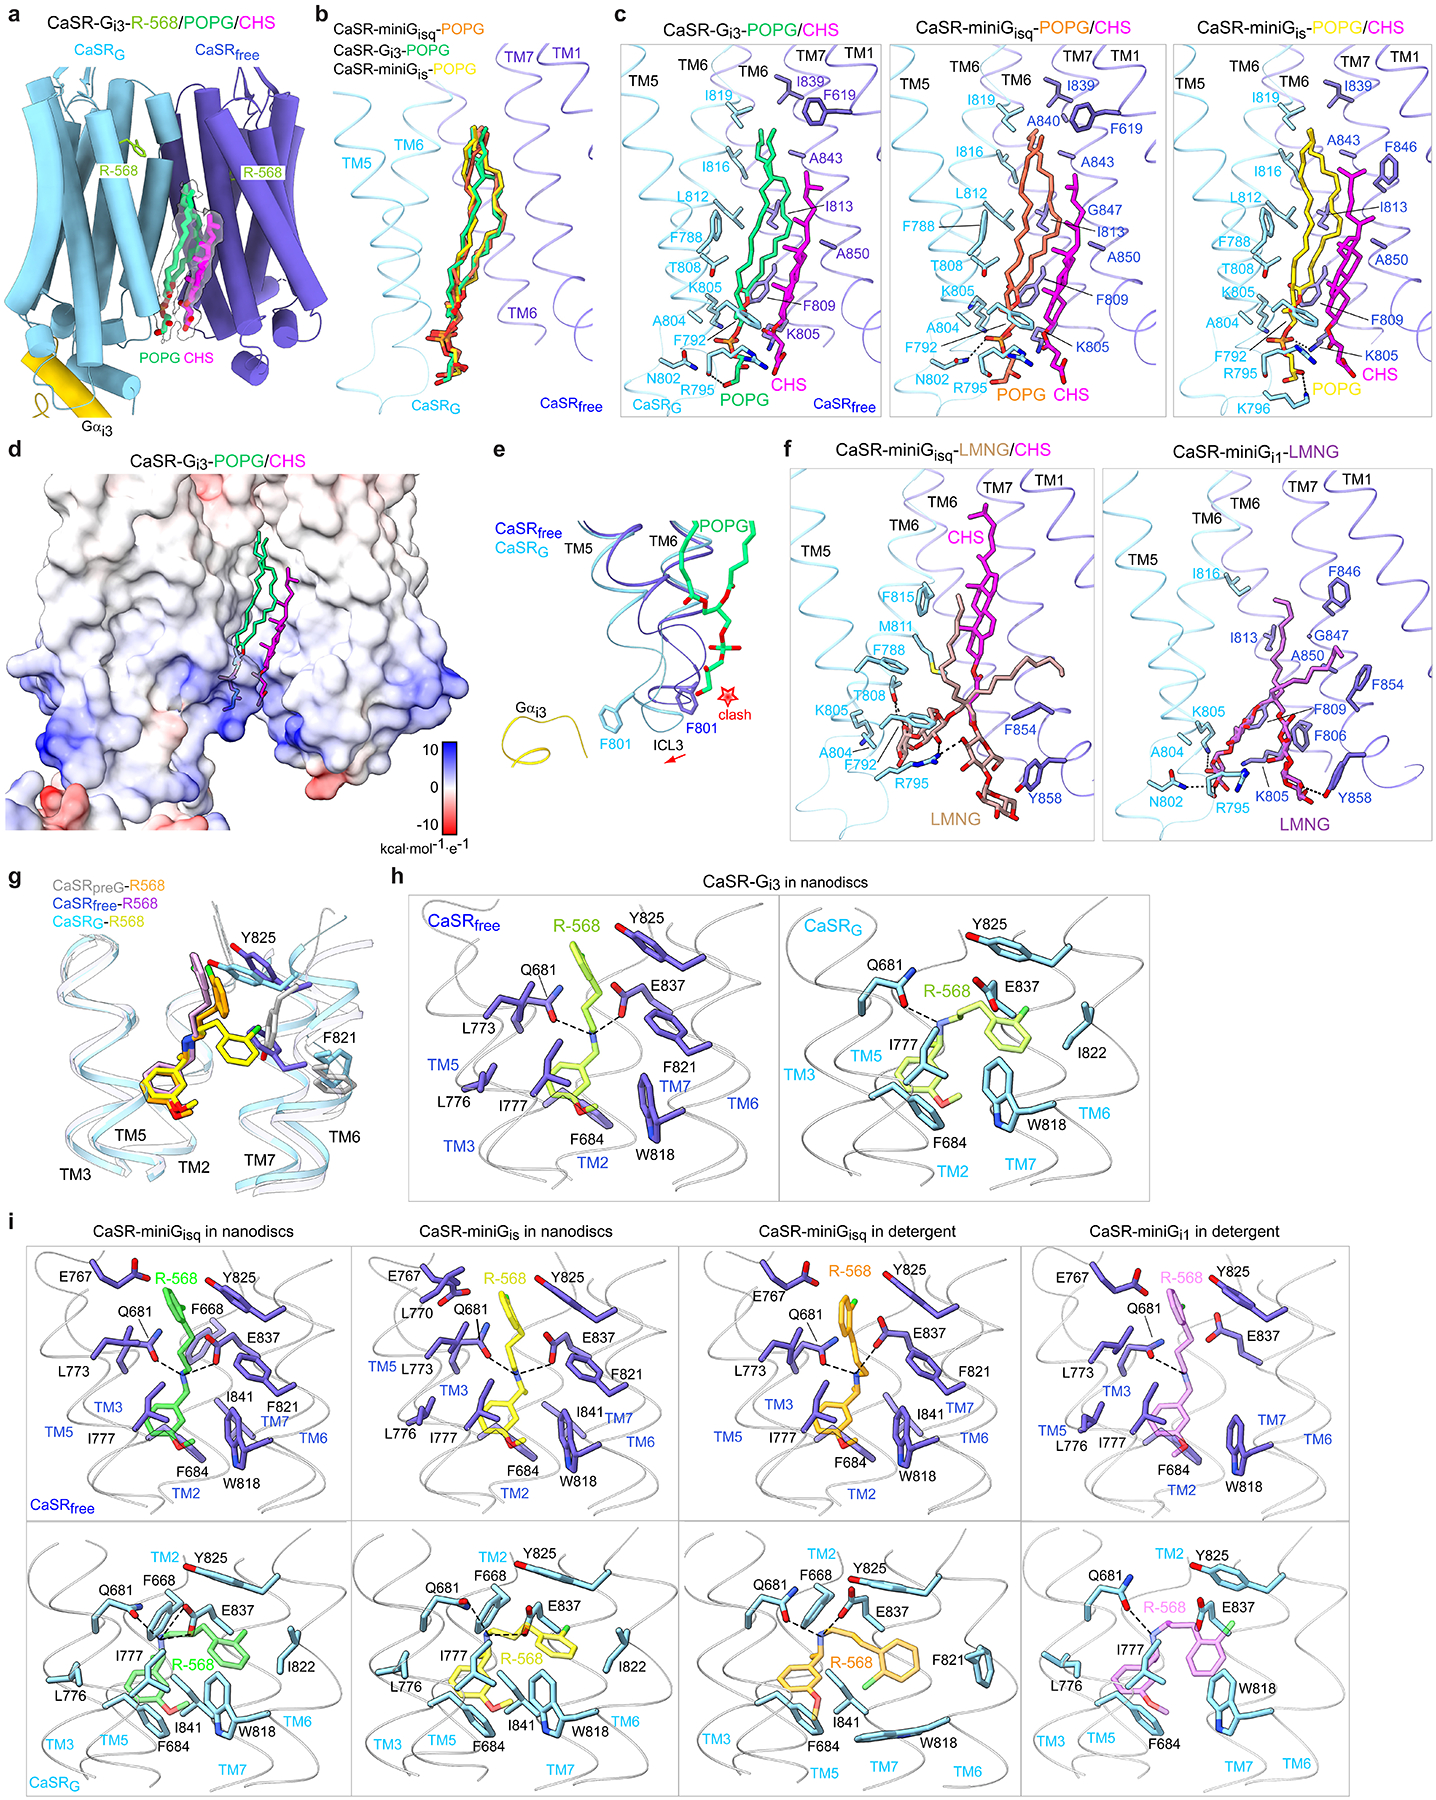
The human calcium-sensing receptor (CaSR) detects fluctuations in the extracellular Ca2+ concentration and maintains Ca2+ homeostasis1,2. It also mediates diverse cellular processes not associated with Ca2+ balance3-5. The functional pleiotropy of CaSR arises in part from its ability to signal through several G-protein subtypes6. We determined structures of CaSR in complex with G proteins from three different subfamilies: Gq, Gi and Gs. We found that the homodimeric CaSR of each complex couples to a single G protein through a common mode. This involves the C-terminal helix of each Gα subunit binding to a shallow pocket that is formed in one CaSR subunit by all three intracellular loops (ICL1-ICL3), an extended transmembrane helix 3 and an ordered C-terminal region. G-protein binding expands the transmembrane dimer interface, which is further stabilized by phospholipid. The restraint imposed by the receptor dimer, in combination with ICL2, enables G-protein activation by facilitating conformational transition of Gα. We identified a single Gα residue that determines Gq and Gs versus Gi selectivity. The length and flexibility of ICL2 allows CaSR to bind all three Gα subtypes, thereby conferring capacity for promiscuous G-protein coupling.


Conflict of interest statement

Competing interests: The authors declare no competing interests.

Figures

Extended Data Fig. 1 |
Extended Data Fig. 1 |. Purification and cryo-EM imaging of CaSR-G-protein complexes.
a-e, Size exclusion chromatography profile (left), SDS-PAGE (middle), and representative 2D class averages (right) of purified CaSR-miniGisq in nanodiscs (a), CaSR-miniGisq in detergent (b), CaSR-Gi3 in nanodiscs (c), CaSR-miniGi1 in detergent (d), and CaSR-miniGis in nanodiscs (e). All samples were assayed on SDS-PAGE under reducing and non-reducing conditions. The presence of dithiothreitol (DTT) reduced the disulfide-linked CaSR homodimer to monomer. Samples of the CaSR-G-protein complex before nanodisc assembly, along with MSP2N2 protein, were included as controls on SDS-PAGE (last two lanes in a, c, and e). For gel source data, see Supplementary Fig. 1.
Extended Data Fig. 2 |
Extended Data Fig. 2 |. Cryo-EM image processing of CaSR-G-protein complexes.
Schematic of cryo-EM data processing workflow used to generate reconstructions of CaSR-miniGisq in nanodiscs, CaSR-miniGisq in detergent, CaSR-Gi3 in nanodiscs, CaSR-miniGi1 in detergent, and CaSR-miniGis in nanodiscs.
Extended Data Fig. 3 |
Extended Data Fig. 3 |. Cryo-EM reconstruction analysis.
a, Locally refined density maps corresponding to the ECD (top), TMD (middle) and G-protein regions (bottom) for each of the five CaSR-G-protein complexes. Maps are colored according to local resolution. b-f, Fourier Shell Correlation (FSC) curves (purple) corrected by high-resolution noise substitution for local refinement maps of ECD (left), TMD (middle), and G protein (right) of CaSR-miniGisq in nanodiscs (b), CaSR-miniGisq in detergent (c), CaSR-Gi3 in nanodiscs (d), CaSR-miniGi1 in detergent (e) and CaSR-miniGis in nanodiscs (f). Curves reaching the FSC cut-off value of 0.143 (blue line) determine the estimated resolution for the corresponding density.
Extended Data Fig. 4 |
Extended Data Fig. 4 |. Structural models and cryo-EM density of CaSR-G-protein complexes reconstituted in nanodiscs.
Structural models of helices, loops and ligands within corresponding densities of the CaSR-miniGisq (a-d), CaSR-Gi3 (e-h) and CaSR-miniGis (i-l) complexes in nanodsics. Residue labels signify the start and end of each helix or loop. CaSRfree (a, e, i) and CaSRG (b, f, j) TMD helices are displayed in blue and cyan, respectively, along with the co-agonist TNCA (gray) and PAM R-568 (yellow) in the corresponding subunit. The C-terminal module of Gα H5 helix (yellow), POPG (green), and CHS (magenta) are presented in (c), (g) and (k). CaSRG intracellular loops (ICL1, 2, 3) are shown in cyan in (d), (h) and (l). An ordered H8 helix is shown in cyan in (h). The density for CaSRfree TMD helices are displayed at contour levels of 0.3–0.5 (a), 0.1 (e), and 0.35 (i), while CaSRG TMD helices are contoured at 0.23–0.5 (b), 0.1 (f), and 0.35 (j). TNCA is contoured at 0.5 (a, b), 0.3 (e, f), and 0.35 (i, j), while R-568 is contoured at 0.18–0.3 (a, b), 0.01 (e, f), and 0.13–0.35 (i, j). POPG is contoured at 0.3 (c), 0.05 (g), and 0.15 (k). CHS is contoured at 0.3 (c), 0.1 (g), and 0.1 (k). The CaSRG ICLs are contoured at 0.15 in all complexes (d, h, l). The CaSRG H8 helix is contoured at 0.15 (h). The C-terminal module of Gα H5 helix is contoured at 0.5 (c), 0.3 (g), and 0.35 (k).
Extended Data Fig. 5 |
Extended Data Fig. 5 |. Structural models and cryo-EM density of detergent-solubilized CaSR-G-protein complexes.
a, b, Cryo-EM density map (left) and structural model (right) of CaSR in complex with miniGisq (a), or miniGi1 (b). Each complex is solubilized in detergent and composed of the CaSRfree (blue), CaSRG (cyan), Gα (yellow), Gβ (violet) and Gγ (crimson) subunits. The nanobody Nb35 (light green) and single-chain antibody fragment scFv16 (dark gray) were used to stabilize the heterotrimeric G protein. The bound CaSR ligands include TNCA (gray), Ca2+ (green), PO43- (orange), and R-568 (yellow). An LMNG detergent (lime) is found at the TMD dimer interface. Multiple cholesterol (CLR, pink) and CHS (magenta) molecules surround the TMDs in the CaSR-miniGisq complex. N-linked glycans (NAG, light gray) are attached to the ECD. c-j, Structural models of helices, loops and ligands within corresponding densities of the CaSR-miniGisq (c-f) and CaSR-miniGi1 (g-j) complexes in detergent. Residue labels signify the start and end of each helix or loop. CaSRfree (c, g) and CaSRG (d, h) TMD helices are displayed in blue and cyan, respectively, along with the co-agonist TNCA (gray) and PAM R-568 (yellow) in the corresponding subunit. The C-terminal module of Gα H5 helix (yellow), LMNG (lime), CLR (pink) and CHS (magenta) are presented in (e) and (i). CaSRG intracellular loops (ICL1, 2, 3) and H8 helix are shown in cyan in (f) and (j). The density for CaSRfree TMD helices are displayed at contour levels of 0.2–0.3 (c) and 0.15–0.35 (g), while CaSRG TMD helices are contoured at 0.1–0.3 (d) and 0.15 (h). TNCA is contoured at 0.5 (c, d) and 0.3–0.35 (g, h), while R-568 is contoured at 0.2 (c, d) and 0.1–0.15 (g, h). LMNG is contoured at 0.2 (e) and 0.15 (i). Both CHS and CLR are contoured at 0.2 (e). The CaSRG ICLs are contoured at 0.15 in all complexes (f, j). The CaSRG H8 helix is contoured at 0.25 (f) and 0.15 (j). The C-terminal module of Gα H5 helix is contoured at 0.3 (e) and 0.35 (i).
Extended Data Fig. 6 |
Extended Data Fig. 6 |. CaSR dimer arrangement pre- and post-G-protein coupling.
a, Alignment of CaSR ECD (left) and TMD (right) of PAM-bound CaSRpreG (cyan; PDB: 7SIL) and CaSR-Gi3 complex in nanodiscs (lime). b, Alignment of CaSR ECD (left) and TMD (right) of CaSR-miniGisq (orange), CaSR-Gi3 (lime) and CaSR-miniGis (yellow) complexes in nanodiscs. c, TMD dimers of CaSR structures along its activation pathway. Elements at the TMD dimer interface are depicted in color during evolution from the inactive state to the G-protein-bound fully active state as agonist, PAM and finally G protein are added. d, Superposition of one CaSRpreG subunit (cyan; PDB: 7SIL) onto CaSRfree of CaSR-Gi3 complex. Side (left) and top (right) views of the alignment show the S8206.52 side chain (lime) of CaSRG has space to remain adjacent to the inward-flipped F8216.53 of CaSRfree (gray), but would clash with the outward F8216.53 of CaSRpreG (red star). This would prevent TM6 helices of both subunits from remaining kinked at this position. e, Alignment of CaSRfree (blue) and CaSRG (cyan) VFT modules from the CaSR-Gi3 complex. Red arrows illustrate the pivot of the corresponding CaSRG TMD toward the vertical dimer axis relative to CaSRfree, resulting in a shift of the CaSRG TM6 toward the extracellular membrane. f, The CaSR TM6-TM6 interface of CaSR-Gi3 complex in a full-on side view. The Cα atoms of TM6 residues from CaSRfree (blue) are joined to their counterparts in CaSRG (cyan) by dashed lines to show the relative displacement of CaSRG TM6 toward the extracellular membrane. This persists up until the shallow ECL3 in CaSRG allows the CaSRfree ECL3 to reach a similar elevation. Solid lines for G830ECL3 Cα and N802ICL3 Cα pairs run nearly parallel to the membrane due to their positions being at the same level between the CaSRfree and CaSRG subunits. g, Close-up views of the CaSR ECL2 and ECL3 in the PAM R-568-bound CaSRpreG structure (PDB: 7SIL) alongside CaSR-miniGisq, CaSR-Gi3 and CaSR-miniGis complexes in nanodiscs. Orientations of L756ECL2, E757ECL2 and Y829ECL3 side chains are shown in each structure. Y829ECL3(G) mediates the interaction between ECL3 and ECL2 of CaSRG and may play a role in stabilizing specific loop conformations within this subunit. h, The CaSR-miniGisq, CaSR-Gi3 and CaSR-miniGis complexes, each with its CaSRG TMD and bound G protein duplicated and aligned onto CaSRfree as an outline depiction. The actual G protein (colored) bound to CaSRG yields a clash with its imaginary partner through their Gαs-derived hgh4 regions in the cases of CaSR-miniGisq and CaSR-miniGis. Additional clashes with s6h5, HG and H4 occur in the case of CaSR-miniGis. The hgh4 loops in native Gαq and Gαi are 12–13 residues shorter than in Gαs. The CaSR-Gi3 complex does not show such clash, consistent with a shorter hgh4 loop.
Extended Data Fig. 7 |
Extended Data Fig. 7 |. CaSR interaction with G protein.
a, Functional analysis of CaSR ICL2 deletion mutants lacking three to ten residues near its C-terminal end. Ca2+-induced activation of Gq, Gi3 and Gi1 were measured using BRET assay. b, Un-corrected IP1 accumulation data collected from assay buffer alone or HEK293 T/17 cells transfected with wild-type CaSR or pcDNA3.1. The vertical orange line marks 8 mM Ca2+, which is chosen as the maximum Ca2+ dose in our IP1 experiments. c, Functional analysis of CaSR ICL2 deletion mutants lacking one to ten residues around its turning point or near its C-terminal end. Ca2+-induced IP1 accumulation through wild-type and mutant CaSR was measured in Gαq/11-knockout HEK293 cells co-transfected with Gαq, Gαqi9 or Gαqs5. Data points represent averages ± s.e.m, with the number of independent experiments (n) indicated. Cell surface expression levels are described in the Methods (a-c). d, Alignment of CaSRG TMDs showing relative orientations of the Gα H5 helices in all five of our CaSR-G-protein complexes. The axis of each individual H5 helix is represented by a straight rod and colored to match the corresponding CaSR-G-protein complex. Regions I and II correspond to the C-terminal and N-terminal ends of the H5 helices, respectively. e, Regions I and II in (d), viewed from the C- and N-terminal ends of H5 helices, respectively. Using the Gαi3 H5 helix as the reference, the angle between the axes of each pair of H5 helices is marked for their N-terminal ends in region II. These angles reflect the relative orientations of H5 helix insertion into the receptor among various CaSR-G-protein complexes. The C-terminal ends of the H5 helices are closer together as they converge on the G-protein-binding pocket of CaSR. f, g, Comparison of the depth of Gα H5 helix insertion between nanodiscs-reconstituted and detergents-solubilized complexes using the same alignment from (d). The CaSR-miniGisq in nanodiscs manifests deeper penetration of H5 helix than the same complex in detergent (f), and CaSR-Gi3 in nanodiscs similarly shows a deeper insertion of H5 when compared with CaSR-miniGi1 in detergent (g).
Extended Data Fig. 8 |
Extended Data Fig. 8 |. CaSR-G-protein interactions.
a, b, Barcode presentations of CaSR (a) and Gα (b) residues that take part in the CaSR-G-protein interfaces of our five complexes. Stars designate residues with functional significance as per our mutational analyses. In (a), filled circles indicate G-protein-binding residues of CaSR that are common to all five complexes (green) or in specific complexes (gray). Empty circles represent CaSR residues not in contact with G protein. Dotted circles mark disordered residues. In (b), G-protein residues that contact CaSR in complexes bearing miniGisq (cyan), Gi3 (green), miniGi1 (green) or miniGis (blue) are interspersed with those that lack contact with the receptor (empty). c, d, Functional analysis of G-protein-binding residues in CaSR. Ca2+ potency (EC50) and maximal response (Emax) of wild-type and mutant receptors are compared for Gq, Gi3 and Gi1 (c) as well as Gq, Gqi9 and Gqs5 (d) using BRET-based G-protein activation and IP1 accumulation assay, respectively. e, Analysis of Ca2+ potency (EC50) and maximal response (Emax) of wild-type CaSR-mediated IP1 accumulation through wild-type or mutant Gαq. Ca2+-stimulated IP1 accumulation was measured in Gαq/11-knockout HEK293 cells co-transfected with either wild-type or mutant Gαq. Bar segments represent averages ± s.e.m, with the number of independent experiments (n) indicated (c-e). One-way analysis of variance (ANOVA) with Dunnett’s multiple comparison test was used to calculate statistical differences in EC50 and Emax between wild-type and mutant receptors. ND stands for not determined due to an incomplete response curve within the dose concentration range tested. *P<0.05; **P<0.01; ***P<0.001; ****P<0.0001; ns, not significant. Cell surface expression levels of wild-type and mutant CaSR are described in the Methods (c,d).
Extended Data Fig. 9 |
Extended Data Fig. 9 |. Receptor transmembrane dimer interface of various CaSR-G-protein complexes.
a, Structural elements at the receptor TMD dimer interface of CaSR-Gi3 (blue and cyan), CaSR-miniGisq (green) and CaSR-miniGis (yellow) complexes in nanodiscs, as well as those of CaSR-miniGisq (blue) and CaSR-miniGi1 (violet) complexes in detergent. b, Specific TMD dimer interactions between CaSRfree (blue) and CaSRG (cyan) within each of the CaSR-G-protein complexes shown in (a). The TMD dimer interface is divided into three sections (I-III) based on the contacts involving TM6 (I), TM7 (II) and ECL3 (III) of CaSRfree. In the cases of CaSR-miniGis in nanodiscs and CaSR-miniGi1 in detergent, TM1 of CaSRfree contributes to dimer interactions in section II. An additional interaction between ECL2 of both subunits is found in the CaSR-miniGis complex and included as part of section III. F8216.53(G) is part of the dimer interface, while F8216.53(free) (yellow) is directed toward the transmembrane core. c, d, Functional analysis of mutations at the receptor TMD dimer interface and phospholipid-binding site. Ca2+ potency (EC50) and maximal response (Emax) of wild-type and mutant receptors are compared for Gq, Gqi9 and Gqs5 (c) as well as Gq and Gi3 (d) using IP1 accumulation and BRET-based G-protein activation assay, respectively. Most of the mutants showed reduced G-protein activation when compared to the wild-type receptor. Bar segments represent averages ± s.e.m, with the number of independent experiments (n) indicated. One-way analysis of variance (ANOVA) with Dunnett’s multiple comparison test was used to calculate statistical differences in EC50 and Emax between wild-type and mutant receptors. ND stands for not determined due to an incomplete response curve within the dose concentration range tested. *P<0.05; **P<0.01; ***P<0.001; ****P<0.0001; ns, not significant. Cell surface expression levels of wild-type and mutant CaSR are described in in the Methods.
Extended Data Fig. 10 |
Extended Data Fig. 10 |. Transmembrane ligands of CaSR-G-protein complexes.
a, Cartoon representation of CaSRfree (blue) and CaSRG (cyan) in CaSR-Gi3 complex showing the locations of various bound molecules, including R-568 (lime), POPG (green), and CHS (magenta). Transparent densities from the 3D reconstruction surround models of POPG and CHS (map contour level 0.15). b, Superposition of POPG molecules from CaSR-G-protein complexes reconstituted in nanodiscs. The complexes are aligned to one another based on the TMDs of their CaSRfree subunits. c, Detailed views of the POPG- and CHS-binding sites in the CaSR-Gi3 (left), CaSR-miniGisq (middle) and CaSR-miniGis (right) complexes in nanodiscs. Residues from CaSRfree and CaSRG that coordinate POPG at the TMD dimer interface are displayed for each complex. d, Electrostatic surface of the CaSR-Gi3 complex showing the binding environment of POPG and CHS molecules. The degree of electrostatic potential is calculated using ChimeraX. e, Close-up view of CaSRG and CaSRfree ICL3 loops upon alignment of their transmembrane bundles. POPG (green) stabilizes CaSRG ICL3, but would clash with the CaSRfree ICL3 conformation (red star). A red arrow illustrates the G-protein-induced conformational differences between the ICL3 loops. f, Detailed views of the LMNG- and CHS-binding sites in CaSR-miniGisq (left) and the LMNG binding site in CaSR-miniGi1 (right). Residues from CaSRfree and CaSRG that coordinate LMNG at the TMD dimer interface are displayed for each complex. Both complexes were solubilized in detergent. g, Superposition of the CaSRpreG (gray; PDB: 7SIL), CaSRfree and CaSRG transmembrane bundles based on their TMD helices, displaying the distinct poses of their respectively bound R-568 molecules as well as the coordinating residues F8216.53 and Y8256.57. h, R-568-binding pockets within CaSRfree (left) and CaSRG (right) subunits of the CaSR-Gi3 complex in nanodiscs. i, R-568-binding sites within the CaSRfree (top) and CaSRG (bottom) belonging to (from left to right) CaSR-miniGisq in nanodiscs, CaSR-miniGis in nanodiscs, CaSR-miniGisq in detergent, and CaSR-miniGi1 in detergent.
Fig. 1 |
Fig. 1 |. Structures of human CaSR coupled with different G-protein subtypes.
a-c, Cryo-EM density map (left) and structural model (right) of CaSR in complex with miniGisq (a), Gi3 (b) or miniGis (c). Each complex is reconstituted in nanodiscs and composed of CaSRfree (blue), CaSRG (cyan), Gα (yellow), Gβ (violet) and Gγ (crimson) subunits. The bound CaSR ligands include TNCA (gray), Ca2+ (green), PO43- (orange), and R-568 (yellow). POPG (lime) and CHS (magenta) molecules are found at the TMD dimer interface. N-linked glycans (NAG, light gray) are attached to the ECD.
Fig. 2 |
Fig. 2 |. G-protein-induced conformational changes in CaSR.
a, The CaSR-Gi3 complex (black outlines) showing conformation differences in G-protein-binding elements of superimposed CaSRfree, (blue) and CaSRG (cyan), including colored TMD helices, ICLs, and C-terminal region. b, Detailed views of the alignment in (a) showing the conformational contrast between CaSRfree and CaSRG in ICL1 (left), ICL2 (center), ICL3 (right) and C-terminal region (bottom). Red arrows signify the directions and magnitude of G-protein-associated conformational changes. c,d, Comparison of ICL3 (c) and ICL2 (d) in CaSRG subunits of the CaSR-miniGisq (cyan), CaSR-Gi3 (green) and CaSR-miniGis (pink) complexes in nanodiscs in a superposition based on the CaSRG TMD helices. e, Comparison of the TMD dimer orientations in NAM-bound inactive (pink; PDB: 7SIN), agonists- and NAM-bound intermediate (blue; PDB: 7M3E), PAM R-568-bound pre-G-protein-coupled active (cyan; PDB: 7SIL) and PAM R-568-bound G-protein-coupled fully active (green) states. One subunit of each structure was superimposed onto the CaSRfree subunit of the CaSR-Gi3 complex and viewed from the extracellular side. The dotted black arrow indicates the path the second subunit follows as the receptor transitions from inactive to G-protein-bound fully active state.
Fig. 3 |
Fig. 3 |. G-protein activation mechanism.
a, Structure of the CaSR-Gi3 complex illustrating the difference in H5 helix register between inactive GDP-bound (red) and CaSR-coupled nucleotide free (yellow) Gα proteins. The H5 helices of the two Gα proteins were brought into superposition by aligning their respective GTPase domains. The inactive Gα protein has a disordered H5 C-terminal module that becomes ordered upon coupling to CaSR, and its H5 N-terminal module needs to undergo a 60° rotation and 5 Å translation in order to be integrated with the receptor-bound H5 C-terminal module (1). This is followed by H5-H1 decoupling in Gα (2) and GDP release for G-protein activation (3). b, Inactive GDP-bound Gαi1 (gray) is superimposed onto the CaSRG (cyan)-bound Gαi3 (yellow) based on their H5 helices. Theoretical clashes are shown between the inactive G protein and ICL2 of CaSRG (red dotted square). c, Extracellular view of the CaSR TMD dimer from representative CaSR-Gi3 complex superimposed with several structures. Left, the TMD dimer from this complex is shown with the HN helices of its bound Gα (yellow) and the inactive Gα (gray) according to the H5-based alignment in (b). Right, TMD dimer alignment of CaSR-Gi3 and CaSRpreG (PDB: 7SIL) based on CaSRfree (blue) and one subunit of CaSRpreG (gray). Red arrows indicate the common turning direction that CaSRG (cyan) takes, as well as the potential path that HN would take if not restricted by ICL2 and the TMD dimer. d, Functional analysis of CaSR ICL2 deletion mutants lacking one to seven residues around its turning point. Ca2+-induced activation of Gq, Gi3 and Gi1 were measured using BRET assay. Data points represent averages ± s.e.m, with the number of independent experiments (n) indicated. Cell surface expression levels are described in the Methods.
Fig. 4 |
Fig. 4 |. CaSR-G-protein interface.
a, Comparison of CaSR-G-protein interfaces in nanodisc-reconstituted CaSR-miniGisq, CaSR-Gi3 and CaSR-miniGis complexes. Alignment was based on the TMD of CaSRG. The C-terminal region of Gα H5 helix along with CaSR TM3, ICL1 and ICL3 make up region I (red dotted rectangle). The Gα H5 helix, h4s6 and S6 work in tandem with CaSR H8 to form region II (purple dotted rectangle). The Gα H5 helix, and in some cases HN or S1, interact with CaSR ICL2 to establish region III (blue dotted rectangle). b-e, Detailed views of various interface regions described in (a), displaying interfacial residues from CaSRG (cyan) and G protein (yellow). From left to right, each region depicts CaSR-minGisq in nanodiscs, CaSR-miniGisq in detergent, CaSR-Gi3 in nanodiscs, CaSR-miniGi1 in detergent and CaSR-miniGis in nanodiscs. The hydrophobic core region Ia (b), the hydrophilic region Ib (c), region II when CaSR H8 is ordered (d), and region III involving CaSR ICL2 (e) are shown in descending order. f, Dose-dependent Ca2+-stimulated receptor response measured using IP1 accumulation (top) or BRET-based G-protein activation (bottom) assay. The CaSR mutations F706A, K801A, K644A, R873A, and T876A reduced Gq/i/s activation. Data points represent averages ± s.e.m, with the number of independent experiments (n) indicated. Cell surface expression levels are described in the Methods.
Fig. 5 |
Fig. 5 |. Analysis of the selectivity determinant on G protein.
a, Comparison of CaSR-G-protein interface region III from nanodisc-reconstituted CaSR-miniGisq (cyan) and CaSR-Gi3 (green) complexes. Alignment was based on the TMD of CaSRG, showing different conformations of ICL2. A small CG.H5.23 in Gαi3 interacts with an inward-facing W719ICL2 of CaSRG. The larger YG.H5.23 in miniGαisq would hinder this orientation, causing W719 to move 8 Å away, swing outward, and become part of an extended TM4. b,c, Analysis of G-protein activation by the CaSR ICL2 deletion mutant lacking four residues I710-S713 (ΔI710-S713). It showed decreased activity of Gαq and Gαqs5, but not Gαqi9 or the Gαq mutant Y356G.H5.23C in IP1 accumulation (b) or BRET-based Gq activation (c) assay. d, Comparison of the CaSR-miniGisq interface region III in (a) (cyan) with the corresponding area in the GABAB-Gi1 complex (PDB:7EB2; pink). The small CG.H5.23 side chain of Gi1 allows the entire ICL2 loop of GABAB2 to closely approach Gαi1 H5. However, the bulky YG.H5.23 side chain of miniGisq would clash with I591ICL2 of GABAB2. e, Functional analysis of the G-protein selectivity determinant using the Gi/o-coupled GABAB receptor. The GABAB receptor activates Gαi1 and Gαqi5, but not Gαq or Gαqs5 in IP1 accumulation (left) or BRET (right) assay. The YG.H5.23C mutants of Gαq and Gαqs5 were activated by GABAB receptor, similarly to Gαi1 or Gαqi5. On the other hand, the C G.H5.23Y mutant of Gαi1 or Gαqi5 could not be activated by GABAB receptor. Data points represent averages ± s.e.m, with the number of independent experiments (n) indicated (b,c,e).

References

    1. Brown EM et al. Cloning and characterization of an extracellular Ca(2+)-sensing receptor from bovine parathyroid. Nature 366, 575–580 (1993). - PubMed
    1. Hofer AM & Brown EM Extracellular calcium sensing and signalling. Nat. Rev. Mol. Cell Biol 4, 530–538 (2003). - PubMed
    1. Gray E et al. Activation of the extracellular calcium-sensing receptor initiates insulin secretion from human islets of Langerhans: involvement of protein kinases. J. Endocrinol 190, 703–710 (2006). - PubMed
    1. Mace OJ, Schindler M & Patel S The regulation of K- and L-cell activity by GLUT2 and the calcium-sensing receptor CasR in rat small intestine. J. Physiol 590, 2917–2936 (2012). - PMC - PubMed
    1. Ruat M & Traiffort E Roles of the calcium sensing receptor in the central nervous system. Best Pract. Res. Clin. Endocrinol. Metab 27, 429–442 (2013). - PubMed

Publication types

MeSH terms

Substances