. 2024 Apr 17;7(1):471.
doi: 10.1038/s42003-024-06094-9.

An evolutionary timeline of the oxytocin signaling pathway

Affiliations

An evolutionary timeline of the oxytocin signaling pathway

Alina M Sartorius et al. Commun Biol. .

Abstract

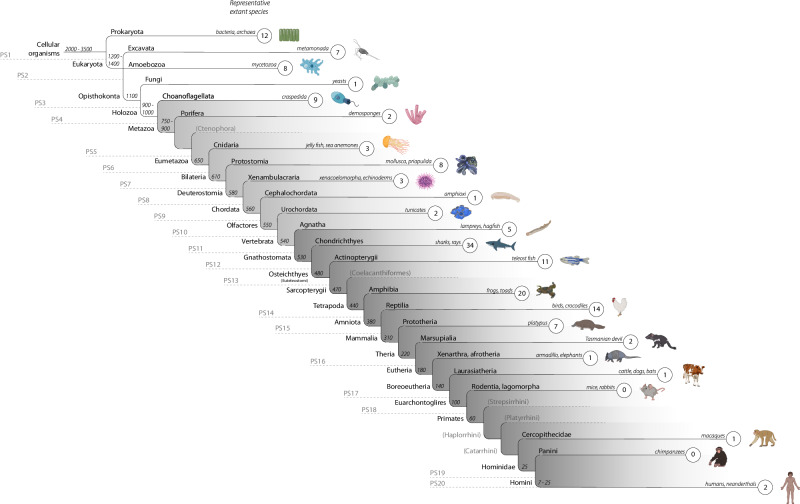
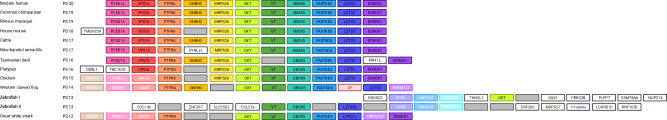
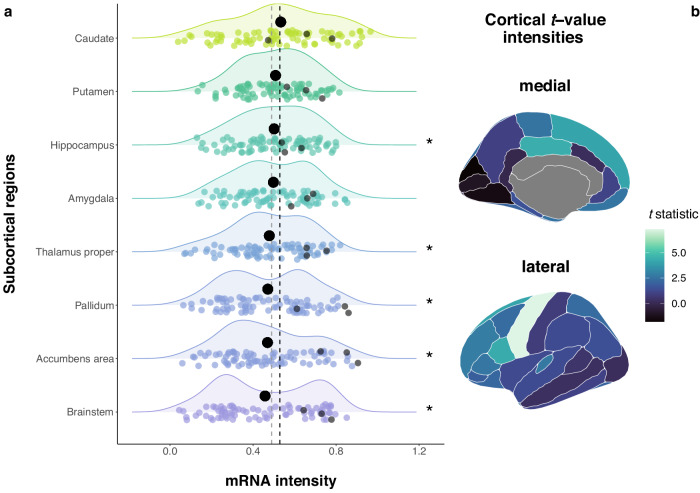
Oxytocin is a neuropeptide associated with both psychological and somatic processes like parturition and social bonding. Although oxytocin homologs have been identified in many species, the evolutionary timeline of the entire oxytocin signaling gene pathway has yet to be described. Using protein sequence similarity searches, microsynteny, and phylostratigraphy, we assigned the genes supporting the oxytocin pathway to different phylostrata based on when we found they likely arose in evolution. We show that the majority (64%) of genes in the pathway are 'modern'. Most of the modern genes evolved around the emergence of vertebrates or jawed vertebrates (540 - 530 million years ago, 'mya'), including OXTR, OXT and CD38. Of those, 45% were under positive selection at some point during vertebrate evolution. We also found that 18% of the genes in the oxytocin pathway are 'ancient', meaning their emergence dates back to cellular organisms and opisthokonta (3500-1100 mya). The remaining genes (18%) that evolved after ancient and before modern genes were classified as 'medium-aged'. Functional analyses revealed that, in humans, medium-aged oxytocin pathway genes are highly expressed in contractile organs, while modern genes in the oxytocin pathway are primarily expressed in the brain and muscle tissue.


Conflict of interest statement

M.H. has served as a speaker for Lundbeck, outside of the work presented in the manuscript. The remaining authors declare no competing interests.

Figures

Fig. 1
Fig. 1. The evolutionary age of the OT signaling pathway.
The emergence of genes supporting the OT signaling pathway is outlined on a simplified phylogenetic tree tailored to human evolution, thus starting with cellular organisms and ending with modern humans. The clade name and an example of a representative extant species of the respective lineage ancestor are shown for each branch. The absolute gene counts per phylostratum (PS, 1 = oldest, 20 = newest) are given in the smaller circles at the ends of each branch. Branches with ancient genes are highlighted in white, branches with medium-aged genes in light gray and modern genes in gray. Time estimates for lineage splits (e.g., 650, 310, 60) are given in mya (“million years ago”). For example, three genes supporting the OT signaling pathway had their earliest homolog emerge in the PS 8 ancestor (~580 mya), for which the extant echinoderm purple sea urchin (S. purpuratus) is the proxy species, which suggests these three genes in the pathway emerged in the deuterostomia ancestor.
Fig. 2
Fig. 2. Microsynteny for OXT across PS 20–12.
The ten genes surrounding OXT in the modern human build a microsyntenic block that is conserved across mammalian species. The synteny is less conserved in teleost fishes, as shown in the zebrafish microsyntenies for OXT and VT in two different loci (Zebrafish I and II), possibly due to a whole-genome duplication in the teleost fish ancestor that gave rise to genome reorganization events. The species' common names are given in the outer left column, followed by the corresponding PS and the microsyntenic block. Each rectangle represents one gene with the abbreviated gene name in the center. Gray, empty rectangles indicate a potential missing gene in that locus. Non-colored rectangles indicate no re-occurrence of a gene in the displayed species within microsyntenic distance. The microsyntenies for CD38 and OXTR are visualized in Supplementary Figs. 1 and 2. PS phylostratum, UP uncharacterized protein.
Fig. 3
Fig. 3. Distribution of maximum dN/dS values from the adaptive branch-site random effects likelihood (aBSREL) models.
The maximum dN/dS ratios resulting from the aBSREL models for n = 38 (39) genes across 13 vertebrate species and ten nodes. Each dot represents one gene, the dots highlighted in magenta are the genes that were under positive selection in specific branches or nodes as identified in the branch-site tests. Branches and nodes are displayed on the y axis and the maximum log-transformed dN/dS values on the x axis. log-dN/dS ratio < 0.693147181 signifies negative selection, log-dN/dS ratio = 0.693147181 signifies neutral selection, log-dN/dS ratio > 0.693147181 signifies positive selection. The vertical dotted gray line marks neutral selection. The center line in each box plot indicates the median, box limits are the upper and lower quartiles, whiskers reach up to the minimum and maximum value, respectively. The raw data underlying this plot is presented in Supplementary Data 5.
Fig. 4
Fig. 4. Expression of the genes in the OT pathway across the body.
a Differential expression of genes from the OT signaling pathway in 30 tissue types from the GTEx dataset. Significantly enriched tissues are colored, with colors corresponding to the bar plots to the right. b Ancient OT pathway genes (n = 28) were not significantly differentially expressed (e.g., up- or downregulated) in any tissue. c Expression of the medium-aged genes (n = 28) is enriched in blood vessels and the bladder. d Modern genes (n = 98) are upregulated in skeletal muscle tissue and the brain. −Log 10 P values from hypergeometric tests. The raw data underlying plots (bd) is presented in Supplementary Data 11.
Fig. 5
Fig. 5. Expression of the modern OT pathway genes across the human brain.
a Mean expression values of the modern OT gene set in eight subcortical regions (bold black dots) compared to the average expression of the modern OT gene set across the whole brain (i.e., the total of 42 brain regions, cortical and subcortical, vertical black dashed line; for reference the vertical gray dashed line represents mean expression across subcortical regions). Jittered colored dots represent the mRNA intensity of each single modern OT gene, the three gray dots in each distribution represent mRNA intensities of OXT, OXTR and CD38. *PFDR < 0.05. Ridge plots are colored and ranked by mean expression intensity. b Atlas representation of the t values in 34 cortical brain regions (unilateral left). High t-statistics can be observed in the precentral gyrus, posterior cingulate, pars opercularis, and superior frontal gyrus (statistically significant), the lowest value appears in the cuneus. The raw data underlying these plots is presented in Supplementary Data 12 and 13. n = 81 (98) genes and postmortem expression data from n = 6 brains included in the analysis.

Similar articles

Cited by

References

    1. Theofanopoulou C, Gedman G, Cahill JA, Boeckx C, Jarvis ED. Universal nomenclature for oxytocin-vasotocin ligand and receptor families. Nature. 2021;592:747–755. doi: 10.1038/s41586-020-03040-7. - DOI - PMC - PubMed
    1. Takuwa-Kuroda K, Iwakoshi-Ukena E, Kanda A, Minakata H. Octopus, which owns the most advanced brain in invertebrates, has two members of vasopressin/oxytocin superfamily as in vertebrates. Regul. Pept. 2003;115:139–149. doi: 10.1016/S0167-0115(03)00151-4. - DOI - PubMed
    1. Reich G. A new peptide of the oxytocin/vasopressin family isolated from nerves of the cephalopod octopus vulgaris. Neurosci. Lett. 1992;134:191–194. doi: 10.1016/0304-3940(92)90514-8. - DOI - PubMed
    1. Donaldson, Z. R. & Young, L. J. Oxytocin, vasopressin, and the neurogenetics of sociality. Science322, 900–904 (2008). - PubMed
    1. Stafflinger, E. et al. Cloning and identification of an oxytocin/vasopressin-like receptor and its ligand from insects. Proc. Natl. Acad. Sci. USA105, 3262–3267 (2008). - PMC - PubMed

Publication types