. 2024 May;20(5):634-645.
doi: 10.1038/s41589-024-01580-x. Epub 2024 Apr 17.

Discovery of potent inhibitors of α-synuclein aggregation using structure-based iterative learning

Affiliations

Discovery of potent inhibitors of α-synuclein aggregation using structure-based iterative learning

Robert I Horne et al. Nat Chem Biol. 2024 May.

Abstract

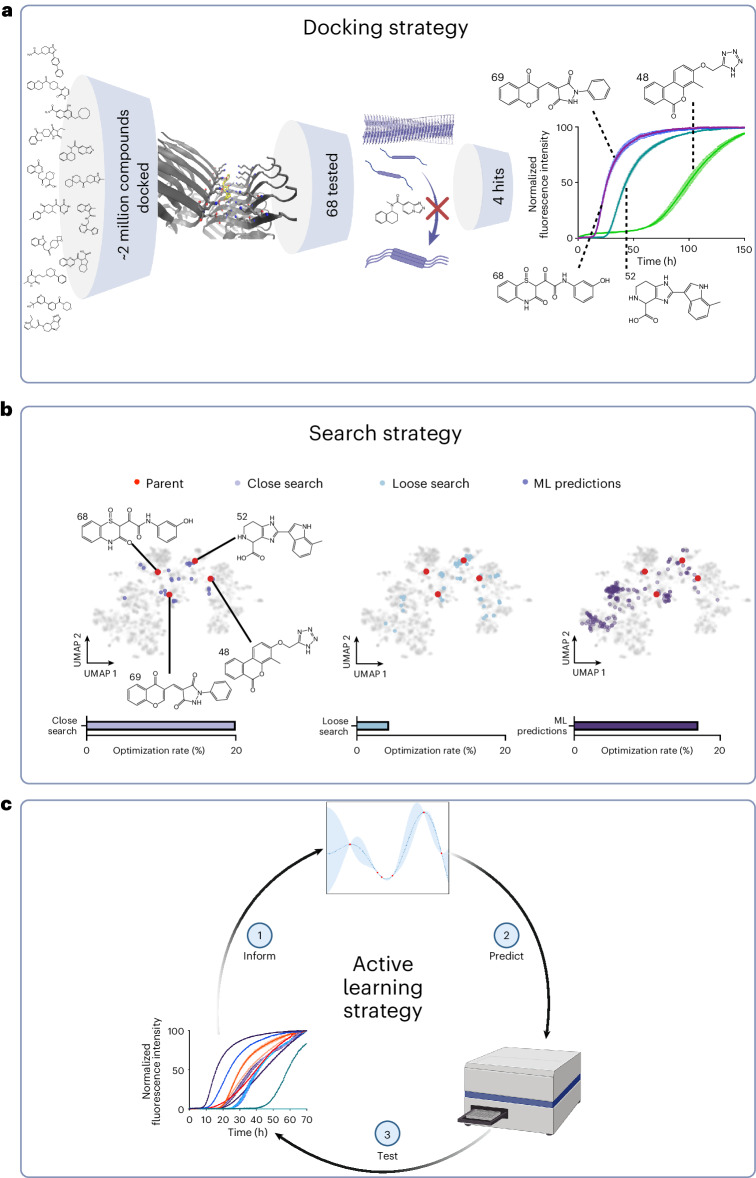
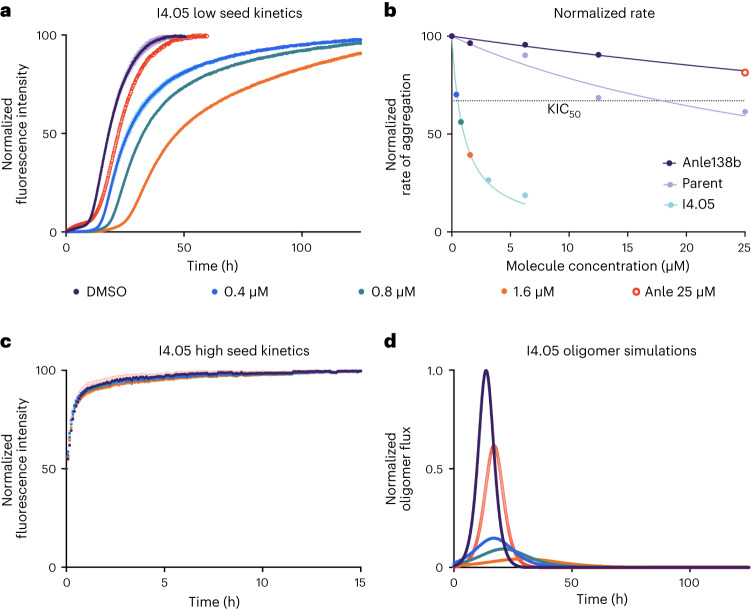
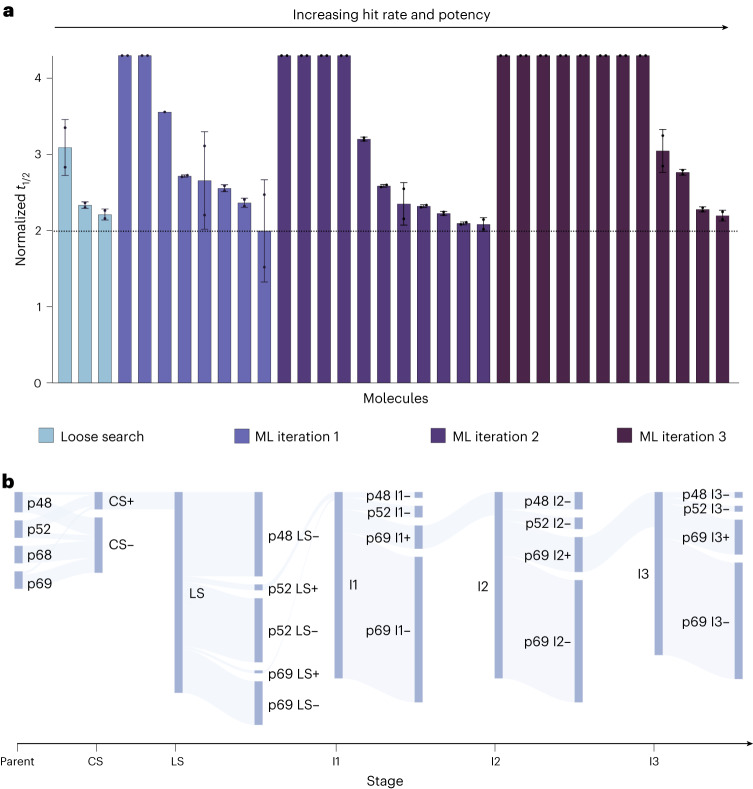
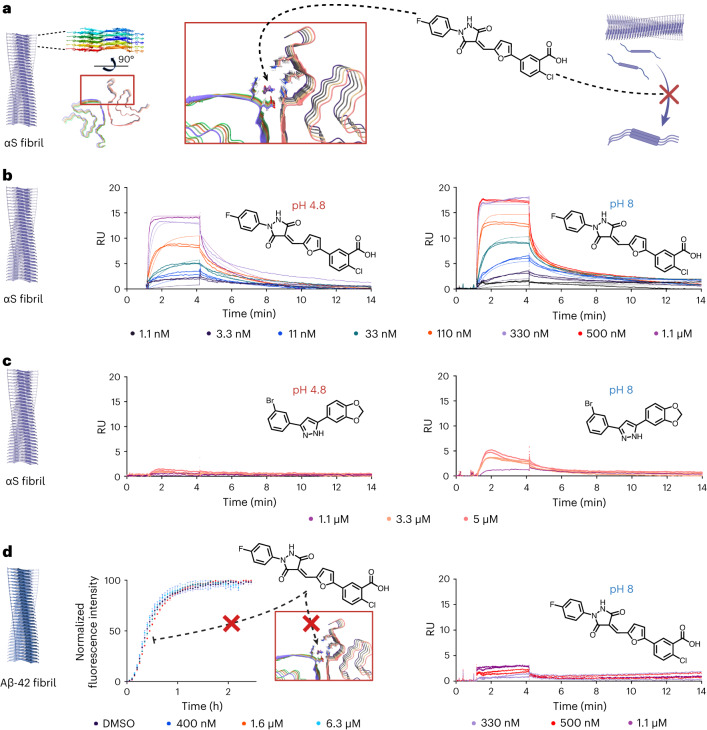
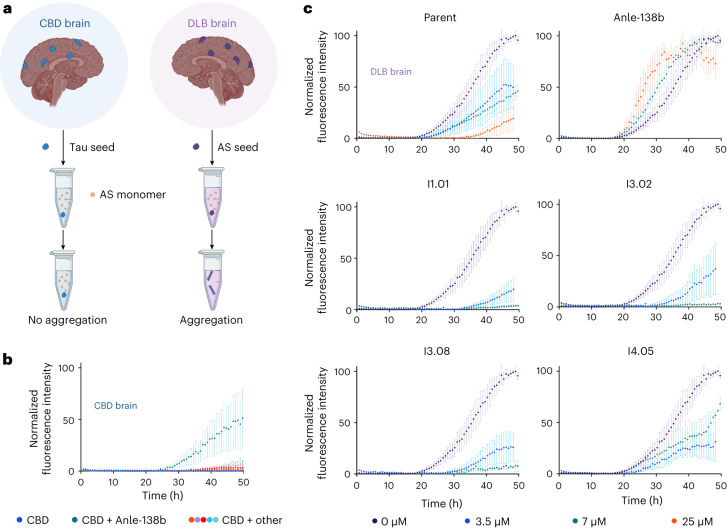
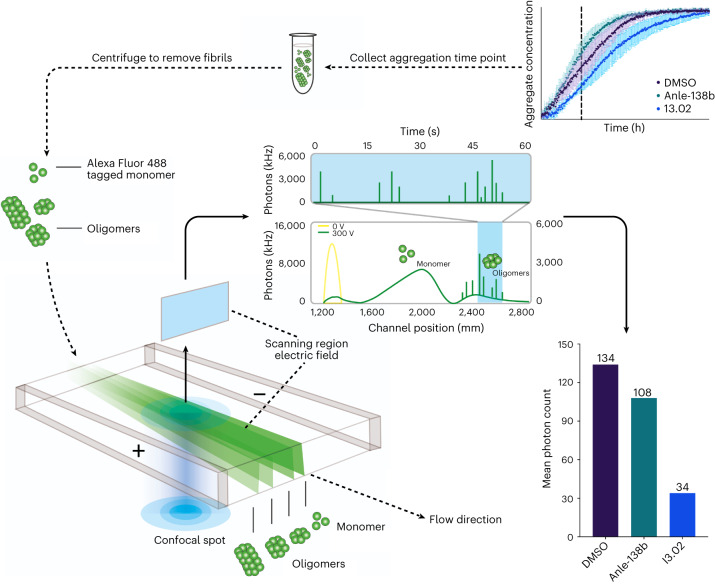
Machine learning methods hold the promise to reduce the costs and the failure rates of conventional drug discovery pipelines. This issue is especially pressing for neurodegenerative diseases, where the development of disease-modifying drugs has been particularly challenging. To address this problem, we describe here a machine learning approach to identify small molecule inhibitors of α-synuclein aggregation, a process implicated in Parkinson's disease and other synucleinopathies. Because the proliferation of α-synuclein aggregates takes place through autocatalytic secondary nucleation, we aim to identify compounds that bind the catalytic sites on the surface of the aggregates. To achieve this goal, we use structure-based machine learning in an iterative manner to first identify and then progressively optimize secondary nucleation inhibitors. Our results demonstrate that this approach leads to the facile identification of compounds two orders of magnitude more potent than previously reported ones.


Conflict of interest statement

R.I.H., M.N., S.C. and P.S. have been consultants of WaveBreak Therapeutics (formerly Wren Therapeutics). R.S. and A.P. have been employees of WaveBreak Therapeutics. M.V. and T.P.J.K. are founders of WaveBreak Therapeutics. WaveBreak Therapeutics is a company that seeks to identify therapeutics for neurodegeneration. The other authors declare no competing interests.

Figures

Fig. 1
Fig. 1. Illustration of the three stages of exploration of the chemical space described in this work.
a, From 68 molecules predicted to have good binding via docking simulations, we initially identified 4 active molecules (the ‘docking set’) by experimental testing. These four molecules increase the t1/2 of αS aggregation. b, We then performed a close Tanimoto similarity search around the four parent compounds in chemical space. We selected molecules with Tanimoto similarity cutoff >0.5 (the ‘close similarity docking set’) followed by a loose similarity search with Tanimoto similarity cutoff >0.4 (the ‘loose similarity docking set’). A machine learning method was then applied using the observed data to predict potent molecules from a compound library derived from the ZINC database with Tanimoto similarity >0.3 to the parent structures (the ‘evaluation set’). c, Successive iterations of prediction and experimental testing yielded higher optimization rates (defined as the percentage of molecules increasing the normalized half time of aggregation above 2), and molecules with higher potency on average than those identified in the previous similarity searches. Validation experiments were also carried out on the potent molecules identified.
Fig. 2
Fig. 2. Performance comparison of a molecule from the iterative learning (I4.05) versus an αS aggregation inhibitor currently in clinical trials (Anle-138b).
a, Kinetic traces of a 10 µM solution of αS with 25 nM seeds at pH 4.8, 37 °C in the presence of molecule or 1% DMSO (n = 3 replicates; central measure, mean; error, standard deviation (s.d.)). During the initial screening, except for iteration 4, all molecules were screened at 2.5 molar equivalents (25 µM), and potent molecules were then taken for further validation at lower concentrations: 0.4 µM (blue), 0.8 µM (teal), 1.6 µM (orange) with Anle-138b at 25 µM for comparison (red circles). The 1% DMSO negative control is shown in purple. Molecule I4.05 is shown as an example. The endpoints are normalized to the αS monomer concentration at the end of the experiment, which was detected via the Pierce BCA Protein Assay at t = 125 h. b, Approximate rate of reaction (taken as 1/t1/2, normalized between 0 and 100; central measure, mean) in the presence of three different molecules, Anle-138b (purple), parent structure 69 (lilac) and I4.05 (blue). The KIC50 of I4.05 is indicated by the intersection of the fit (blue) and the horizontal dotted line. c, High-seeded experiments (5 µM seeds, all other conditions match a, n = 3 replicates; central measure, mean; error, s.d.) were also carried out to observe any effects on the elongation rate and enable oligomer flux calculations in combination with the secondary nucleation rate derived from a. d, Oligomer flux calculations for I4.05 versus the clinical trial molecule Anle-138b using the rates derived from both a and c.
Fig. 3
Fig. 3. Results of the iterations of the machine learning drug discovery approach.
a, Normalized t1/2 for the potent leads at 25 µM from the different stages: loose search, iteration 1, iteration 2 and iteration 3 (n = 2 replicates; central measure, mean; error, standard deviation). The horizontal dotted line indicates the boundary for potent lead classification, which was normalized t1/2 = 2. For the loose search, 69 molecules were tested, while for iterations 1, 2 and 3, the number of molecules tested was 64, 64 and 56, respectively. Note that the most potent molecules exhibited complete inhibition of aggregation over the timescale observed, so the normalized t1/2 is presented as the whole duration of the experiment. b, Flow of potent molecules (+) and negatives (−) in the project starting from the close search (CS), moving to the loose search (LS) and then iterations 1, 2, and 3 (I1, I2 and I3). Each branch is labeled with the molecule source (for example, p48). Attrition reached its highest point at the loose search before gradually improving with each subsequent iteration.
Fig. 4
Fig. 4. Molecule binding to αS fibrils.
a, A schematic representation of small molecule binding to the target binding pocket on the αS fibril. b, SPR response curves for different concentrations of I4.05, at pH 4.8 and pH 8, binding to αS fibrils generated by a seeded assay, with the corresponding molecular structure. Raw data (points) and the corresponding fits (solid lines) for each molecule concentration are shown (n = 2 replicates). Response units (RU) are shown on the y-axes. The αS fibrils were immobilized at a concentration of 2,000 pg mm2 on a CM5 Cytivia chip. The fits correspond to a 1:1 kinetic binding model, which yielded a KD of 68 nM (ka = 1.936 ± 0.007 × 105 M−1 s−1, kd = 1.315 ± 0.003 × 10−2 s−1) at pH 4.8 and 13 nM at pH 8 (ka = 5.879 ± 0.024 × 105 M−1 s−1, kd = 0.781 ± 0.002 × 10−2 s−1). Error: standard error of the mean (s.e.m.). c, SPR response curves for different concentrations of Anle-138b. Raw data (points) for each molecule concentration are shown (n = 2 replicates). Accurate fits at pH 4.8 could not be obtained. At pH 8 a 1:1 kinetic binding model yielded an approximate KD of 8.1 μM (ka = 0.0359 ± 0.0005 × 105 M−1 s−1, kd = 2.90 ± 0.02 × 10−2 s−1). Error: s.e.m. d, Seeded kinetics (40 nM seed, n = 2 replicates; central measure, mean; error, standard deviation) and SPR response curves (n = 2 replicates) for 2 μM Aβ42 in the presence of 1% DMSO or different concentrations of I4.05. I4.05 is unable to effectively inhibit Aβ42 secondary nucleation or bind to Aβ42 fibrils. The Aβ42 fibrils were immobilized at a concentration of 2,000 pg mm2 on a CM5 Cytivia chip.
Fig. 5
Fig. 5. RT-QuIC brain seeding assay.
a, Schematic representation of the RT-QuIC assay. Aggregates derived from the brain tissue of patients suffering with DLB were used to induce αS aggregation. Samples from brains of patients with CBD were used as a negative control. b, Kinetic traces of a 7 µM solution of αS in the presence of CBD seeds (pH 8, 42 °C, shaking at 400 rpm with 1 min intervals, n = 4 replicates; central measure, mean; error, standard deviation (s.d.)). CBD samples were 1% DMSO (blue), 7 µM Anle-138b (teal), parent (orange), I1.01 (purple), I3.02 (red), I3.08 (turquoise) and I4.05 (light blue). Anle-138b, in teal, induces aggregation under this condition. c, Kinetic traces of a 7 µM solution of αS in the presence of DLB seeds (n = 4 replicates; error, s.d.; all other conditions match b). The DLB samples were 1% DMSO (purple), 3.5 µM molecule (blue), 7 µM molecule (teal) and 25 µM molecule (orange). Anle-138b again appears to accelerate rather than inhibit aggregation.
Fig. 6
Fig. 6. Quantification of αS oligomers using μFFE.
Top right: αS labeled with AlexaFluor 488 (100 µM, pH 7.4, 37 °C, cycles of 5 min shaking at 200 rpm and 1 min rest, n = 4 replicates; error, standard deviation) was supplemented with 0.5 µM seed and 1% DMSO (purple) or 50 µM Anle-138b (teal) or I3.02 (blue) in 1% DMSO. Anle-138b slightly accelerates aggregation under these conditions, where fragmentation mechanisms may again play a role due to shaking, while I3.02 slows it down. Samples were extracted at 9 h from the time course of aggregation and centrifuged to remove fibrils from the mixture, leaving only αS monomers and soluble oligomeric species for analysis via μFFE. Bottom left: schematic representation of the μFFE approach, showing the AlexaFluor 488-labeled αS oligomeric mixture undergoing μFFE. The direction of fluid flow is shown by arrows. The differential deflection of the electric field allows the monomer population to be separated from the oligomer population during analysis. Middle and bottom right: analysis of the aggregate populations detected in each sample. The mean number of photons emitted, proportional to particle number and size, is plotted on the y axis of the bar plot for each sample. The average number of photons emitted per particle is indicated in the inset.

Similar articles

Cited by

References

    1. Aarsland D, et al. Parkinson disease-associated cognitive impairment. Nat. Rev. Dis. Prim. 2021;7:47. - PubMed
    1. Balestrino R, Schapira AHV. Parkinson disease. Eur. J. Neurol. 2020;27:27–42. - PubMed
    1. Collaborators, G.B.D.P.s.D. Global, regional, and national burden of Parkinson’s disease, 1990–2016: a systematic analysis for the Global Burden of Disease Study 2016. Lancet Neurol. 2018;17:939–953. - PMC - PubMed
    1. Poewe W. Parkinson disease Primer—a true team effort. Nat. Rev. Dis. Prim. 2020;6:31. - PubMed
    1. Savica R, Boeve BF, Mielke MM. When do alpha-synucleinopathies start? An epidemiological timeline: a review. JAMA Neurol. 2018;75:503–509. - PubMed

Publication types

MeSH terms