. 2024 Jul;19(7):1032-1043.
doi: 10.1038/s41565-024-01648-8. Epub 2024 Apr 17.

Multimodal nanoimmunotherapy engages neutrophils to eliminate Staphylococcus aureus infections

Affiliations

Multimodal nanoimmunotherapy engages neutrophils to eliminate Staphylococcus aureus infections

Jingcheng Zhu et al. Nat Nanotechnol. 2024 Jul.

Abstract

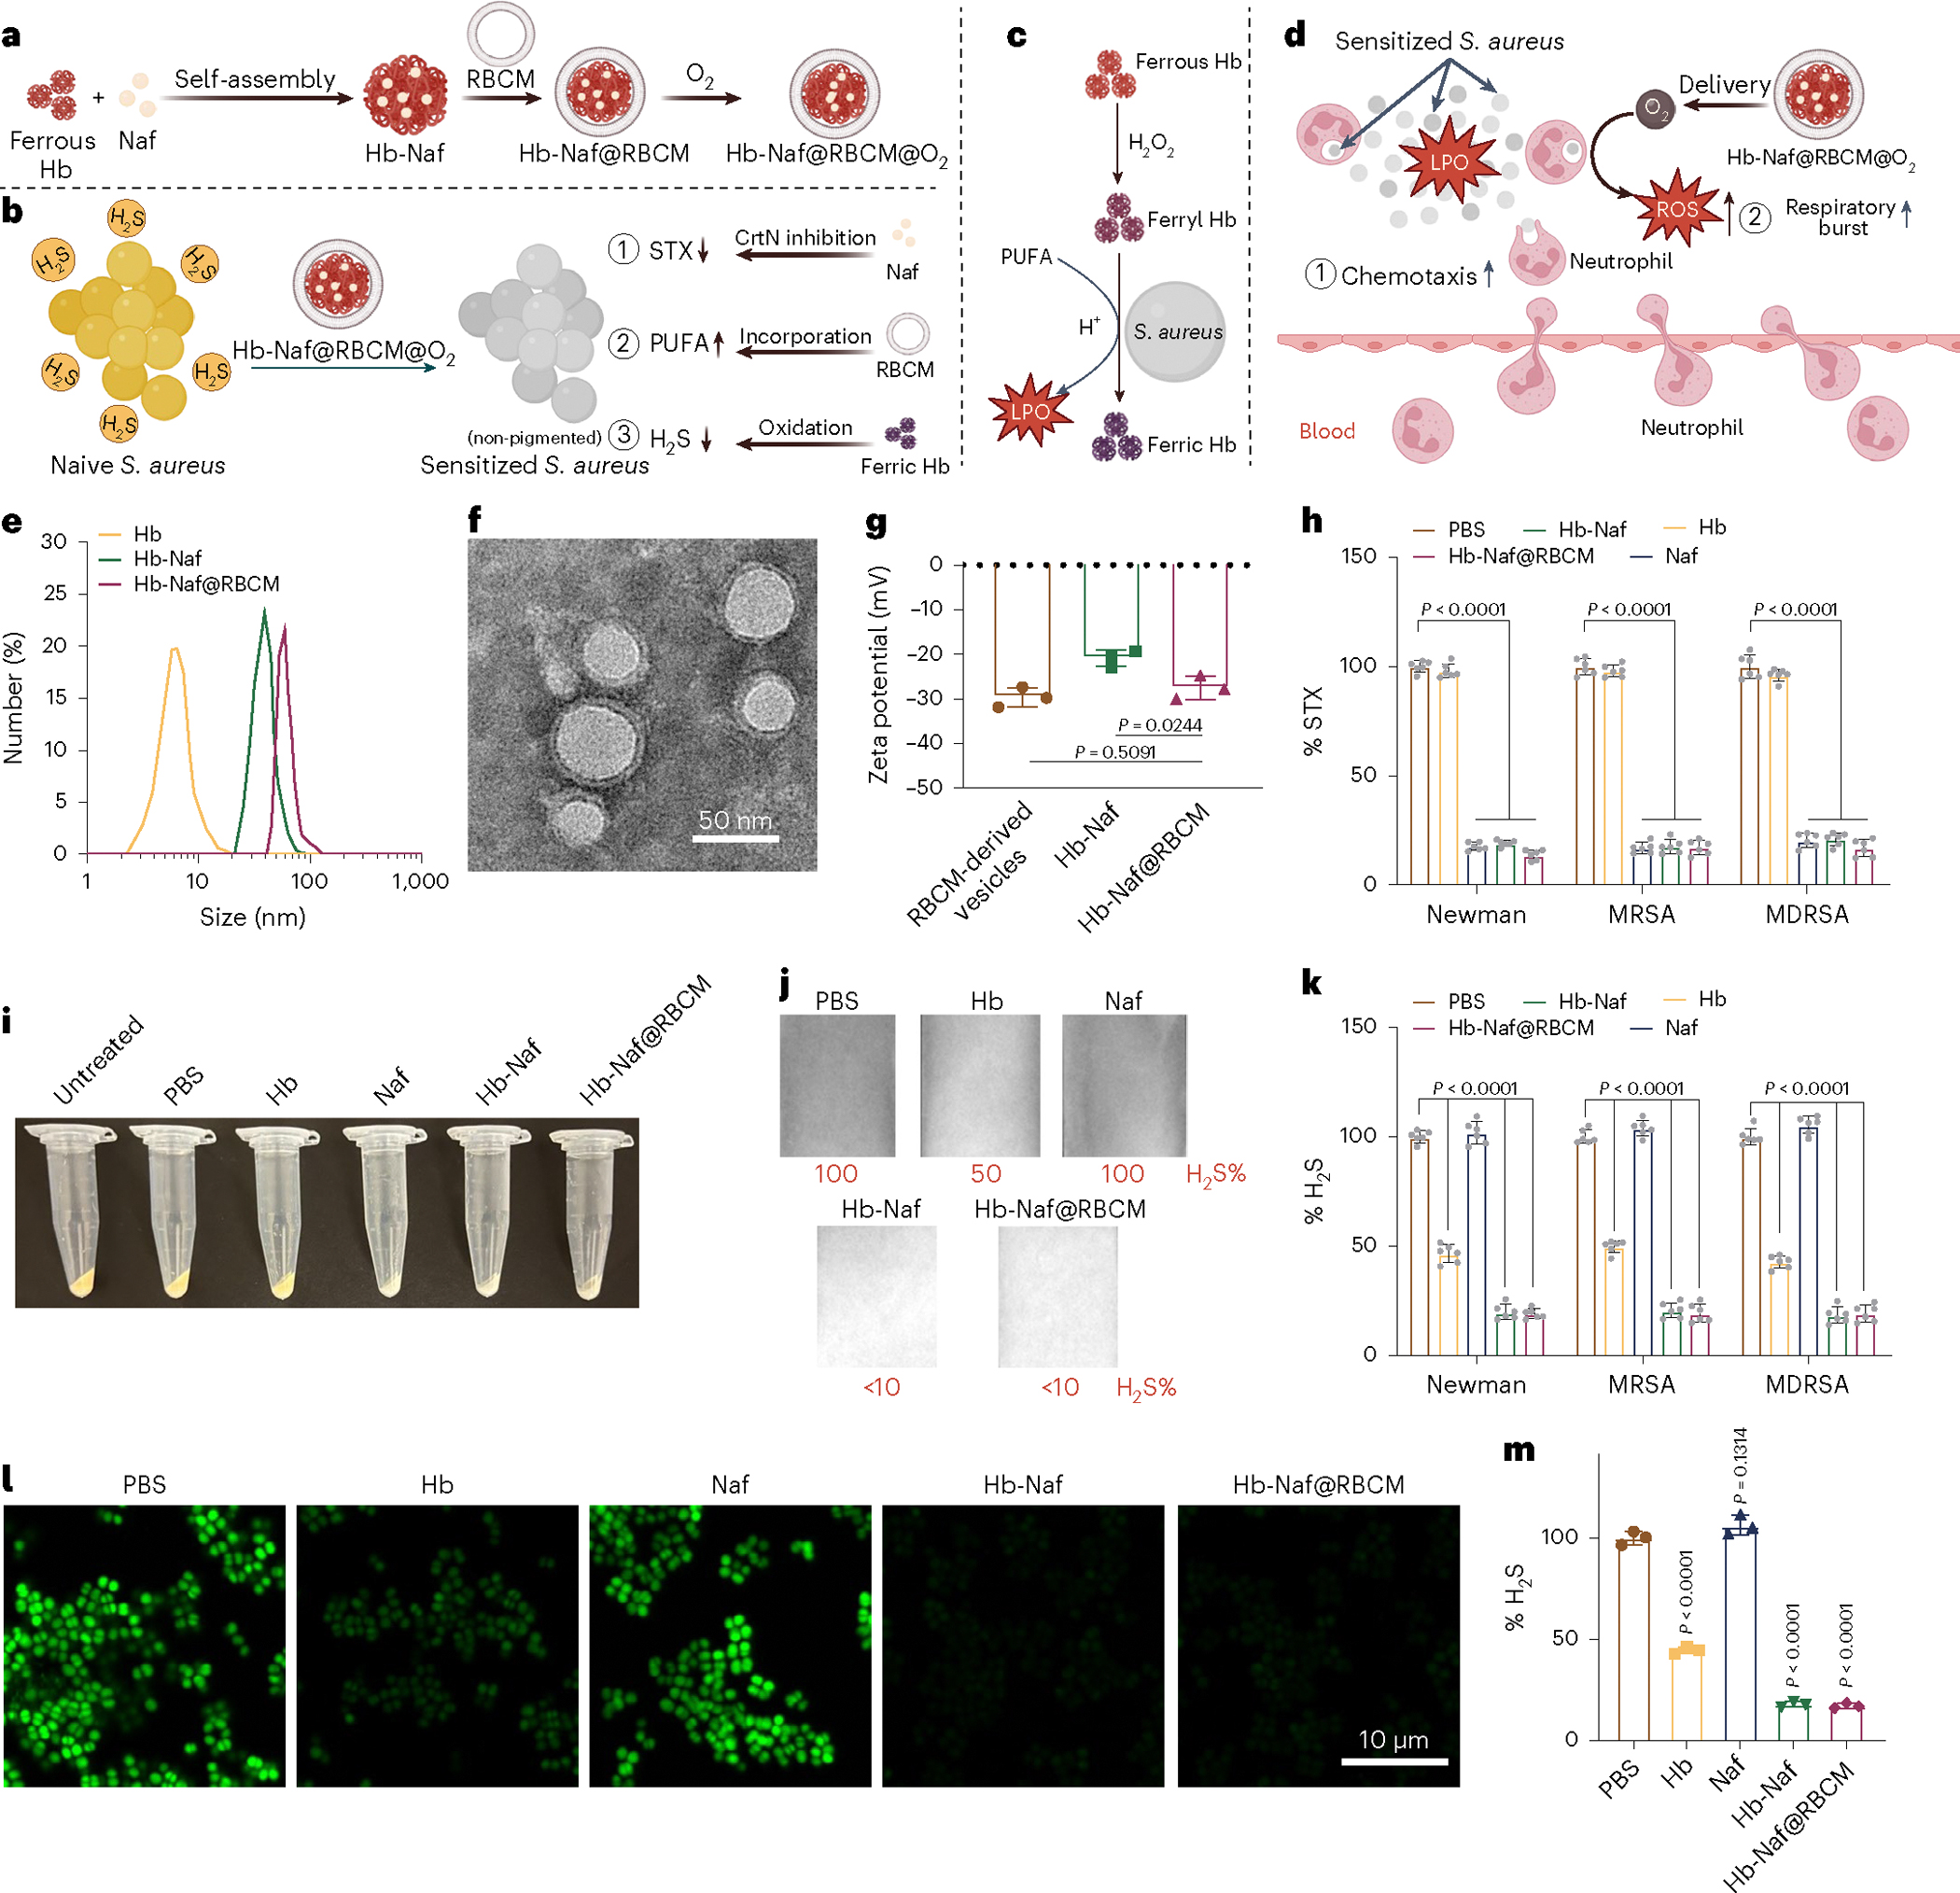
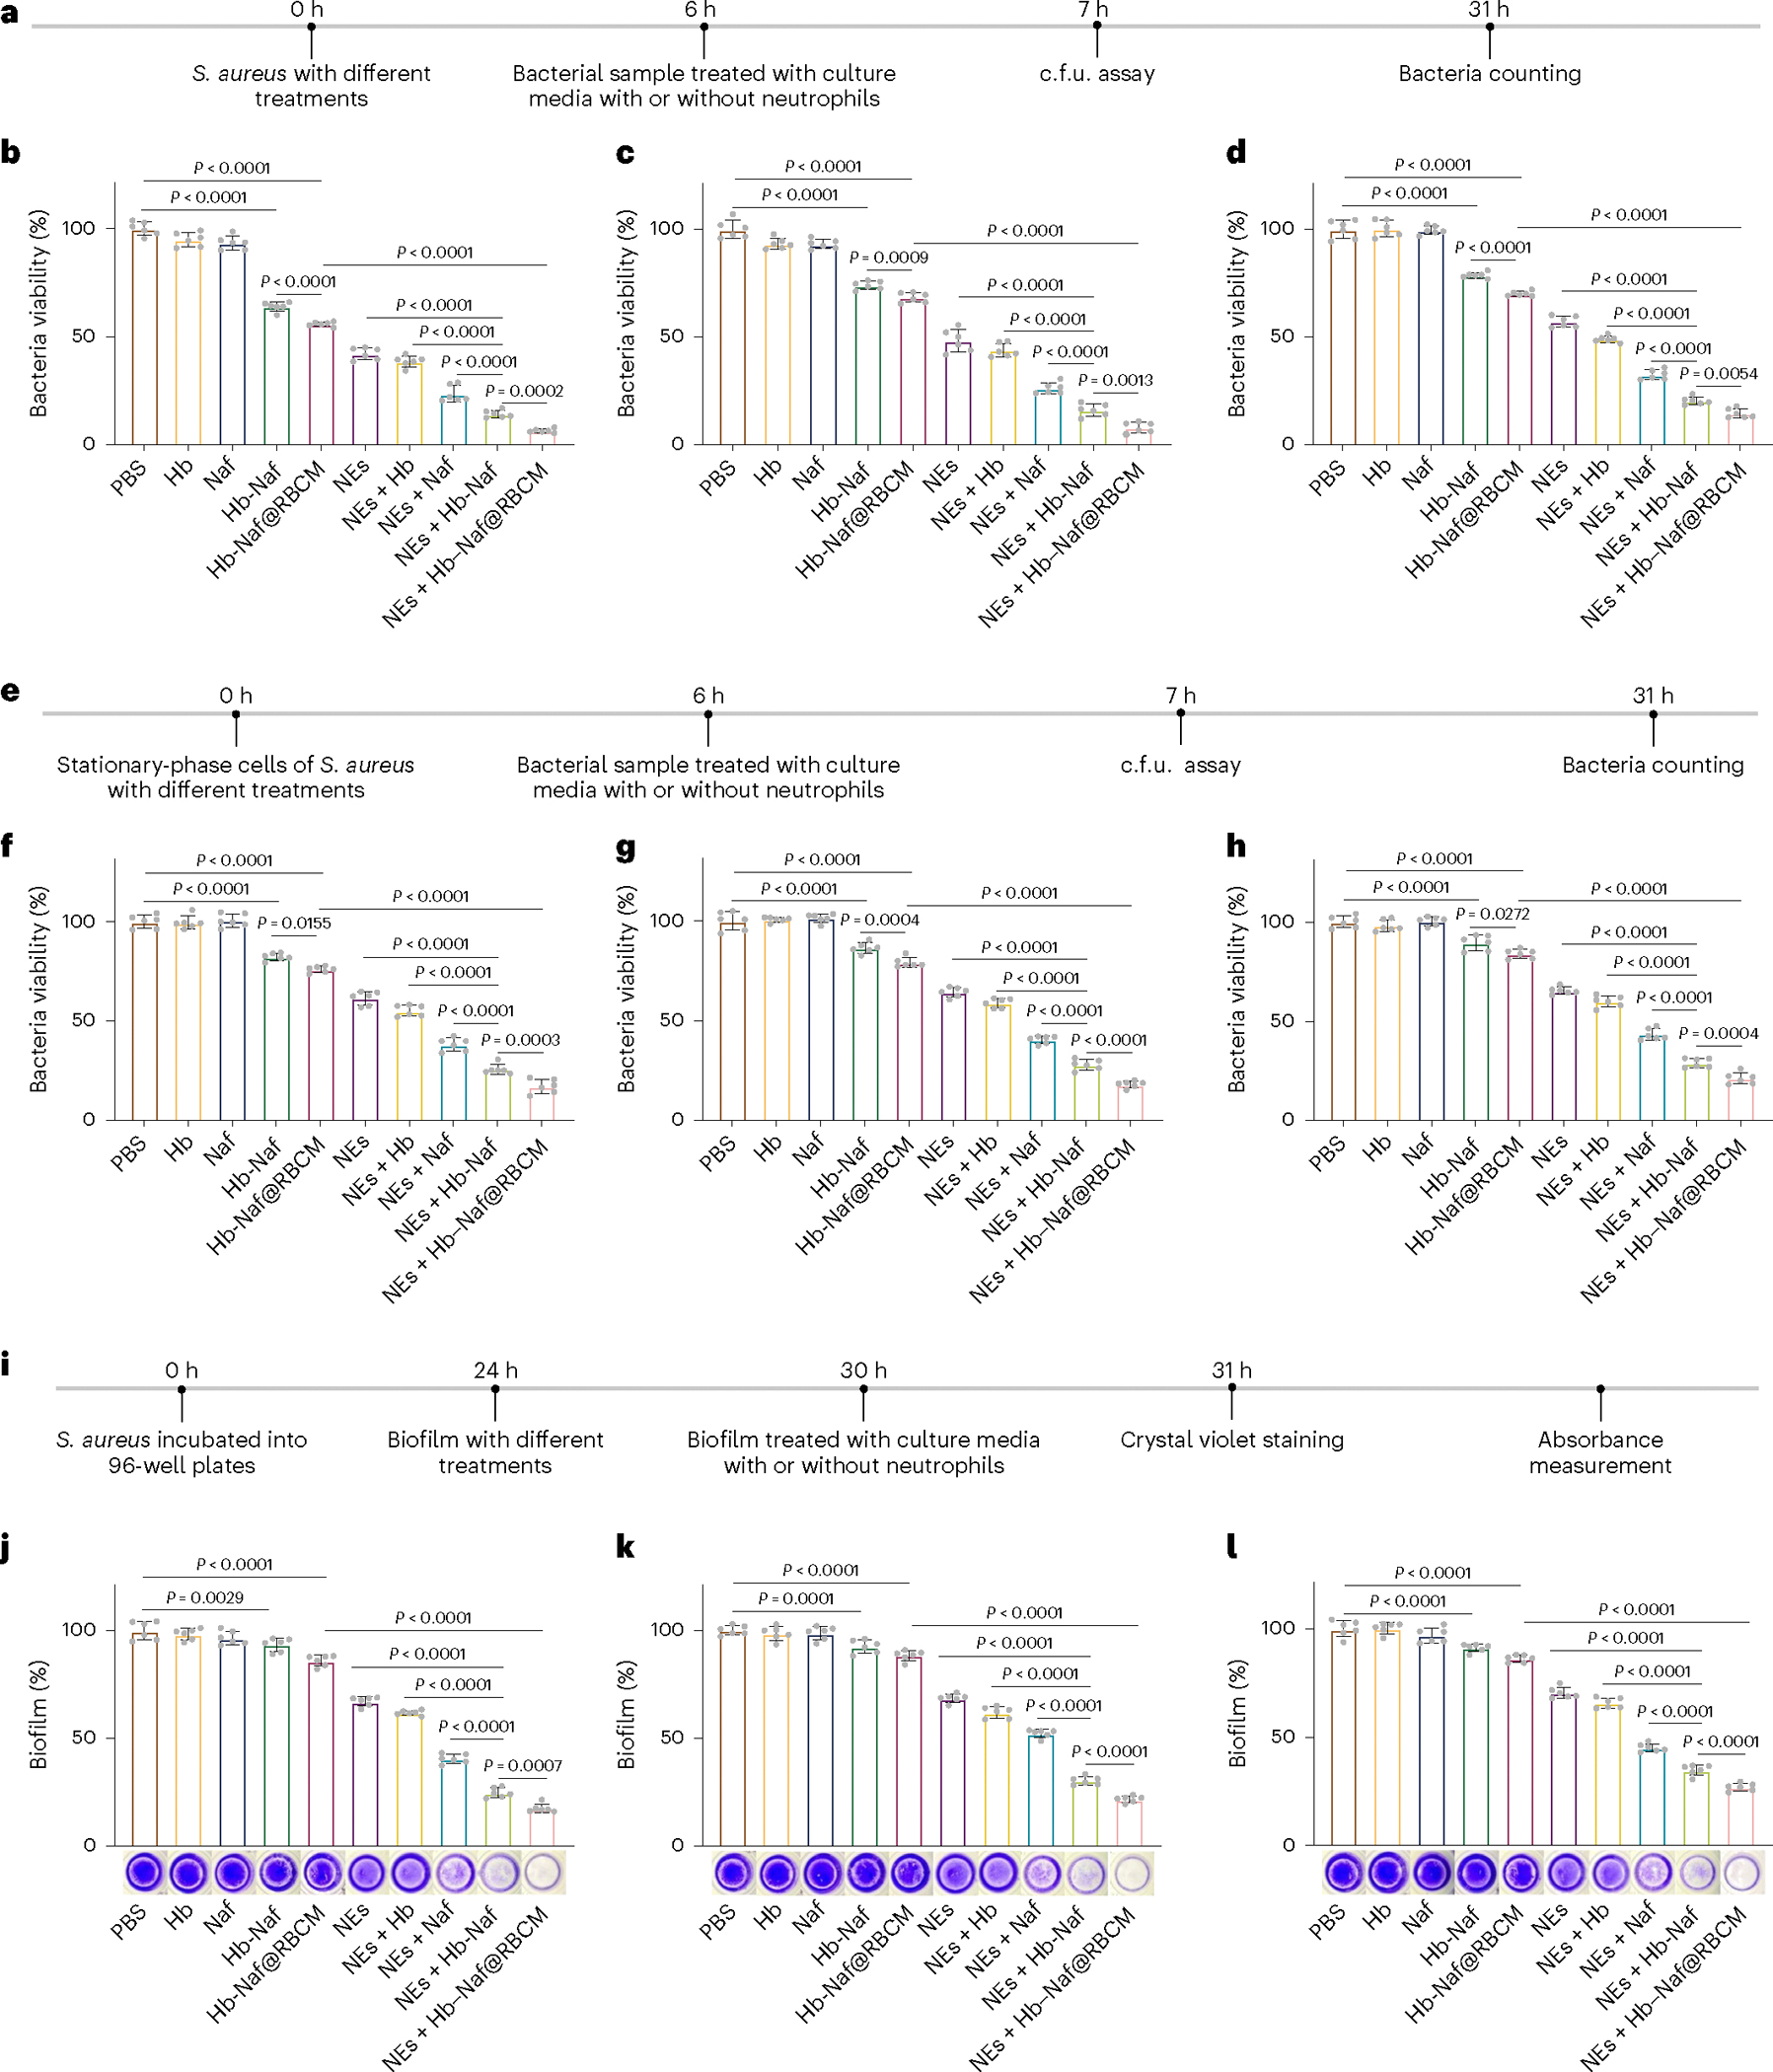
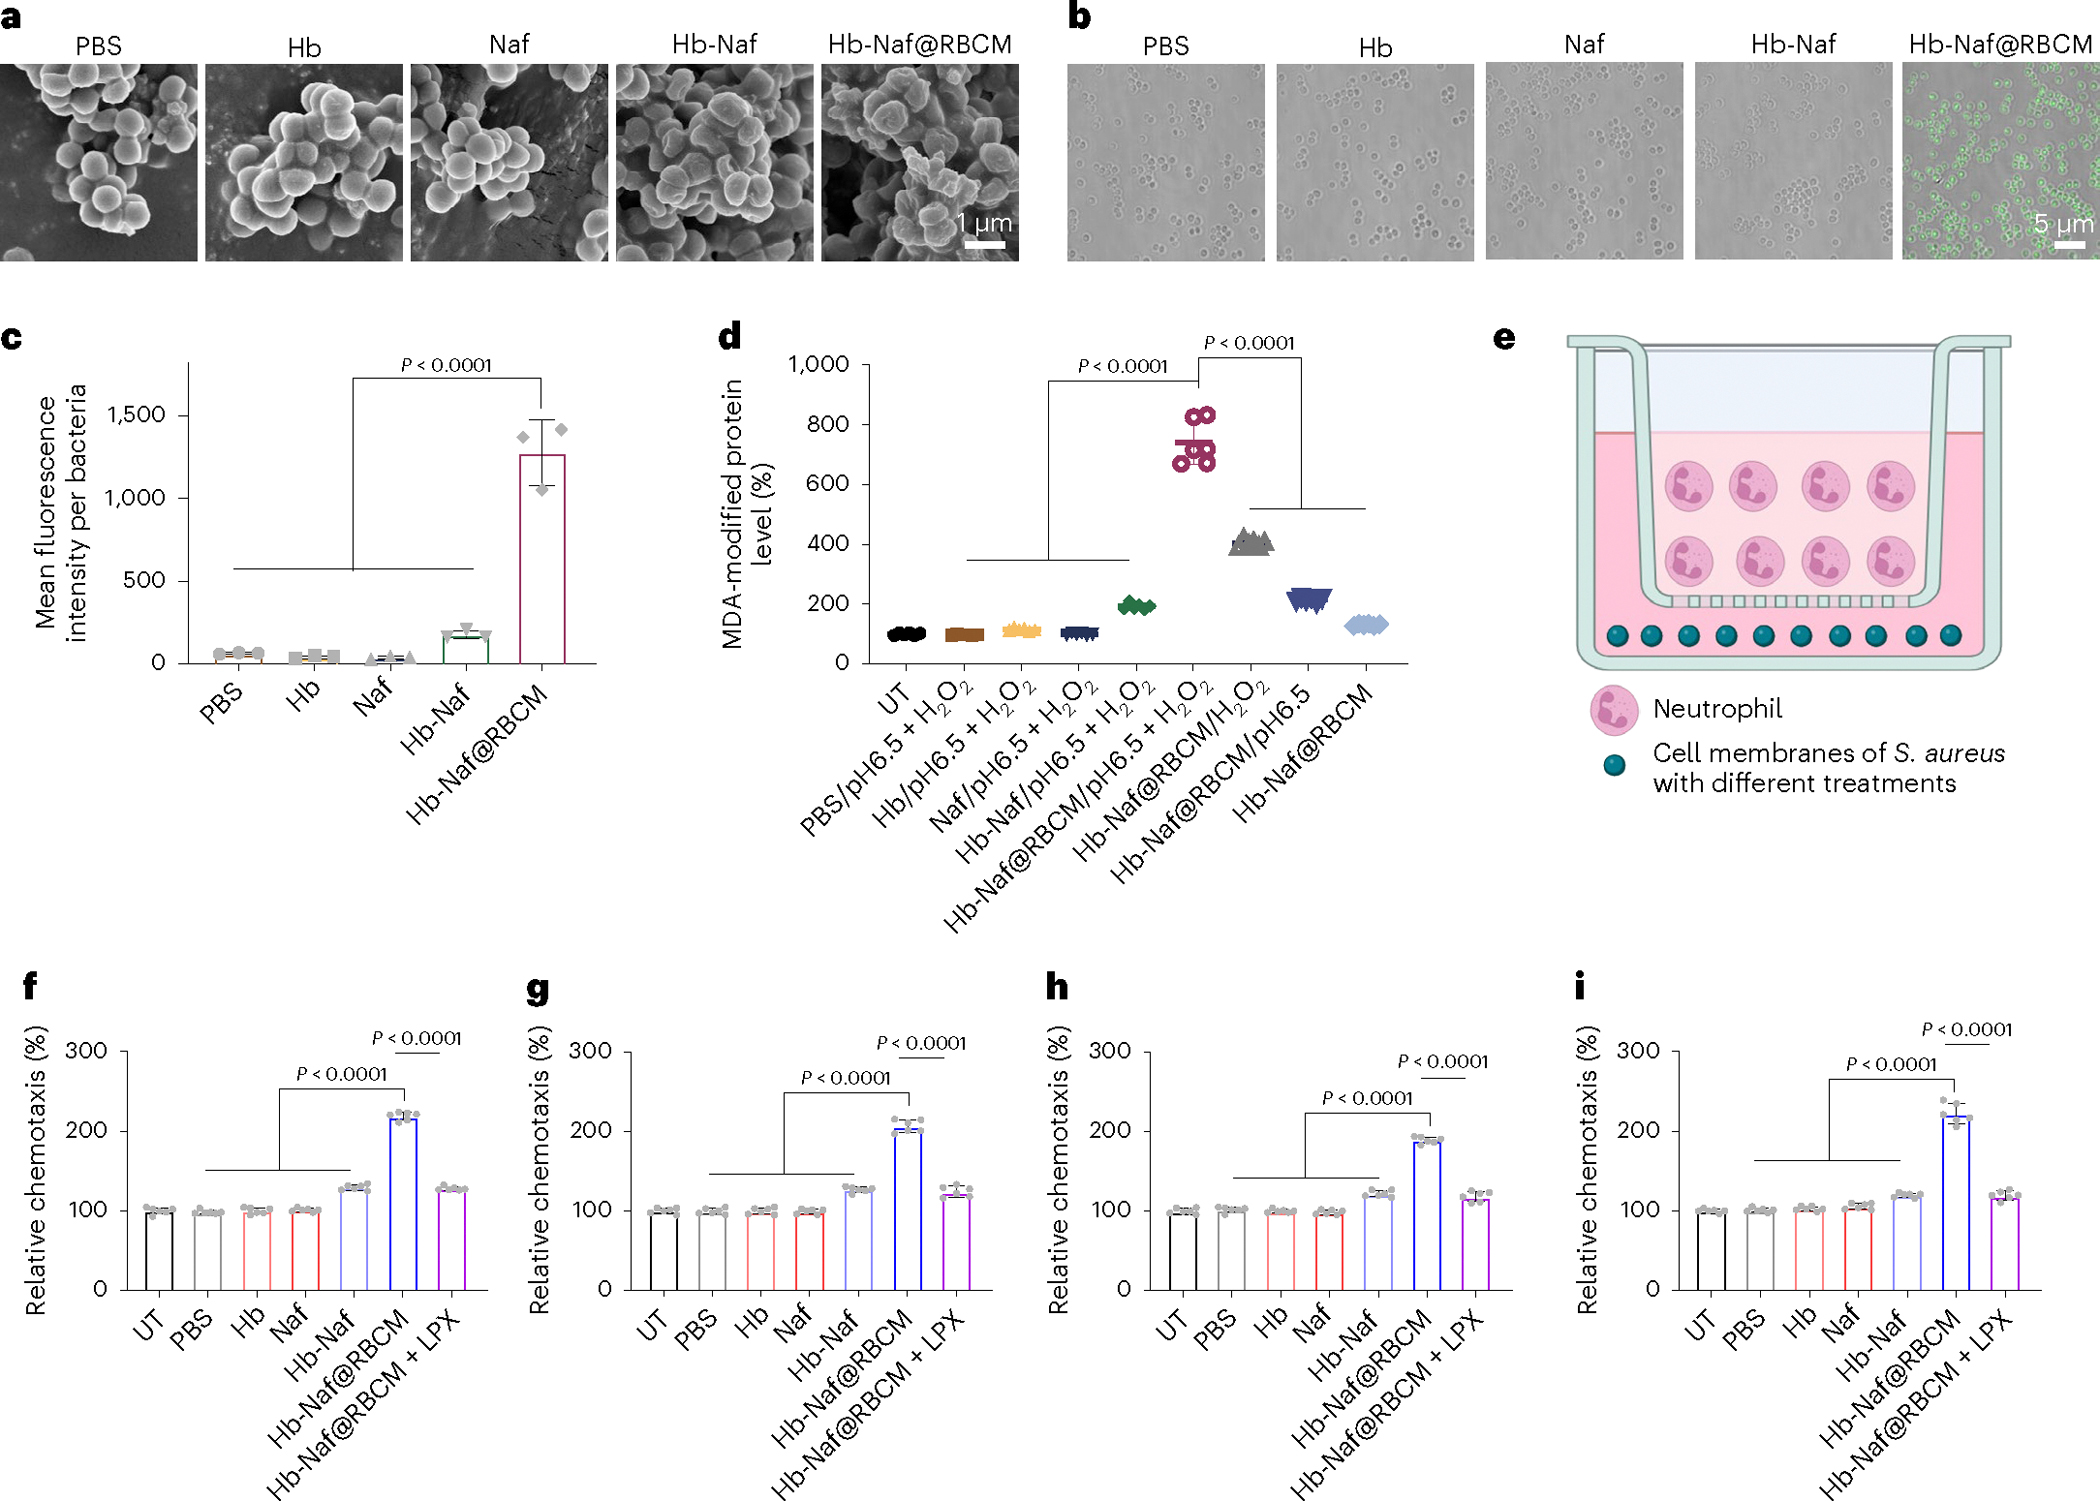
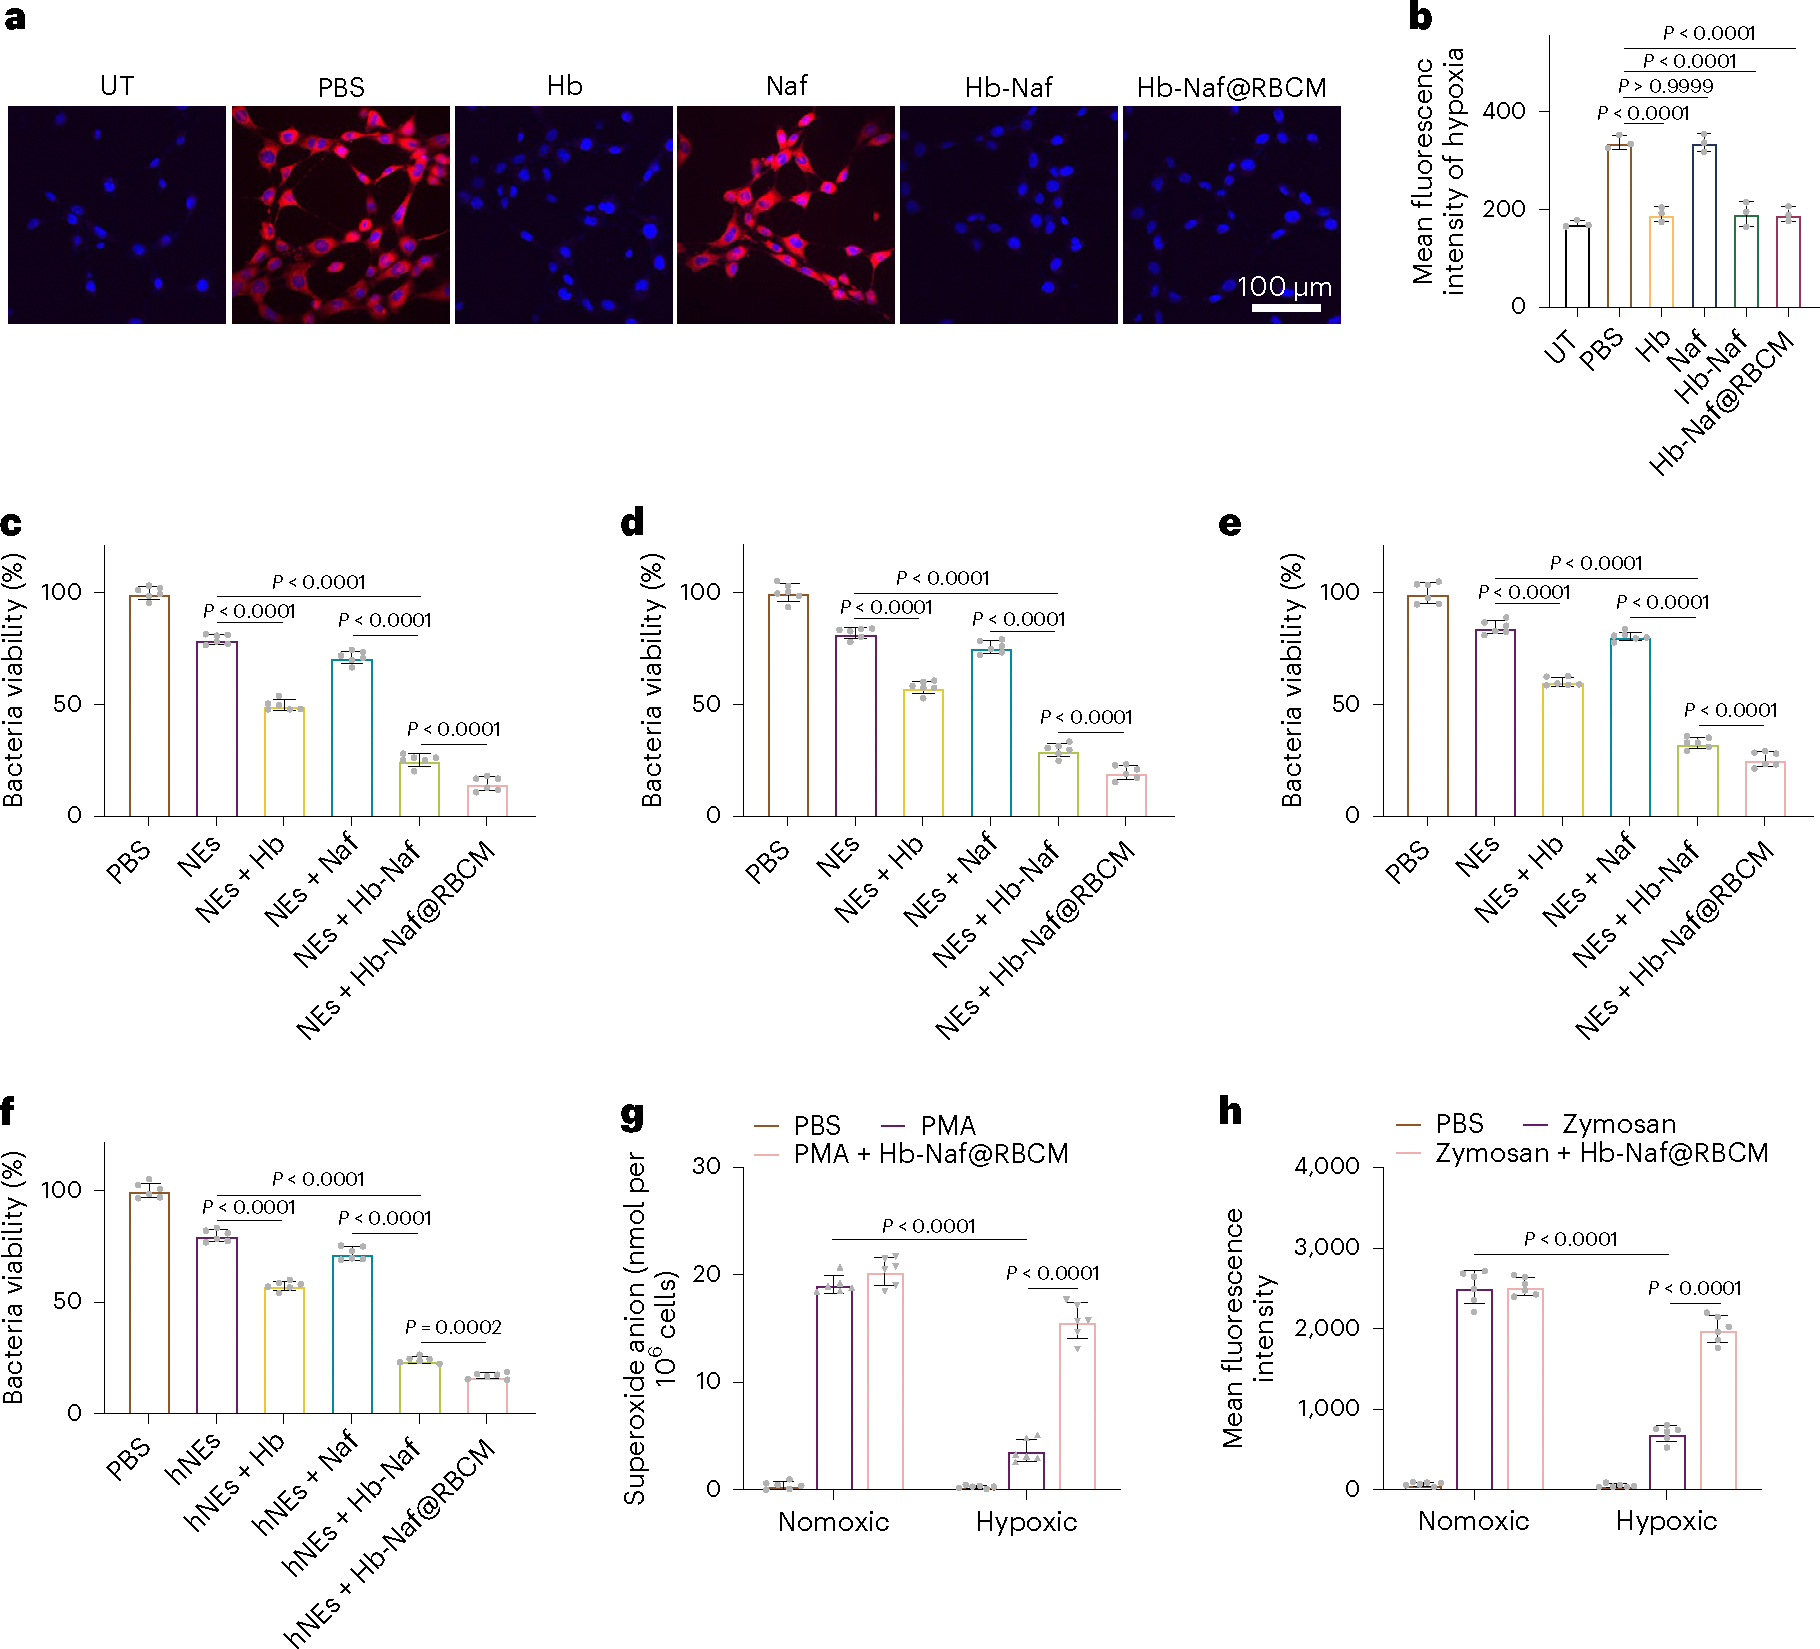
The increasing prevalence of antimicrobial resistance in Staphylococcus aureus necessitates alternative therapeutic approaches. Neutrophils play a crucial role in the fight against S. aureus but suffer from deficiencies in function leading to increased infection. Here we report a nanoparticle-mediated immunotherapy aimed at potentiating neutrophils to eliminate S. aureus. The nanoparticles consist of naftifine, haemoglobin (Hb) and a red blood cell membrane coating. Naftifine disrupts staphyloxanthin biosynthesis, Hb reduces bacterial hydrogen sulfide levels and the red blood cell membrane modifies bacterial lipid composition. Collectively, the nanoparticles can sensitize S. aureus to host oxidant killing. Furthermore, in the infectious microenvironment, Hb triggers lipid peroxidation in S. aureus, promoting neutrophil chemotaxis. Oxygen supplied by Hb can also significantly enhance the bactericidal capability of the recruited neutrophils by restoring neutrophil respiratory burst via hypoxia relief. This multimodal nanoimmunotherapy demonstrates excellent therapeutic efficacy in treating antimicrobial-resistant S. aureus persisters, biofilms and S. aureus-induced infection in mice.


Conflict of interest statement

Competing interests

J.Z. and S.G. are inventors of a pending patent application filed by the Wisconsin Alumni Research Foundation. The other authors declare no competing interests.

Figures

Fig. 1 |
Fig. 1 |. The design and characterization of Hb-Naf@RBCM NPs for treating S. aureus infection.
a, Schematic illustration of the fabrication process of Hb-Naf@RBCM NP. Created with BioRender.com. b, Schematic illustration of the various pathways enabled by Hb-Naf@RBCM NPs to sensitize S. aureus to host oxidant killing. Created with BioRender.com. c, Schematic illustration of Hb-induced lipid peroxidation in S. aureus with its lipid composition modified with PUFAs. Created with BioRender.com. d, Schematic illustration of the mechanisms that Hb-Naf@RBCM NPs employ to enhance the bactericidal activity of neutrophils against S. aureus. Created with BioRender.com. e, The hydrodynamic diameters of various NPs measured by DLS. f, Representative TEM image of Hb-Naf@RBCM NPs. g, Zeta potentials of various NPs measured by DLS. Data are presented as mean ± s.d. (n = 3 biologically independent samples). h, The effects of various treatments on STX levels. Data are presented as mean ± s.d. (n = 6 biologically independent samples). i, Photographs showing the effects of various treatments on MRSA pigmentation. j, Representative images of the lead-acetate-soaked paper strips showing brown stains of lead acetate quantifying gaseous H2S levels generated by MRSA. Numbers indicate the H2S production level relative to the PBS group. k, The H2S levels in three S. aureus strains subjected to various treatments quantified using a WSP5 fluorescent H2S probe. Data are presented as mean ± s.d. (n = 6 biologically independent samples). l, Representative fluorescence images of live MRSA with various treatment groups. A TICT-based fluorescent H2S probe was applied to the live MRSA cells. Higher fluorescence intensity indicates a higher level of H2S. m, Quantification of l. The statistical significance was calculated using the PBS group data as the control. Data are presented as mean ± s.d. (n = 3 biologically independent samples). Statistical significance was calculated via one-way ANOVA with Tukey’s post hoc test. In f,i,j,l, representative images from three independent experiments are shown.
Fig. 2 |
Fig. 2 |. In vitro antibacterial efficacy of Hb-Naf@RBCM NPs against S. aureus planktons, persisters and biofilms.
a, Schematic illustration of the antimicrobial assay on planktonic bacteria. Created with BioRender.com. bd, The viability of S. aureus Newman (b), MRSA (c) and MDRSA (d) under various treatments was determined by plating the bacteria on MH agar plates. Data are presented as mean ± s.d. (n = 6 biologically independent samples). e, Schematic illustration of the antimicrobial assay on S. aureus persisters. Created with BioRender.com. fh, The viability of S. aureus Newman persisters (f), MRSA persisters (g) and MDRSA persisters (h) with various treatments was determined by plating the bacteria on MH agar plates. Data are presented as mean ± s.d. (n = 6 biologically independent samples). i, Schematic illustration of the antimicrobial assay on biofilms. Created with BioRender.com. jl, Quantification of the biofilm mass of S. aureus Newman (j), MRSA (k) and MDRSA (l) with various treatments was determined by crystal violet assay. Data are presented as mean ± s.d. (n = 6 biologically independent samples). Statistical significance was calculated via one-way ANOVA with Tukey’s post hoc test.
Fig. 3 |
Fig. 3 |. Hb-Naf@RBCM NP-induced lipid peroxidation in S. aureus for neutrophil chemotaxis.
a, Representative SEM images showing the morphology of the MRSA treated with PBS, Hb, Naf, Hb-Naf NPs or Hb-Naf@RBCM NPs, respectively, under conditions mimicking an infectious microenvironment (that is, pH 6.5 and 150 μM H2O2). b, Representative CLSM images of MRSA with various treatments in the presence of C11-BODIPY, a lipid-peroxidation-sensitive dye, reflecting the lipid peroxide level in MRSA (green). c, Quantification of the mean fluorescence intensity per bacterium in b. Data are presented as mean ± s.d. (n = 3 biologically independent samples). d, The levels of MDA-modified proteins were measured by ELISA in MRSA with various treatments under various pH and ROS conditions mimicking an infectious microenvironment (that is, pH 6.5 and 150 μM H2O2) for 2 h. Data are presented as mean ± s.d. (n = 6 biologically independent samples). e, Schematic illustration of the transwell cell migration assay. Neutrophils were seeded in the upper chamber while the cell membrane of S. aureus with various treatments was added in the lower chamber. Created with BioRender.com. fi, A transwell cell migration assay was used to determine the chemotaxis of murine neutrophils or human neutrophils to the cell membrane of S. aureus Newman (murine neutrophils) (f), MRSA (murine neutrophils) (g), MDRSA (murine neutrophils) (h) and MRSA (human neutrophils) (i) with various treatments. Data are presented as mean ± s.d. (n = 6 biologically independent samples). Statistical significance was calculated via one-way ANOVA with Tukey’s post hoc test. UT, untreated. In a,b, representative images from three independent experiments are shown.
Fig. 4 |
Fig. 4 |. Enhanced in vitro antimicrobial efficacy of neutrophils in a hypoxic microenvironment by Hb-Naf@RBCM NPs.
a, Representative CLSM images of NIH 3T3 cells with various treatments in the presence of a red hypoxia detection probe (ROS-ID hypoxia/oxidative stress detection kit). The levels of hypoxia within cells are reflected by red fluorescence. Cell nuclei were stained by Hoechst 33342 (blue). b, Mean fluorescence intensity of a red hypoxia detection probe (ROS-ID hypoxia/oxidative stress detection kit) indicating the hypoxia level in NIH 3T3 cells with various treatments. Data are presented as mean ± s.d. (n = 3 biologically independent samples). cf, The viability of S. aureus Newman (murine neutrophils) (c), MRSA (murine neutrophils) (d), MDRSA (murine neutrophils) (e) and MRSA (human neutrophils) (f) with various treatments under hypoxic conditions was determined by plating the bacteria on MH agar plates. Data are presented as mean ± s.d. (n = 6 biologically independent samples). g, Extracellular superoxide generation by neutrophils stimulated with PMA (200 nM) was assessed by a superoxide anion assay kit. Data are presented as mean ± s.d. (n = 6 biologically independent samples). h, The intracellular ROS level of neutrophils stimulated with zymosan A was determined by CM-H2DCFDA (chloromethyl derivative of H2DCFDA) staining and flow cytometry. Data are presented as mean ± s.d. (n = 6 biologically independent samples). Statistical significance was calculated via one-way ANOVA with Tukey’s post hoc test. In a, representative images from three independent experiments are shown.
Fig. 5 |
Fig. 5 |. In vivo therapeutic efficacy of Hb-Naf@RBCM NPs in mice with MRSA thigh infection and MRSA pneumonia.
a, Schematic illustration of the experimental procedures used in the MRSA thigh infection model study. Created with BioRender.com. b, Ex vivo fluorescence images represent the in vivo biodistribution of Cy5.5-labelled Hb-Naf NPs and Hb-Naf@RBCM NPs in mice with MRSA thigh infection at 6 h and 24 h post-administration of NPs. c, The bacteria burden in mice with MRSA thigh infection was determined by serial dilution and plate counting of homogenized muscles. Data are presented as mean ± s.d. (n = 6 biologically independent animals). d, Immunostaining was performed to study the quadriceps muscles of mice with MRSA-induced thigh infection. Mice were treated with PBS, Hb-Naf NPs or Hb-Naf@RBCM NPs. Neutrophils were stained with anti-Ly6G antibodies (green). Myofibre boundaries were distinguished using anti-laminin antibodies (red). Nuclei were highlighted with DAPI (blue). Hb-Naf or Hb-Naf@RBCM NPs were labelled with Cy5 (magenta). e,f, The area percentage of Ly6G (neutrophil-positive area) (e) and the mean fluorescence intensity of Cy5 signals (f) were analysed. Data are presented as mean ± s.d. (n = 3 biologically independent animals). g, Schematic illustration of the experimental steps for the antimicrobial efficacy study in the MRSA lung infection model. Created with BioRender.com. h, The bacterial burden in mice with MRSA lung infection was determined through serial dilution and plate counting of homogenized organs. Data are presented as mean ± s.d. (n = 6 biologically independent animals). Statistical significance was calculated via one-way ANOVA with Tukey’s post hoc test. In b,d, representative images from three independent experiments are shown.
Fig. 6 |
Fig. 6 |. In vivo therapeutic efficacy of Hb-Naf@RBCM NPs in mice with MRSA peritonitis and MDRSA bacteraemia.
a, Experimental procedures for assessing antimicrobial efficacy in the S. aureus MRSA peritonitis model. Created with BioRender.com. b,c, Survival (b) and body weight (c) analyses of mice in the MRSA peritonitis model. Data are presented as mean ± s.d. (n = 8 biologically independent animals). Statistical significance was calculated via a log-rank test. d, Therapeutic efficacy of Hb-Naf@RBCM NPs in the mouse MRSA peritonitis model. The c.f.u. in the major organs and ascites were determined 12 h post-infection through serial dilution and plate counting of homogenized organs or ascites. Data are presented as mean ± s.d. (n = 6 biologically independent animals). Statistical significance was calculated via one-way ANOVA with Tukey’s post hoc test. e, Experimental procedures for assessing antimicrobial efficacy in the MDRSA bacteraemia model. Created with BioRender.com. f,g, Survival (f) and body weight (g) analyses of mice in the MDRSA bacteraemia model with various treatments. Data are presented as mean ± s.d. (n = 8 biologically independent animals). Statistical significance was calculated via a log-rank test. h, Therapeutic efficacy of Hb-Naf@RBCM NPs in the mouse MDRSA bacteraemia model. The c.f.u.s in the major organs and blood were determined 12 h post-infection through serial dilution and plate counting of homogenized organs or blood. Data are presented as mean ± s.d. (n = 6 biologically independent animals). Statistical significance was calculated via one-way ANOVA with Tukey’s post hoc test. i, Representative H&E staining images of tissue sections from healthy mice or infected mice treated with PBS or Hb-Naf@RBCM NPs. Orange arrows indicate inflammatory cell infiltration. Green arrows indicate cell necrosis. Blue arrows indicate vacuolation. Yellow arrows indicate proteinaceous fluid congestion. Black arrows indicate congestion. In i, representative images from three independent experiments are shown.

Similar articles

Cited by

References

    1. Antimicrobial Resistance and Primary Health Care (World Health Organization, 2018).
    1. Tacconelli E et al. Discovery, research, and development of new antibiotics: the WHO priority list of antibiotic-resistant bacteria and tuberculosis. Lancet Infect. Dis. 18, 318–327 (2018). - PubMed
    1. Lowy FD Staphylococcus aureus infections. N. Engl. J. Med. 339, 520–532 (1998). - PubMed
    1. Solomon SL & Oliver KB Antibiotic resistance threats in the United States: stepping back from the brink. Am. Fam. Physician 89, 938–941 (2014). - PubMed
    1. Daum RS Clinical practice. Skin and soft-tissue infections caused by methicillin-resistant Staphylococcus aureus. N. Engl. J. Med. 357, 380–390 (2007). - PubMed

Substances

LinkOut - more resources