. 2024 Apr 17;16(1):17.
doi: 10.1186/s11689-024-09530-3.

The Brain Gene Registry: a data snapshot

Collaborators, Affiliations

The Brain Gene Registry: a data snapshot

Dustin Baldridge et al. J Neurodev Disord. .

Abstract

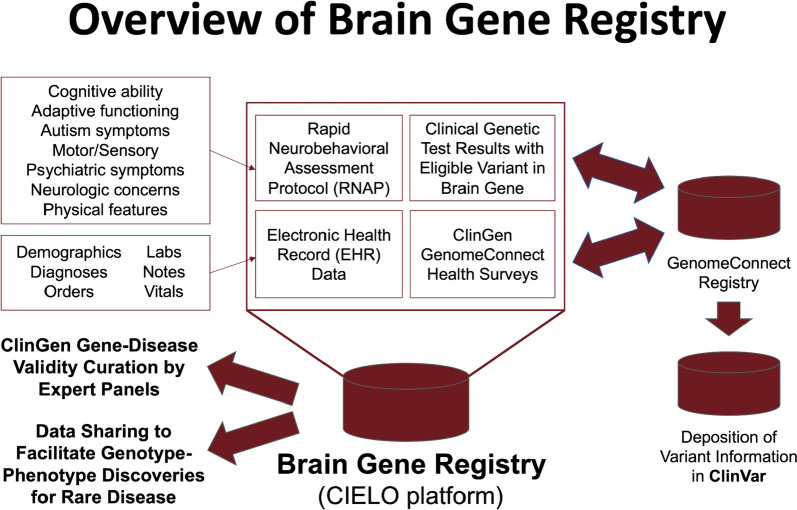
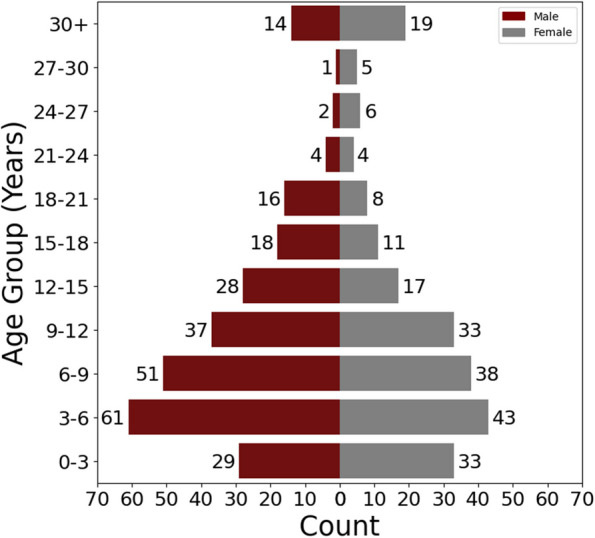
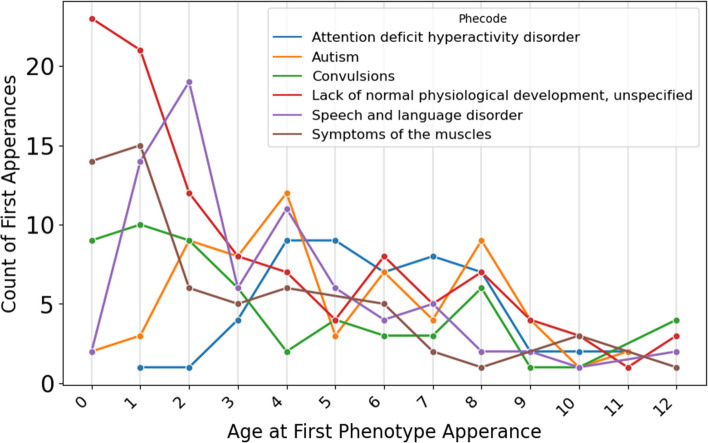
Monogenic disorders account for a large proportion of population-attributable risk for neurodevelopmental disabilities. However, the data necessary to infer a causal relationship between a given genetic variant and a particular neurodevelopmental disorder is often lacking. Recognizing this scientific roadblock, 13 Intellectual and Developmental Disabilities Research Centers (IDDRCs) formed a consortium to create the Brain Gene Registry (BGR), a repository pairing clinical genetic data with phenotypic data from participants with variants in putative brain genes. Phenotypic profiles are assembled from the electronic health record (EHR) and a battery of remotely administered standardized assessments collectively referred to as the Rapid Neurobehavioral Assessment Protocol (RNAP), which include cognitive, neurologic, and neuropsychiatric assessments, as well as assessments for attention deficit hyperactivity disorder (ADHD) and autism spectrum disorder (ASD). Co-enrollment of BGR participants in the Clinical Genome Resource's (ClinGen's) GenomeConnect enables display of variant information in ClinVar. The BGR currently contains data on 479 participants who are 55% male, 6% Asian, 6% Black or African American, 76% white, and 12% Hispanic/Latine. Over 200 genes are represented in the BGR, with 12 or more participants harboring variants in each of these genes: CACNA1A, DNMT3A, SLC6A1, SETD5, and MYT1L. More than 30% of variants are de novo and 43% are classified as variants of uncertain significance (VUSs). Mean standard scores on cognitive or developmental screens are below average for the BGR cohort. EHR data reveal developmental delay as the earliest and most common diagnosis in this sample, followed by speech and language disorders, ASD, and ADHD. BGR data has already been used to accelerate gene-disease validity curation of 36 genes evaluated by ClinGen's BGR Intellectual Disability (ID)-Autism (ASD) Gene Curation Expert Panel. In summary, the BGR is a resource for use by stakeholders interested in advancing translational research for brain genes and continues to recruit participants with clinically reported variants to establish a rich and well-characterized national resource to promote research on neurodevelopmental disorders.

Keywords: Brain gene registry; Electronic health records; Neurodevelopmental disorders.


Conflict of interest statement

The authors declare that they have no competing interests.

Figures

Fig. 1
Fig. 1
Description of Brain Gene Registry (BGR). Details are provided for BGR data elements, the relationship with GenomeConnect and ClinVar, and project outputs, including gene-disease curation and data sharing
Fig. 2
Fig. 2
Age and sex distribution of enrolled BGR Participants (N = 479). Male (maroon bars) and female (gray bars) BGR participants are binned into 3-year age groups
Fig. 3
Fig. 3
Classification of the most common brain gene variants within the BGR. Only genes in which there are variants in 3 or more individuals are shown. 50 individuals have variants in more than one brain gene and are represented multiple times in this analysis
Fig. 4
Fig. 4
Distribution of cognitive scores for BGR participants. A) DP-4 assessment (N = 190), B) Shipley assessment (N = 130). Scores of < 40 (4 SD below General Population) were recorded as 40 for the DP-4
Fig. 5
Fig. 5
Distribution of Vineland-3 standard scores across 5 behavior categories. Distribution of scores observed in the entire BGR cohort (N = 479). Blue line indicates the general population score distribution
Fig. 6
Fig. 6
Distribution of ASEBA-CBCL behavior report T-Scores for individuals within the registry. Score areas are color-coded indicating normal scores (< 65, blue), at-risk or borderline scores (65–70, green), and clinical range scores (> 70, yellow)
Fig. 7
Fig. 7
Medical specialty encounters in the BGR. Data were obtained from available electronic health records with encounter data (N = 179 participants)
Fig. 8
Fig. 8
Phecode diagnoses across the BGR cohort. Phecode data were derived from BGR participants for whom ICD-10 codes were available in their electronic health records in CIELO (N = 207). Individual participants are represented only once per Phecode
Fig. 9
Fig. 9
Distribution of BGR participant age at the first appearance of each Phecode (N = 207 patients). The number of participants with an ICD-10 code corresponding to the specified Phecode is plotted according to the participant’s age at first appearance of that Phecode in their medical record. A single participant is represented only once in a given Phecode
Fig. 10
Fig. 10
Frequency of self-reported seizure types among all BGR participants (N = 34) (left) compared to participants with SLC6A1 variants (N = 5) (right). Data was generated from the participant/parent self-report GenomeConnect seizure survey. A single participant may report multiple different types of seizures in the same survey, leading to higher total count than the number of participants. The focal seizure data points include those with atypical absence and complex partial seizures. Generalized tonic–clonic includes grand mal seizures and general convulsions. Individuals with SLC6A1 variants are shown because it was the most common gene among participants who took the survey
Fig. 11
Fig. 11
Seizure medication use among all BGR participants (N = 110) (left) compared to participants with CACNA1A variants (N = 7) (right). Data represent participants who completed the self-reported seizure survey in the RNAP. A single individual may report multiple seizure medications. Individuals with a CACNA1A variant are shown because it was the most gene among participants who completed the survey
Fig. 12
Fig. 12
Venn diagrams showing the overlap of seizure medication usage among BGR participants comparing self-reported data with EHR data. Only participants with both the RNAP seizure survey data and EHR extracted medication data are included (N=38).

References

    1. Association AP. Diagnostic and statistical manual of mental disorders : DSM-5. 5. Arlington, VA: American Psychiatric Association; 2013.
    1. Srivastava S, Love-Nichols JA, Dies KA, Ledbetter DH, Martin CL, Chung WK, et al. Meta-analysis and multidisciplinary consensus statement: exome sequencing is a first-tier clinical diagnostic test for individuals with neurodevelopmental disorders. Genet Med. 2019;21(11):2413–2421. doi: 10.1038/s41436-019-0554-6. - DOI - PMC - PubMed
    1. Srivastava S, Lewis SA, Cohen JS, Zhang B, Aravamuthan BR, Chopra M, et al. Molecular Diagnostic Yield of Exome Sequencing and Chromosomal Microarray in Cerebral Palsy: A Systematic Review and Meta-analysis. JAMA Neurol. 2022;79(12):1287–1295. doi: 10.1001/jamaneurol.2022.3549. - DOI - PMC - PubMed
    1. Manickam K, McClain MR, Demmer LA, Biswas S, Kearney HM, Malinowski J, et al. Exome and genome sequencing for pediatric patients with congenital anomalies or intellectual disability: an evidence-based clinical guideline of the American College of Medical Genetics and Genomics (ACMG) Genet Med. 2021;23(11):2029–2037. doi: 10.1038/s41436-021-01242-6. - DOI - PubMed
    1. Baldridge D, Heeley J, Vineyard M, Manwaring L, Toler TL, Fassi E, et al. The Exome Clinic and the role of medical genetics expertise in the interpretation of exome sequencing results. Genet Med. 2017;19(9):1040–1048. doi: 10.1038/gim.2016.224. - DOI - PMC - PubMed

Publication types