. 2024 Apr 18;21(1):101.
doi: 10.1186/s12974-024-03061-3.

Microbiota-derived acetate attenuates neuroinflammation in rostral ventrolateral medulla of spontaneously hypertensive rats

Affiliations

Microbiota-derived acetate attenuates neuroinflammation in rostral ventrolateral medulla of spontaneously hypertensive rats

Xiaopeng Yin et al. J Neuroinflammation. .

Abstract

Background: Increased neuroinflammation in brain regions regulating sympathetic nerves is associated with hypertension. Emerging evidence from both human and animal studies suggests a link between hypertension and gut microbiota, as well as microbiota-derived metabolites short-chain fatty acids (SCFAs). However, the precise mechanisms underlying this gut-brain axis remain unclear.

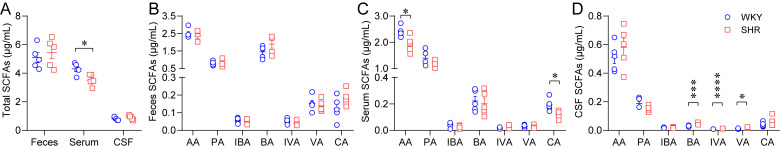
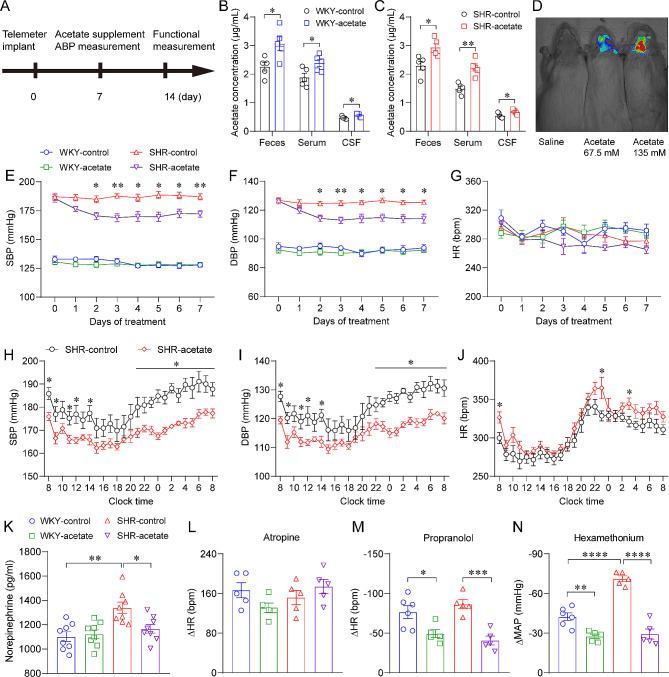
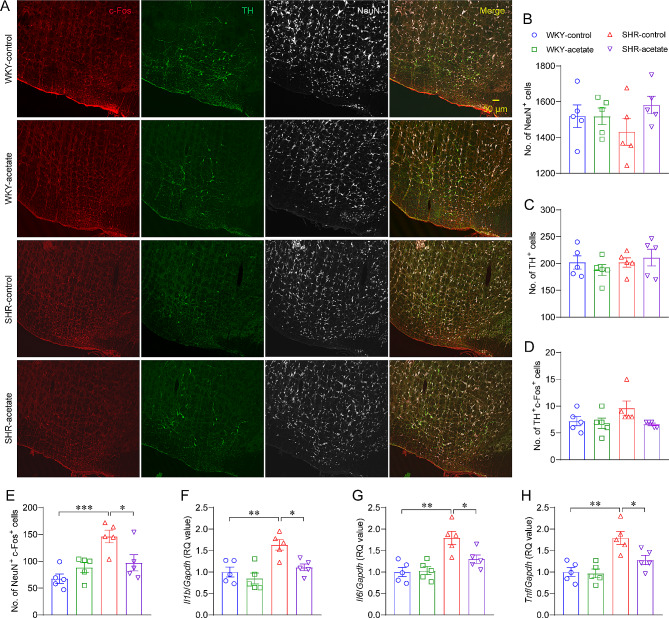
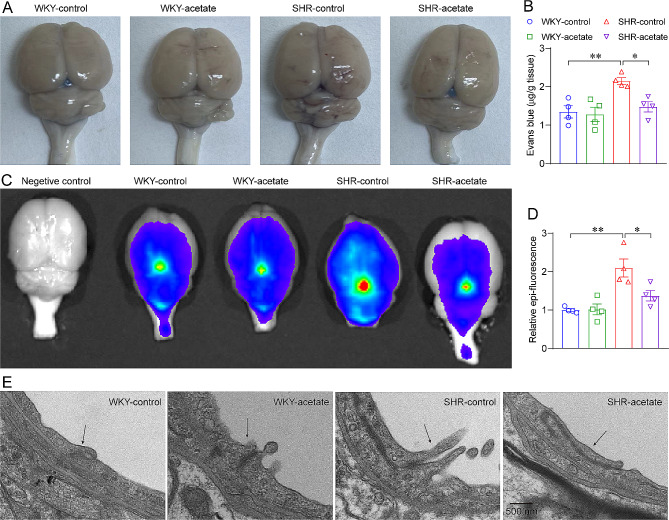
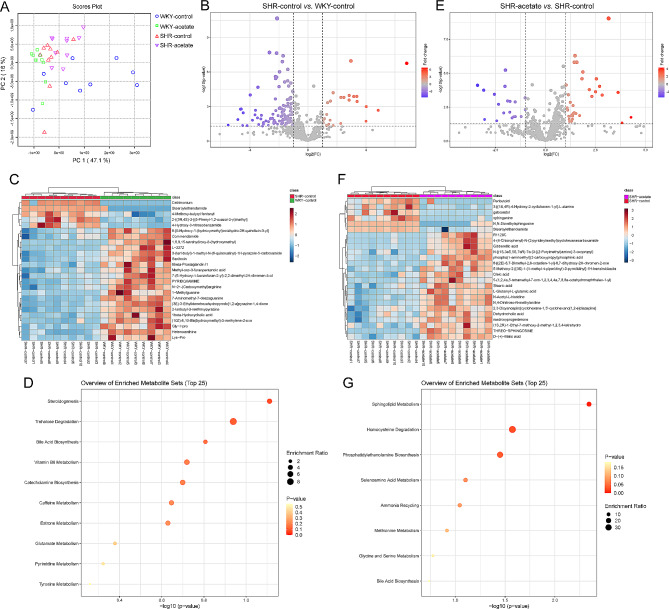
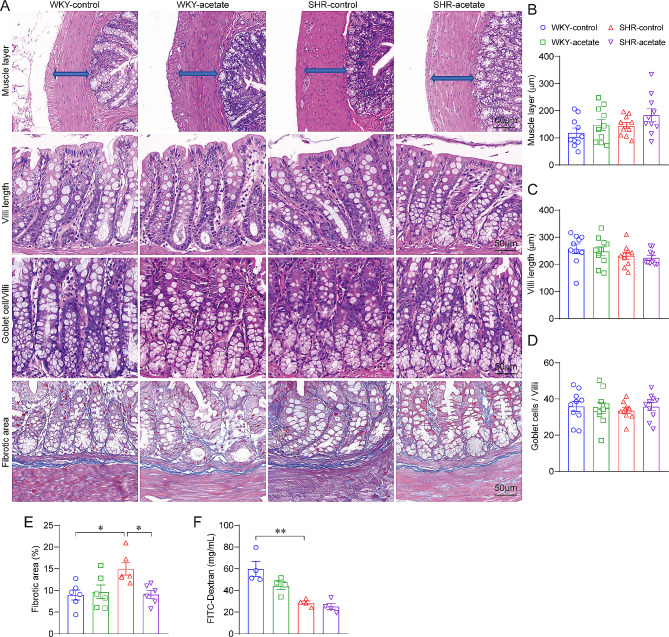
Methods: The levels of microbiota-derived SCFAs in spontaneously hypertensive rats (SHRs) were determined by gas chromatography-mass spectrometry. To observe the effect of acetate on arterial blood pressure (ABP) in rats, sodium acetate was supplemented via drinking water for continuous 7 days. ABP was recorded by radio telemetry. The inflammatory factors, morphology of microglia and astrocytes in rostral ventrolateral medulla (RVLM) were detected. In addition, blood-brain barrier (BBB) permeability, composition and metabolomics of the gut microbiome, and intestinal pathological manifestations were also measured.

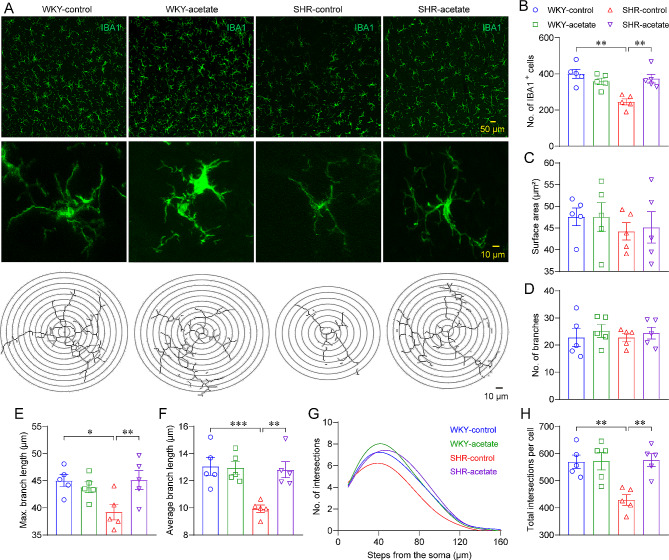
Results: The serum acetate levels in SHRs are lower than in normotensive control rats. Supplementation with acetate reduces ABP, inhibits sympathetic nerve activity in SHRs. Furthermore, acetate suppresses RVLM neuroinflammation in SHRs, increases microglia and astrocyte morphologic complexity, decreases BBB permeability, modulates intestinal flora, increases fecal flora metabolites, and inhibits intestinal fibrosis.

Conclusions: Microbiota-derived acetate exerts antihypertensive effects by modulating microglia and astrocytes and inhibiting neuroinflammation and sympathetic output.

Keywords: Gut microbiota; Hypertension; Neuroinflammation; Short-chain fatty acid.


Conflict of interest statement

The authors declare no competing interests.

Figures

Fig. 1
Fig. 1
Levels of short-chain fatty acids (SCFAs) in spontaneously hypertensive rats (SHRs). A, total levels of SCFAs in feces, serum, and cerebrospinal fluid (CSF) in Wistar-Kyoto (WKY) rats and SHRs. B-D, fecal, serum and cerebrospinal fluid levels of each SCFAs in WKY rats and SHRs. n = 5 for each phenotype. AA, acetic acid; PA, propionic acid; IBA, isobutyric acid; BA, butyric acid; IVA, isovaleric acid; VA, valeric acid; CA, caproic acid. * P < 0.05, *** P < 0.001, **** P < 0.0001
Fig. 2
Fig. 2
Acetate reduces arterial blood pressure (ABP) in SHRs. A, schematic diagram for implant operation and acetate treatment. B-C, increased acetate levels in feces, serum and cerebrospinal fluid of WKY rats and SHRs after 1 week of acetate treatment. n = 5 for each group. D, fluorescent signals detected in brain tissues after intravenous injection of Cy5-labeled acetate in WKY rats. E-G, acetate treatment reduces SBP and diastolic blood pressure (DBP) without altering heart rate (HR) in SHRs. n = 7 for each group. H-J, effects of acetate treatment for 1 week on 24-h ambulatory blood pressure in SHR rats. n = 10 for each group. K, 1-week acetate treatment reduced serum norepinephrine levels in SHRs. n = 8 for each group. L, tachycardic response induced by intraperitoneal injection of atropine; M, propranolol-induced bradycardia response; N, hypotensive effect induced by hexamethonium. n = 5 for each group. * P < 0.05, ** P < 0.01, *** P < 0.001, **** P < 0.0001
Fig. 3
Fig. 3
Acetate inhibited neuroinflammation in rostral ventrolateral medulla (RVLM) in SHRs. A, immunofluorescence photomicrographs showing triple labelling of c-Fos (red), tyrosine hydroxylase (TH, green) and neuronal nuclei (NeuN, white) in RVLM (bregma: −12.3 mm) of each group. B-E, the number of NeuN+, TH+, TH+c-Fos+ and NeuN+c-Fos+ neurons in each group. F-H, relative expression of inflammatory factors such as interleukin 1 beta (Il1b), interleukin 6 (Il6) and tumor necrosis factor (Tnf) mRNA in the RVLM of rats in various groups by qPCR. n = 5 for each group. * P < 0.05, ** P < 0.01, *** P < 0.001
Fig. 4
Fig. 4
Acetate regulation of microglia morphology in the RVLM of SHRs. A, illustrative figures showcasing the expression of ionized calcium-binding adapter molecule 1 (IBA1) in the RVLM (top panes), along with photomicrographs of distinct IBA1-positive microglia (middle panes), accompanied by their respective traced contours in the lower panels (bottom panes). B-F, quantification of the density, soma size, number of branches, the maximal and average branches length of IBA1+ microglia. G, a non-linear curve fitting represents the average count of microglial branch intersections per 10 μm increment away from the cell body, as determined through Sholl analysis. H, the total area under the curve (AUC) of individual microglia, derived from Sholl analysis. n = 5 for each group. * P < 0.05, ** P < 0.01, *** P < 0.001
Fig. 5
Fig. 5
Effect of acetate on the morphology of astrocytes in the RVLM of SHRs. A, representative images displaying glial fibrillary acidic protein (GFAP) expression in the RVLM were presented in the top panels, the middle panels feature micrographs of individual GFAP-positive astrocytes, while the traced outlines of these cells were displayed in the bottom panels. B-F, assessment of GFAP-positive astrocytes characteristics such as cell density, size of soma, count of branches, and both the longest and average lengths of the branches. G, a non-linear curve fitting illustrates the average frequency of branch intersections per 10 μm from the astrocytes cell soma, as calculated using Sholl analysis. H, the AUC ascertained from Sholl analysis for individual astrocyte. n = 5 for each group. * P < 0.05, ** P < 0.01, *** P < 0.001, **** P < 0.0001
Fig. 6
Fig. 6
Acetate reduces blood-brain barrier (BBB) permeability in SHRs. A, assessment of BBB permeability by injection of Evans blue dye. B, OD620 readings of the brain tissues following Evans blue dye injection. C, application of small animal imaging to assess BBB permeability by injection of Cy5-Dextran (10 kDa). D, the relative Epi-fluorescence of brains in each group rats. n = 4 for each group. * P < 0.05, ** P < 0.01.E, transmission electron microscopic observation of vascular endothelial tight junction structure in the medulla of rats. The tight junctions between capillary endothelial cells are indicated by the arrows
Fig. 7
Fig. 7
Acetate modulation of the gut microbiota in SHRs. A-B, α-diversity of gut microbiota detected by 16 S rRNA sequencing. C, the principal component analysis (PCA) based β-diversity depicts the clustering of gut microbial communities across various groups. D-G, effect of acetate supplementation on the relative abundance of acetate-, propionate-, butyrate- and lactate-producing bacteria in rats. n = 5 for each group. H-I, α-diversity of gut microbiota in 5-week-old juvenile SHRs (j-SHRs) and age-matched WKY rats (j-WKYs). J, PCA analysis of β-diversity in the intestinal flora of juvenile rats. K-N, relative abundance of acetate-, propionate-, butyrate- and lactate-producing bacteria in juvenile rats. n = 6 for each group. * P < 0.05, ** P < 0.01, *** P < 0.001, **** P < 0.0001
Fig. 8
Fig. 8
Acetate significantly increased intestinal flora metabolites in SHRs. A, PCA analysis showing spatial division for the fecal metabolome. B, the volcano plot graph of altered metabolites in control WKY rats and SHRs. C, the heatmap displays the top 25 metabolites with significant differential abundance between control WKY rats and SHRs. D, bubble plot showing the differential metabolic pathways analysis of fecal metabolites in control WKY rats and SHRs. E, the volcano plot illustrates the profile of metabolites altered in SHRs treated with acetate compared to control SHRs. F, the heatmap depicts the 25 most significantly differentially abundant metabolites when comparing acetate treatment SHRs to control SHRs. G, the bubble plot presents an analysis of the differential metabolic pathways associated with fecal metabolites in SHRs treated with acetate versus control SHRs
Fig. 9
Fig. 9
Acetate inhibits colonic tissue fibrosis in SHRs. A, representative micrographs from hematoxylin-eosin (HE) and Masson’s trichrome staining assays of the colonic tissues. Quantitative analysis of the thickness of the muscular layer (B), villi length (C) and goblet cells/villi (D) on HE-stained sections of the colon. n = 10 for each group. E, quantitative analysis of fibrotic area on Masson’s-stained sections of the colon. n = 6 for each group. F, the permeability of the colonic mucosa to the bloodstream was evaluated by measuring the plasma concentration of FITC-dextran (4 kDa). n = 4 for each group. * P < 0.05, ** P < 0.01

Similar articles

Cited by

References

    1. Brouwers S, Sudano I, Kokubo Y, Sulaica EM. Arterial hypertension. Lancet. 2021;398:249–61. doi: 10.1016/S0140-6736(21)00221-X. - DOI - PubMed
    1. Seravalle G, Grassi G. Sympathetic nervous system and hypertension: new evidences. Auton Neurosci. 2022;238:102954. doi: 10.1016/j.autneu.2022.102954. - DOI - PubMed
    1. Malpas SC. Sympathetic nervous system overactivity and its role in the development of cardiovascular disease. Physiol Rev. 2010;90:513–57. doi: 10.1152/physrev.00007.2009. - DOI - PubMed
    1. Guyenet PG, Stornetta RL. Rostral ventrolateral medulla, retropontine region and autonomic regulations. Auton Neurosci. 2022;237:102922. doi: 10.1016/j.autneu.2021.102922. - DOI - PubMed
    1. Moraes DJ, Machado BH, Paton JF. Specific respiratory neuron types have increased excitability that drive presympathetic neurones in neurogenic hypertension. Hypertension. 2014;63:1309–18. doi: 10.1161/HYPERTENSIONAHA.113.02283. - DOI - PubMed