. 2024 Apr 17;24(1):140.
doi: 10.1186/s12935-024-03327-z.

Spatial and single-cell explorations uncover prognostic significance and immunological functions of mitochondrial calcium uniporter in breast cancer

Affiliations

Spatial and single-cell explorations uncover prognostic significance and immunological functions of mitochondrial calcium uniporter in breast cancer

Chia-Jung Li et al. Cancer Cell Int. .

Abstract

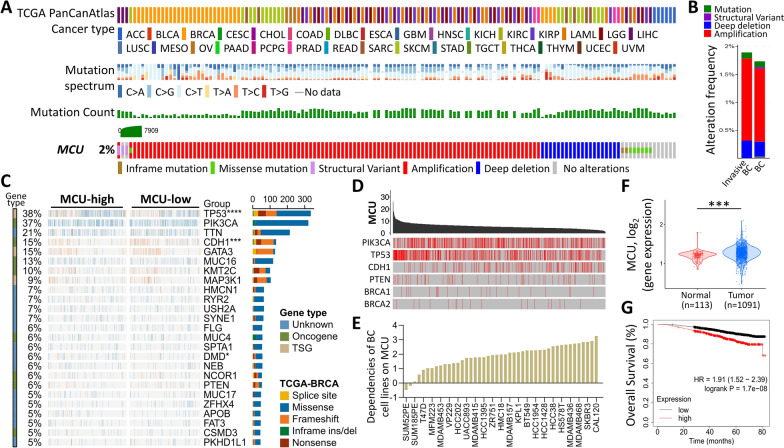
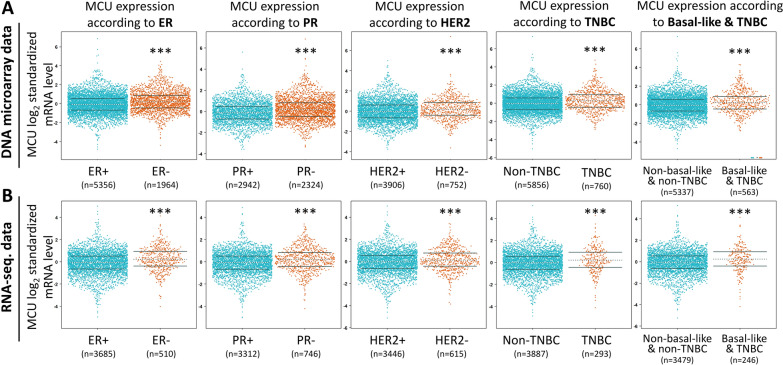
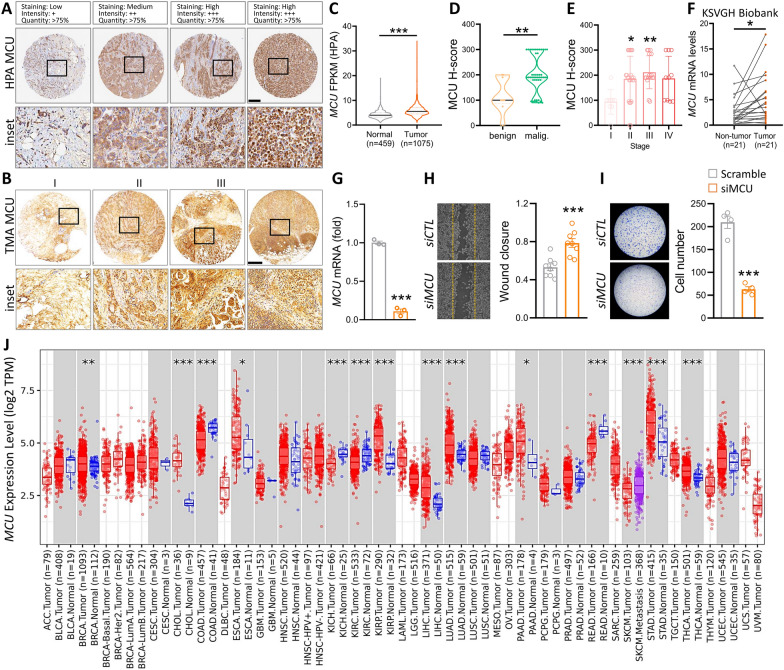
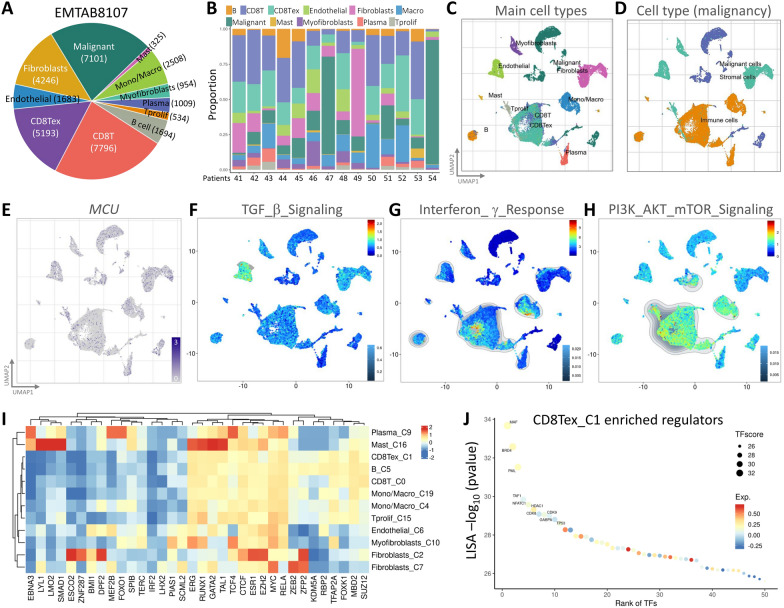
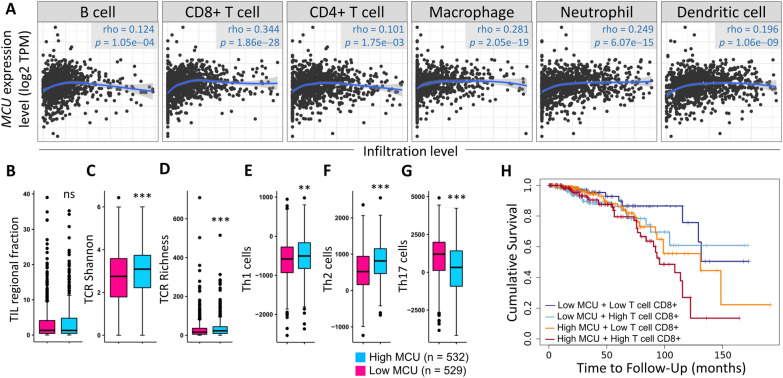
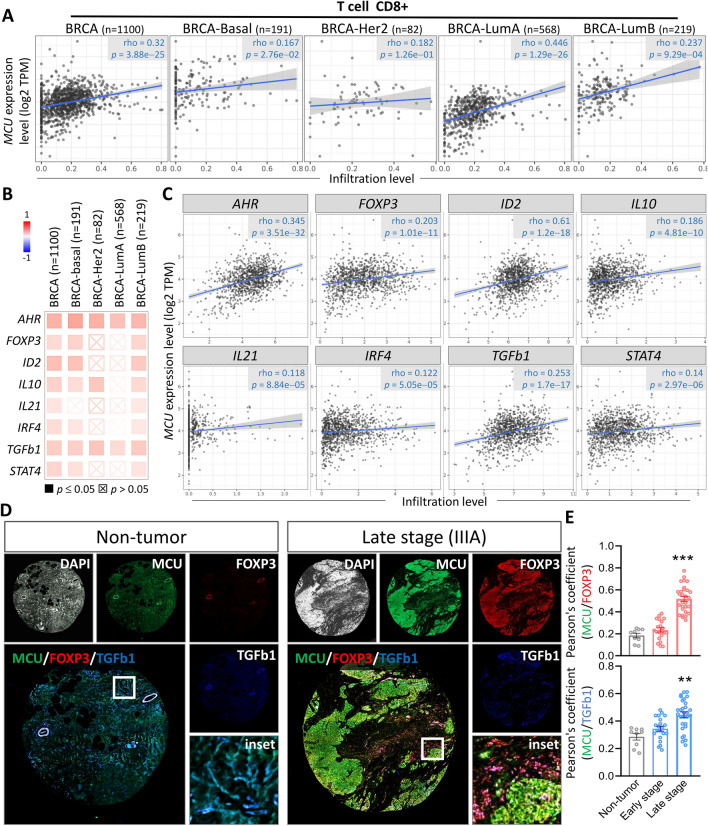
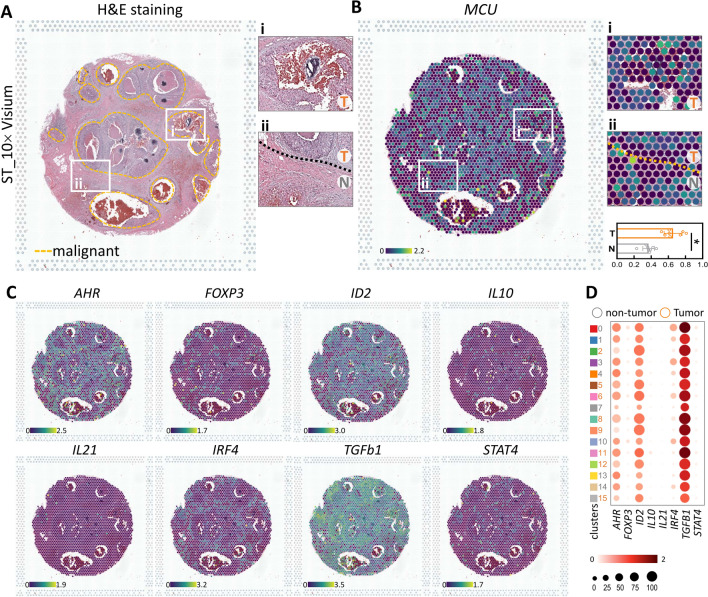
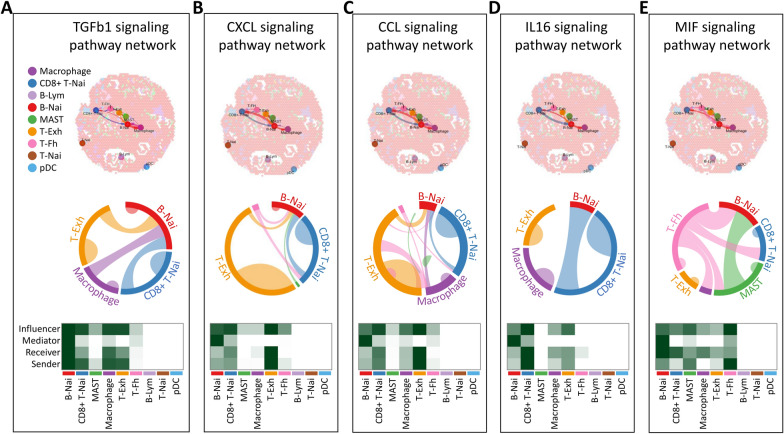
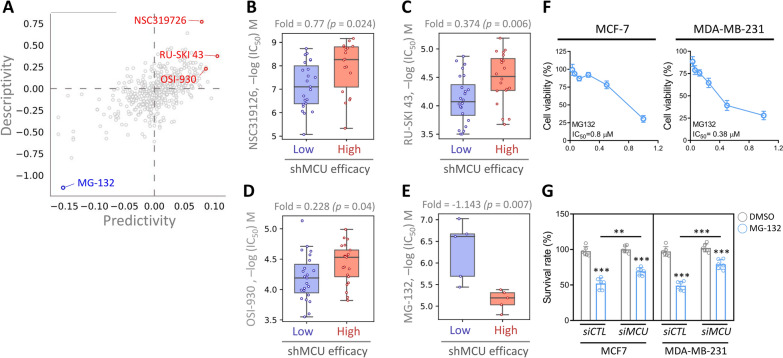
The mitochondrial calcium uniporter (MCU) is a transmembrane protein facilitating the entry of calcium ions into mitochondria from the cell cytosol. Maintaining calcium balance is crucial for enhancing cellular energy supply and regulating cell death. The interplay of calcium balance through MCU and the sodium-calcium exchanger is known, but its regulation in the breast cancer tumor microenvironment remains elusive. Further investigations are warranted to explore MCU's potential in BRCA clinical pathology, tumor immune microenvironment, and precision oncology. Our study, employing a multi-omics approach, identifies MCU as an independent diagnostic biomarker for breast cancer (BRCA), correlated with advanced clinical status and poor overall survival. Utilizing public datasets from GEO and TCGA, we discern differentially expressed genes in BRCA and examine their associations with immune gene expression, overall survival, tumor stage, gene mutation status, and infiltrating immune cells. Spatial transcriptomics is employed to investigate MCU gene expression in various regions of BRCA, while spatial transcriptomics and single-cell RNA-sequencing methods explore the correlation between MCUs and immune cells. Our findings are validated through the analysis of 59 BRCA patient samples, utilizing immunohistochemistry and bioinformatics to examine the relationship between MCU expression, clinicopathological features, and prognosis. The study uncovers the expression of key gene regulators in BRCA associated with genetic variations, deletions, and the tumor microenvironment. Mutations in these regulators positively correlate with different immune cells in six immune datasets, playing a pivotal role in immune cell infiltration in BRCA. Notably, high MCU performance is linked to CD8 + T cells infiltration in BRCA. Furthermore, pharmacogenomic analysis of BRCA cell lines indicates that MCU inactivation is associated with increased sensitivity to specific small molecule drugs. Our findings suggest that MCU alterations may be linked to BRCA progression, unveiling new diagnostic and prognostic implications for MCU in BRCA. The study underscores MCU's role in the tumor immune microenvironment and cell cycle progression, positioning it as a potential tool for BRCA precision medicine and drug screening.

Keywords: Breast cancer; Immune infiltration; MCU; Single-cell RNA-sequencing; Spatial transcriptomics.


Conflict of interest statement

The authors declare that they have no conflict of interest.

Figures

Fig. 1
Fig. 1
The illustrates the frequency and functional enrichment analysis of MCU alterations in breast cancer. A Examination of diverse mutations in the MCU gene across various cancer types. B Utilizing cBioPortal cancer genomics analysis to determine the frequency of MCU gene alterations in different cancer types. C Fisher's exact test compared mutation frequencies between MCU-high and MCU-low groups, with the right panel displaying mutation types, driving mutation types, and respective groups. D Investigation into the relationship between MCU and the six highly mutated genes in BRCA, with mutation sites highlighted by red lines. E Significance of MCU dependency in 45 BRCA cell lines based on the CRISPR screen. F Violin plots depicting MCU gene expression from RNA-sequencing data. G Kaplan–Meier survival analysis illustrating overall survival (OS) based on low/high expression of MCU. ***p < 0.001
Fig. 2
Fig. 2
Bee swarm representation of differential expression in breast cancer patients based on various classified parameters. AB Illustrate MCU mRNA expression levels in breast cancer patients using bee swarm plots in DNA microarray datasets and RNA-sequencing datasets. (ER estrogen receptor, PR progesterone receptor, HER2 human epidermal growth factor receptor 2, TNBC triple-negative breast cancer)
Fig. 3
Fig. 3
Examination of the pathological alterations of MCU in clinical breast cancer. A Immunohistochemical assessment of MCU protein expression levels in BRCA tissue samples from diverse patients based on the Human Protein Atlas. B Depicts representative images of MCU expression in breast cancer tissues at distinct staining stages. C MCU expression levels in breast cancer were evaluated in tumor and non-tumor tissues using data from the Human Protein Atlas. C MCU expression levels in breast cancer were depicted in benign and malignant violin plots. E Comparative analysis of MCU expression in BRCA, with box plots illustrating expression levels across different stages of the disease. F qPCR analysis of MCU in 21 paired BRCA and non-tumor tissues, denoted as N and T for non-tumor and tumor tissues, respectively. G Quantitative PCR demonstrates a significant decrease in MCU expression in breast cancer cells transfected with siMCU. H Assessment of wound healing in the MDA-MB-231 cell line through a wound healing assay. I Evaluation of breast cancer cell invasion using the MDA-MB-231 cell line in a Transwell assay. (J) MCU expression levels in different cancer types, with comparisons between tumor and normal tissues, highlighting statistical significance using asterisks. *p < 0.05, **p < 0.01, ***p < 0.001. Scale bar = 500 µm
Fig. 4
Fig. 4
Utilizing single-cell RNA sequencing analysis for the identification of immune cell populations. AB Illustrate the relative proportions of each cell type in the public dataset and the integrated immune cell proportions in the EMTAB8107 dataset. CD Employ the unified flow approximation and projection (UMAP) technique to visually represent BRCA cells, color-coded based on main cell types and malignancy. E Visualizes the expression clusters of MCU through UMAP plots, subsequently subjected to gene set enrichment analysis (GSEA) for F TGFβ, G interferon γ, and H PI3K/AKT/mTOR signaling. I The heatmap depicts the expression of the MCU gene and cell type biomarkers in different single-cell type clusters of tissues. J Highlights CD8Tex cells as key regulators of transcription factors in this cell cluster
Fig. 5
Fig. 5
Correlation of MCU expression with immune infiltration level in BRCA. A The correlation between MCU expression level and immune infiltration. BG Displays changes in transcript levels among different MCU levels and immune cells. H Kaplan–Meier plots illustrating the survival differences of macrophages based on different MCU expression levels.*P < 0.05, **P < 0.01, ***P < 0.001
Fig. 6
Fig. 6
Investigating the association between MCU and immune infiltration in BRCA. A Assessing the relationship between MCU levels and T cell CD8 + . BC Investigating the correlation between MCU and genes related to T cell CD8 + . D Investigating the association between MCU and T cell biomarkers in breast cancer biopsies. Utilizing comprehensive immunofluorescent labeling on tissue microarrays (TMA) with DAPI, MCU, FOXP3, and TGFb1, followed by panoramic tissue scanning. Pearson's correlation coefficient was employed to depict the degree of co-localization between MCU and FOXP3 E as well as TGFb1 F fluorescent signals. **P < 0.01, ***P < 0.001
Fig. 7
Fig. 7
Gene expression in BRCA defined by spatial transcriptomics. A Utilizing spatial transcriptomics, tissue sections were analyzed to identify clusters, accurately aligning them with morphological features observed in hematoxylin and eosin staining and cluster mapping. Malignant areas are outlined by yellow dotted lines, and magnified images of gene variants in boxes i and ii are presented. BC Spatial distribution and genetic changes involving MCU, AHR, FOXP3, ID2, IL10, IL21, IRF4, TGFb1, and STAT4 in different tissue sections were visualized using 10 × Visium Spatial Gene Expression. Bars indicate tumor versus non-tumor transcript levels. D Dot plots illustrate gene expression levels across various clusters. *P < 0.05
Fig. 8
Fig. 8
Signaling pathway network associated with T cell CD8 + in the spatial transcriptome of BRCA. AE Showcase interactions of the TGFβ, CXCL, CCL, IL16, and MIF signaling pathways with different ovarian cell types. Cell–cell communication is depicted, illustrating interactions between cells, where line thickness reflects the strength of these connections. Chord diagrams for six signaling pathways reveal intricate interactions between cell populations. Heatmaps display network centrality scores for the signaling pathways
Fig. 9
Fig. 9
Evaluation of drug sensitivity and cytotoxicity in breast cancer cells. A The scatter plot depicts cross-association scores of predictivity and descriptivity, employed to identify potent drugs with efficacy against BRCA cells. To unveil gene signatures and potential drugs, we queried the pharmacogenetics database for the MCU gene. Subsequently, we examined the drug sensitivity of the shMCU gene to various chemical drugs in BRCA cell lines. The boxplots BE illustrate the logarithm of the half maximal inhibitory concentration (IC50) values for four drugs, namely NSC319126, RU-SKI 43, OSI-930, and MG-132, displaying altered potency. F Evaluation of drug responsiveness across various breast cancer cell lines. G Analysis of drug sensitivity following inactivation of the MCU gene. **P < 0.01, ***P < 0.001

Similar articles

Cited by

References

    1. Li CJ, Tzeng YT, Chiu YH, Lin HY, Hou MF, Chu PY. Pathogenesis and potential therapeutic targets for triple-negative breast cancer. Cancers. 2021 doi: 10.3390/cancers13122978. - DOI - PMC - PubMed
    1. Suppan C, Balic M. Current standards and future outlooks in metastatic her2-positive breast cancer. Breast Care. 2023;18(1):69–75. doi: 10.1159/000528756. - DOI - PMC - PubMed
    1. Tsui KH, Wu MY, Lin LT, Wen ZH, Li YH, Chu PY, Li CJ. Disruption of mitochondrial homeostasis with artemisinin unravels anti-angiogenesis effects via auto-paracrine mechanisms. Theranostics. 2019;9(22):6631–6645. doi: 10.7150/thno.33353. - DOI - PMC - PubMed
    1. Li CJ, Chu PY, Yiang GT, Wu MY: The Molecular Mechanism of Epithelial-Mesenchymal Transition for Breast Carcinogenesis. Biomolecules 2019, 9(9). - PMC - PubMed
    1. Tzeng YT, Tsui KH, Tseng LM, Hou MF, Chu PY, Sheu JJ, Li CJ. Integrated analysis of pivotal biomarker of LSM1, immune cell infiltration and therapeutic drugs in breast cancer. J Cell Mol Med. 2022;26(14):4007–4020. doi: 10.1111/jcmm.17436. - DOI - PMC - PubMed