. 2024 Apr 26;87(4):1187-1196.
doi: 10.1021/acs.jnatprod.4c00153. Epub 2024 Apr 17.

Psammaplin A and Its Analogs Attenuate Oxidative Stress in Neuronal Cells through Peroxisome Proliferator-Activated Receptor γ Activation

Affiliations

Psammaplin A and Its Analogs Attenuate Oxidative Stress in Neuronal Cells through Peroxisome Proliferator-Activated Receptor γ Activation

Rebeca Alvariño et al. J Nat Prod. .

Abstract

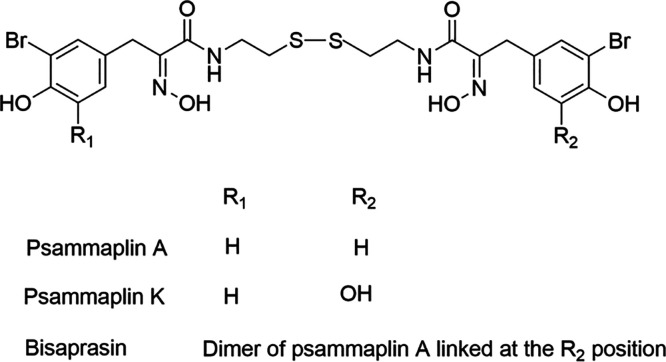
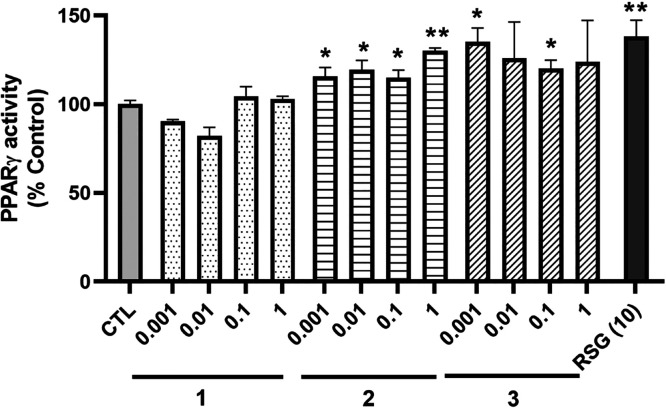
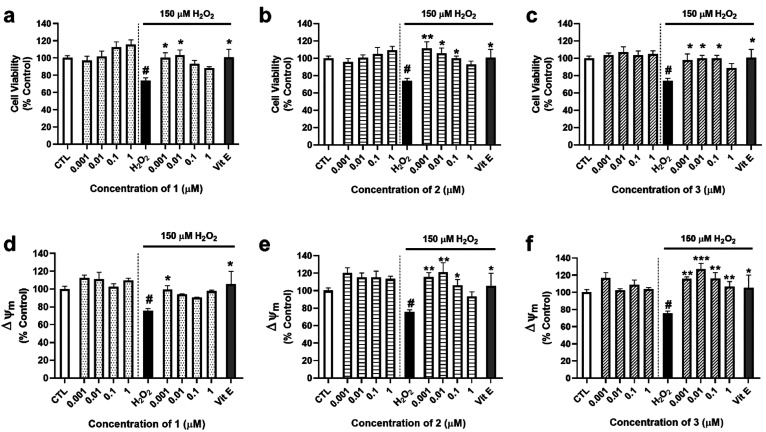
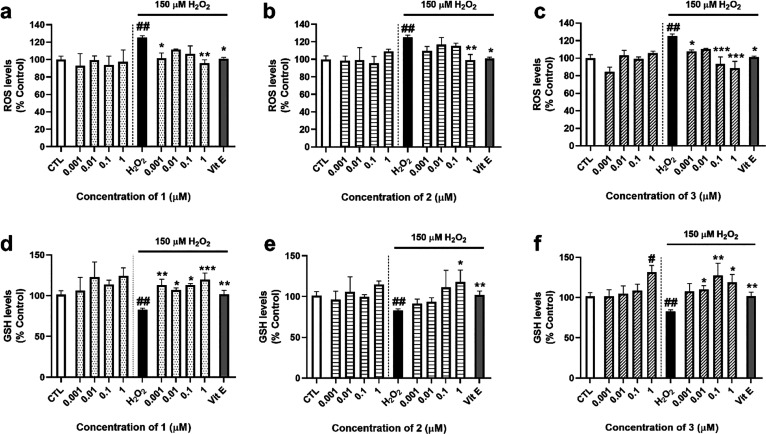
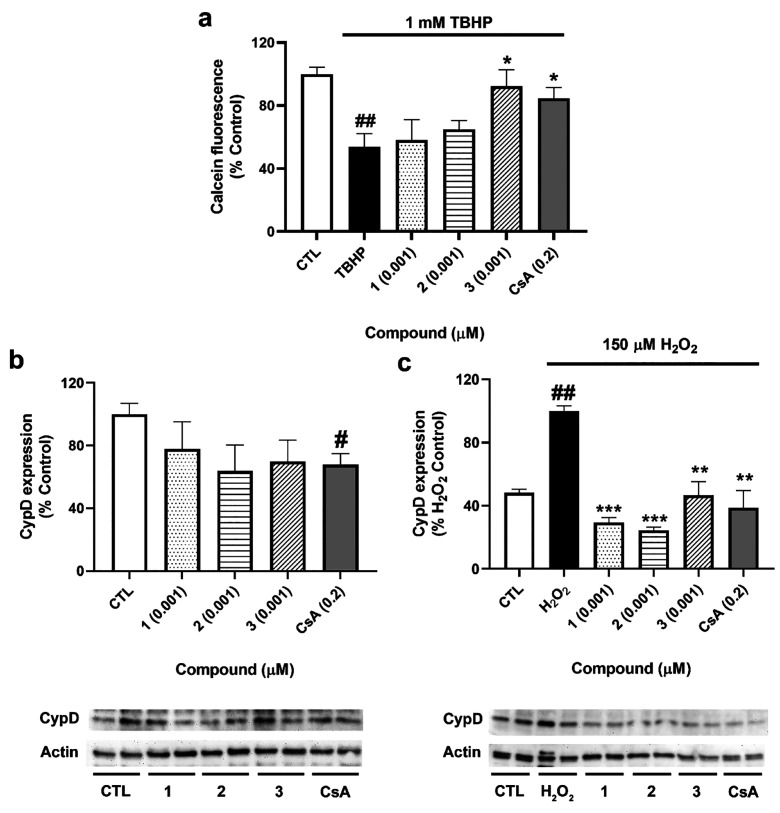
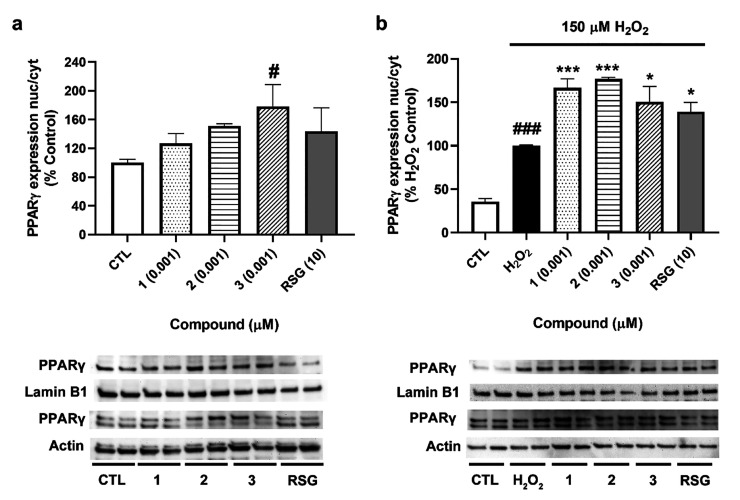
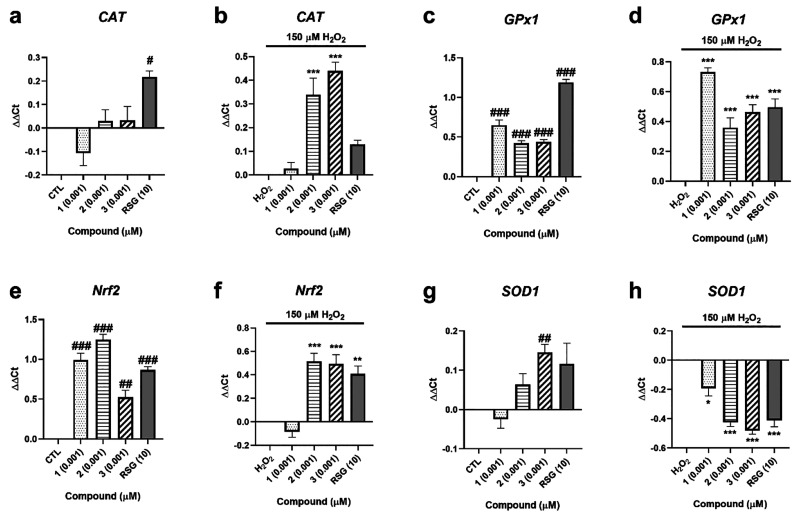
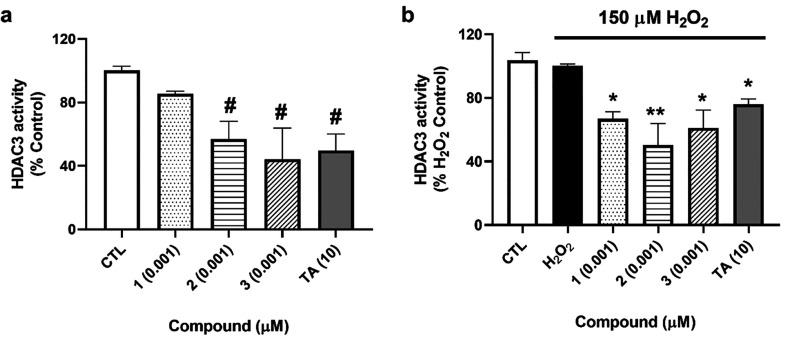
Psammaplins are sulfur containing bromotyrosine alkaloids that have shown antitumor activity through the inhibition of class I histone deacetylases (HDACs). The cytotoxic properties of psammaplin A (1), the parent compound, are related to peroxisome proliferator-activated receptor γ (PPARγ) activation, but the mechanism of action of its analogs psammaplin K (2) and bisaprasin (3) has not been elucidated. In this study, the protective effects against oxidative stress of compounds 1-3, isolated from the sponge Aplysinella rhax, were evaluated in SH-SY5Y cells. The compounds improved cell survival, recovered glutathione (GSH) content, and reduced reactive oxygen species (ROS) release at nanomolar concentrations. Psammaplins restored mitochondrial membrane potential by blocking mitochondrial permeability transition pore opening and reducing cyclophilin D expression. This effect was mediated by the capacity of 1-3 to activate PPARγ, enhancing gene expression of the antioxidant enzymes catalase, nuclear factor E2-related factor 2 (Nrf2), and glutathione peroxidase. Finally, HDAC3 activity was reduced by 1-3 under oxidative stress conditions. This work is the first description of the neuroprotective activity of 1 at low concentrations and the mechanism of action of 2 and 3. Moreover, it links for the first time the previously described effects of 1 in HDAC3 and PPARγ signaling, opening a new research field for the therapeutic potential of this compound family.


Conflict of interest statement

The authors declare no competing financial interest.

Figures

Figure 1
Figure 1
Chemical structures of compounds 1 (psammaplin A), 2 (psammaplin K), and 3 (bisaprasin).
Figure 2
Figure 2
Activity of PPARγ in the nucleus after treatment with A. rhax metabolites. SH-SY5Y cells were treated with compounds at nontoxic concentrations for 6 h and lysed, and the activity of PPARγ was evaluated with a commercial kit. Rosiglitazone (RSG) at 10 μM was used as the positive control. Data are mean ± SEM of three independent replicates performed by triplicate. Results are expressed as percentage of control cells and compared by a one-way ANOVA test followed by Dunnett’s post hoc test (*p < 0.05, **p < 0.01 compared to control cells).
Figure 3
Figure 3
Effects of 13 on cell viability and mitochondrial membrane potential. Human neuroblastoma cells were treated with compounds with and without 150 μM H2O2 for 6 h. Their effects on cell viability were assessed with the MTT assay, while ΔΨm was determined by TMRM dye. Cell viability after treatment with (a) 1, (b) 2, and (c) 3. Effects of (d) 1, (e) 2, and (f) 3 on ΔΨm. Vitamin E (Vit E) at 25 μM was used as a positive control. Mean ± SEM of three independent replicates was performed by triplicate. Data are expressed as percentage of untreated control cells. Statistical differences were determined by one-way ANOVA and Dunnett’s tests (#p < 0.05 compared to control cells; *p < 0.05, **p < 0.01, and ***p < 0.001 compared to H2O2 control cells).
Figure 4
Figure 4
ROS and GSH levels after treatment with compounds. Arhax metabolites and 150 μM H2O2 were added to the SH-SY5Y cells for 6 h. Then, ROS and GSH levels were determined with the fluorescent probes carboxy-H2DCFDA and Thiol Tracker Violet, respectively. Effects of (a) 1, (b) 2, and (c) 3 on intracellular ROS levels. GSH content after addition of (d) 1, (e) 2, and (f) 3. Vitamin E (Vit E) at 25 μM was used as a positive control. Data presented as mean ± SEM of three replicates carried out in triplicate and expressed as percentage of untreated control cells. Statistical significance was assessed by one-way ANOVA followed by Dunnett’s post hoc test (##p < 0.01 compared to control cells; *p < 0.05, **p < 0.01, and ***p < 0.001 compared to H2O2 control cells).
Figure 5
Figure 5
Evaluation of mPTP after treatment with 13. (a) Determination of the mPTP opening. SH-SY5Y cells were loaded with calcein-AM and CoCl2 and treated with compounds and 1 mM TBHP, and fluorescence was measured by flow cytometry. Cyclosporine A (CsA) (0.2 μM) was used as a positive control. Data are mean ± SEM of three independent experiments and presented as percentage of control cells. Statistical differences determined by one-way ANOVA and Dunnett’s tests (##p < 0.01 compared to control cells; *p < 0.05 compared to cells treated only with TBHP). (b) Effect of compounds on CypD expression. (c) Expression of CypD after the addition of A. rhax metabolites and 150 μM H2O2. Cells were treated for 6 h, and the expression of CypD was analyzed by Western blot. Cyclosporine A (CsA) at 0.2 μM was used as a positive control. Protein band expression was normalized by actin levels. Mean ± SEM of three replicates carried out by duplicate and expressed as percentage of untreated control cells and H2O2 control, respectively. Statistical significance was analyzed by one-way ANOVA and Dunnett’s tests (##p < 0.01 compared to control cells; **p < 0.01 and ***p < 0.001 compared to cells treated with H2O2 alone).
Figure 6
Figure 6
Effects of compounds on PPARγ translocation. Cells were treated with 13 for 6 h, and the expression of the transcription factor was assessed by Western blot. (a) Expression of PPARγ after treatment with compounds. (b) Effects of A. rhax metabolites in PPARγ translocation under oxidative stress conditions. Translocation of PPARγ was determined as the ratio between nuclear and cytosolic levels. Protein band expression was normalized by lamin B1 and actin levels in the nuclear and cytosolic fractions, respectively. Values are mean ± SEM of three replicates carried out by duplicate and presented as percentage of control cells or H2O2 control. Statistical differences were determined by one-way ANOVA and Dunnett’s tests (#p < 0.05, ###p < 0.001 compared to control cells; *p < 0.05, ***p < 0.001 compared to cells treated with H2O2 alone).
Figure 7
Figure 7
Gene expression of antioxidant enzymes after treatment with A. rhax metabolites. Relative gene expression of CAT after 6 h of treatment with compounds without (a) and with (b) 150 μM H2O2, GPx1 when SH-SY5Y cells were treated with 13 for 6 h (c) and injured with 150 μM H2O2 (d), Nrf2 after addition of compounds (e) and cotreatment with compounds and H2O2 (f), and SOD1 when metabolites were added to cells under physiological (g) and oxidative stress (h) conditions. Rosiglitazone (RSG) at 10 μM was used as a positive control. Relative gene expression was calculated with the ΔΔCt method. Control cells and H2O2 control were used as calibrator, and RPL0 was the internal normalization control. Data are expressed as the mean ± SEM of three independent replicates performed by triplicate. Statistical significance evaluated by one way ANOVA and Dunnett’s tests (#p < 0.05, ##p < 0.01, ###p < 0.01, compared to control cells; *p < 0.05, **p < 0.01, ***p < 0.001, compared to cells treated with H2O2 alone).
Figure 8
Figure 8
Effects of 13 on HDAC3 activity. SH-SY5Y cells were treated with the compounds and 150 μM H2O2 for 6 h and lysed, and the activity of HDAC3 was determined in nuclear fractions with a commercial kit. (a) Activity of HDAC3 after treatment with compounds alone. (b) Nuclear activity of HDAC3 after cotreatment with A. rhax metabolites and H2O2. Trichostatin A (TA) at 10 μM was used as a positive control. Mean ± SEM of three replicates carried out by duplicate. Values expressed as percentage of control and H2O2 control cells, respectively. One-way ANOVA and Dunnett’s tests were used for analyzing statistical differences (#p < 0.05, compared to control cells; *p < 0.05, **p < 0.01, compared to cells treated with H2O2 alone).

Similar articles

Cited by

References

    1. Jing Q.; Hu X.; Ma Y.; Mu J.; Liu W.; Xu F.; Li Z.; Bai J.; Hua H.; Li D. Marine-Derived Natural Lead Compound Disulfide-Linked Dimer Psammaplin A: Biological Activity and Structural Modification. Mar Drugs 2019, 17 (7), 384.10.3390/md17070384. - DOI - PMC - PubMed
    1. Bao Y.; Xu Q.; Wang L.; Wei Y.; Hu B.; Wang J.; Liu D.; Zhao L.; Jing Y. Studying Histone Deacetylase Inhibition and Apoptosis Induction of Psammaplin A Monomers with Modified Thiol Group. ACS Med. Chem. Lett. 2021, 12 (1), 39–47. 10.1021/acsmedchemlett.0c00369. - DOI - PMC - PubMed
    1. Oluwabusola E. T.; Katermeran N. P.; Poh W. H.; Goh T. M. B.; Tan L. T.; Diyaolu O.; Tabudravu J.; Ebel R.; Rice S. A.; Jaspars M. Inhibition of the Quorum Sensing System, Elastase Production and Biofilm Formation in Pseudomonas aeruginosa by Psammaplin A and Bisaprasin. Molecules 2022, 27 (5), 1721.10.3390/molecules27051721. - DOI - PMC - PubMed
    1. Oluwabusola E. T.; Tabudravu J. N.; Al Maqbali K. S.; Annang F.; Perez-Moreno G.; Reyes F.; Jaspars M. Antiparasitic Activity of Bromotyrosine Alkaloids and New Analogues Isolated from the Fijian Marine Sponge Aplysinella rhax. Chem. Biodivers 2020, 17 (10), e200033510.1002/cbdv.202000335. - DOI - PubMed
    1. Kim T. H.; Kim H. S.; Kang Y. J.; Yoon S.; Lee J.; Choi W. S.; Jung J. H.; Kim H. S. Psammaplin A induces Sirtuin 1-dependent autophagic cell death in doxorubicin-resistant MCF-7/adr human breast cancer cells and xenografts. Biochim. Biophys. Acta 2015, 1850 (2), 401–10. 10.1016/j.bbagen.2014.11.007. - DOI - PubMed

Publication types

MeSH terms