

A Scaffold-Assisted 3D Cancer Cell Model for Surface-Enhanced Raman Scattering-Based Real-Time Sensing and Imaging
- PMID: 38632933
- PMCID: PMC11064228
- DOI: 10.1021/acsnano.4c00543
A Scaffold-Assisted 3D Cancer Cell Model for Surface-Enhanced Raman Scattering-Based Real-Time Sensing and Imaging
Abstract
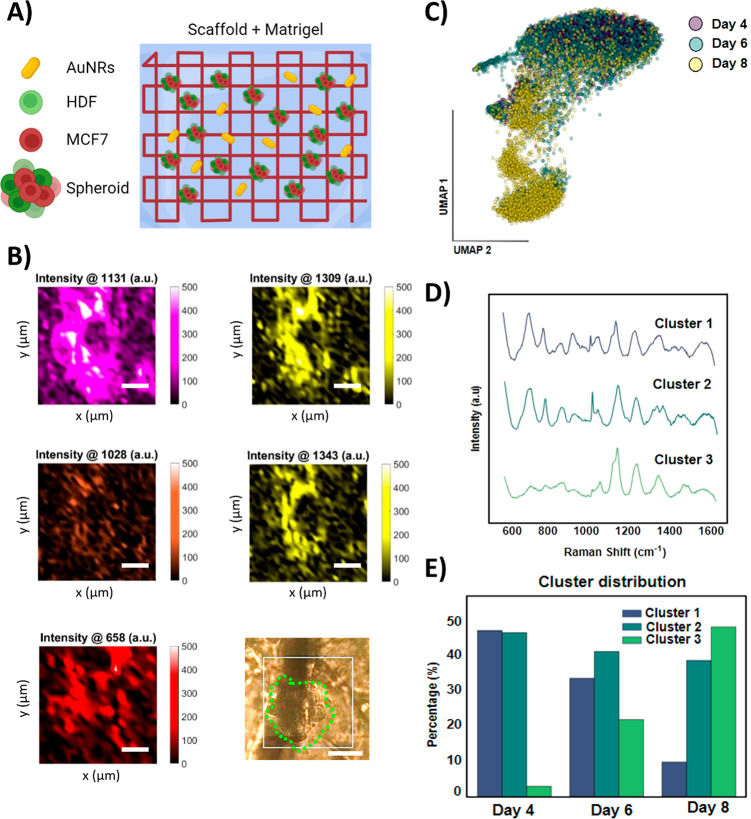
Despite recent advances in the development of scaffold-based three-dimensional (3D) cell models, challenges persist in imaging and monitoring cell behavior within these complex structures due to their heterogeneous cell distribution and geometries. Incorporating sensors into 3D scaffolds provides a potential solution for real-time, in situ sensing and imaging of biological processes such as cell growth and disease development. We introduce a 3D printed hydrogel-based scaffold capable of supporting both surface-enhanced Raman scattering (SERS) biosensing and imaging of 3D breast cancer cell models. The scaffold incorporates plasmonic nanoparticles and SERS tags, for sensing and imaging, respectively. We demonstrate the scaffold's adaptability and modularity in supporting breast cancer spheroids, thereby enabling spatial and temporal monitoring of tumor evolution.
Keywords: 3D cell models; 3D printing; SERS; bioimaging; biosensing; tumor microenvironment.
Conflict of interest statement
The authors declare no competing financial interest.
Figures
Similar articles
-
Gold-Hydrogel Nanocomposites for High-Resolution Laser-Based 3D Printing of Scaffolds with SERS-Sensing Properties.ACS Appl Bio Mater. 2024 Jul 15;7(7):4497-4509. doi: 10.1021/acsabm.4c00379. Epub 2024 Jun 26. ACS Appl Bio Mater. 2024. PMID: 38925631 Free PMC article.
-
Rapid and sensitive phenotypic marker detection on breast cancer cells using surface-enhanced Raman scattering (SERS) imaging.Biosens Bioelectron. 2014 Jan 15;51:238-43. doi: 10.1016/j.bios.2013.07.063. Epub 2013 Aug 6. Biosens Bioelectron. 2014. PMID: 23973735
-
Tailoring strategies of SERS tags-based sensors for cellular molecules detection and imaging.Talanta. 2024 Aug 15;276:126283. doi: 10.1016/j.talanta.2024.126283. Epub 2024 May 21. Talanta. 2024. PMID: 38776777 Review.
-
Development of a 3D Hydrogel SERS Chip for Noninvasive, Real-Time pH and Glucose Monitoring in Sweat.ACS Appl Mater Interfaces. 2024 Sep 11;16(36):48139-48146. doi: 10.1021/acsami.4c10817. Epub 2024 Aug 28. ACS Appl Mater Interfaces. 2024. PMID: 39197856
-
Current strategies of plasmonic nanoparticles assisted surface-enhanced Raman scattering toward biosensor studies.Biosens Bioelectron. 2023 May 15;228:115231. doi: 10.1016/j.bios.2023.115231. Epub 2023 Mar 15. Biosens Bioelectron. 2023. PMID: 36934607 Review.
Cited by
-
Perturbation of mammary epithelial cell apicobasal polarity by RHBDF1-facilitated nuclear translocation of PKCζ.Biol Res. 2024 Nov 24;57(1):90. doi: 10.1186/s40659-024-00566-2. Biol Res. 2024. PMID: 39582014 Free PMC article.
-
Development and Application of Surface-Enhanced Raman Scattering (SERS).Nanomaterials (Basel). 2024 Aug 29;14(17):1417. doi: 10.3390/nano14171417. Nanomaterials (Basel). 2024. PMID: 39269079 Free PMC article. Review.
-
Additive-Free Synthesis of (Chiral) Gold Bipyramids from Pentatwinned Nanorods.ACS Mater Lett. 2024 Oct 17;6(11):5163-5169. doi: 10.1021/acsmaterialslett.4c01605. eCollection 2024 Nov 4. ACS Mater Lett. 2024. PMID: 39512725 Free PMC article.
-
Plasmonic-Hydrogel Hybrid Biomaterials Via In Situ Seeded Growth.Angew Chem Int Ed Engl. 2025 Jun 17;64(25):e202501854. doi: 10.1002/anie.202501854. Epub 2025 Apr 22. Angew Chem Int Ed Engl. 2025. PMID: 40211965 Free PMC article.
-
High-Yield In Situ Growth of Supported Gold Nanorods in Microfluidic Channels.ACS Nano. 2025 Aug 19;19(32):29691-29701. doi: 10.1021/acsnano.5c09672. Epub 2025 Aug 8. ACS Nano. 2025. PMID: 40780304 Free PMC article.
References
Publication types
MeSH terms
Substances
LinkOut - more resources
Full Text Sources
Research Materials
Miscellaneous
