. 2024 Mar 27;27(4):109593.
doi: 10.1016/j.isci.2024.109593. eCollection 2024 Apr 19.

Type I interferon regulation by USP18 is a key vulnerability in cancer

Affiliations

Type I interferon regulation by USP18 is a key vulnerability in cancer

Veronica Jové et al. iScience. .

Abstract

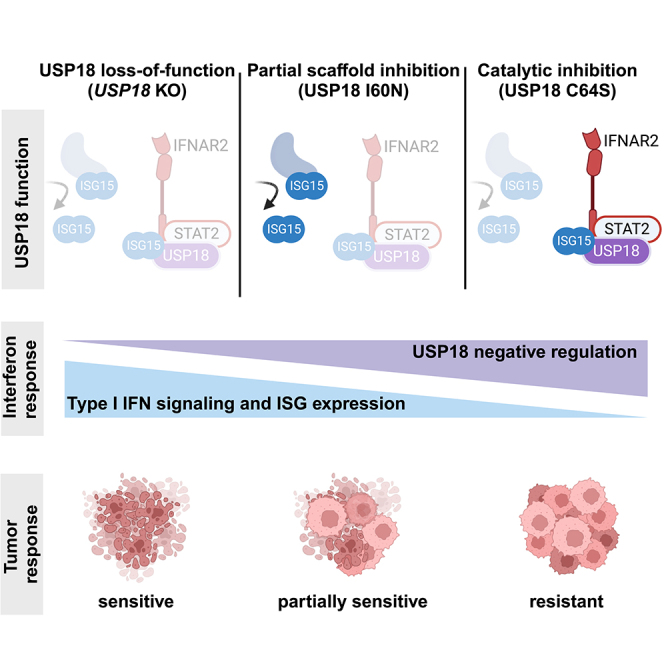
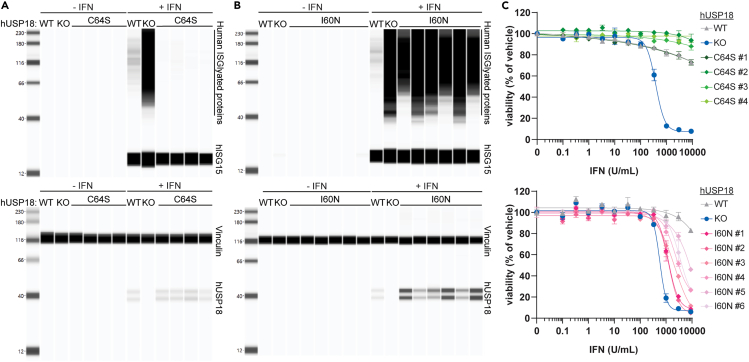
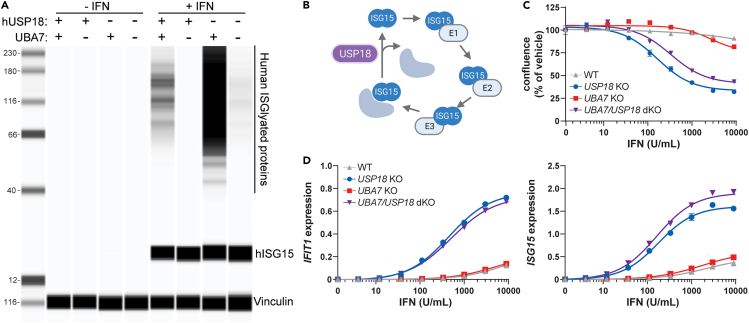
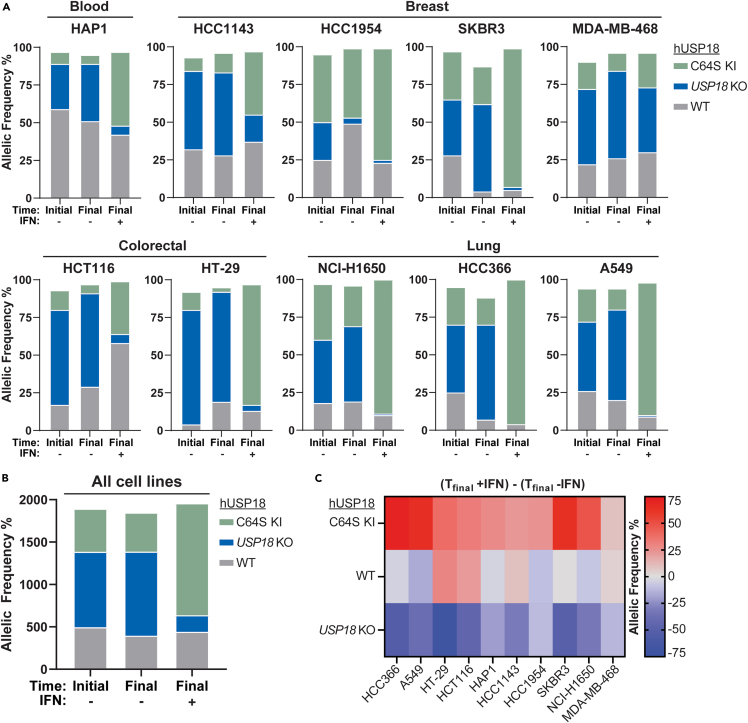
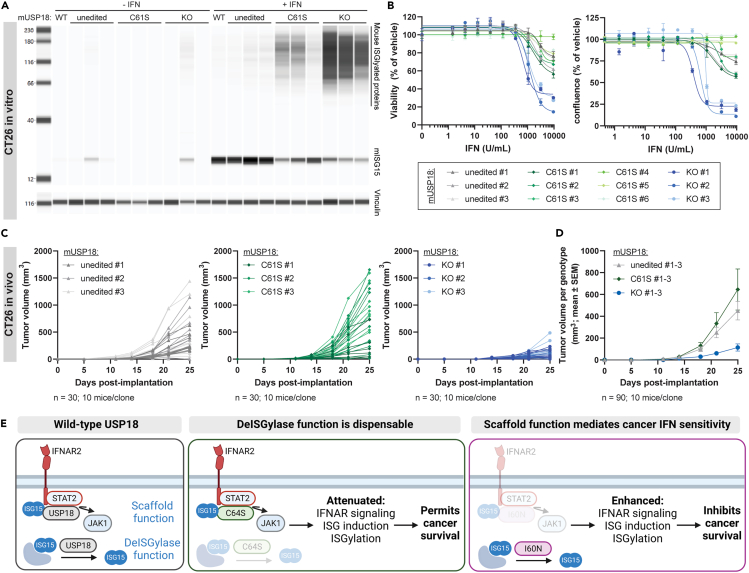
Precise regulation of Type I interferon signaling is crucial for combating infection and cancer while avoiding autoimmunity. Type I interferon signaling is negatively regulated by USP18. USP18 cleaves ISG15, an interferon-induced ubiquitin-like modification, via its canonical catalytic function, and inhibits Type I interferon receptor activity through its scaffold role. USP18 loss-of-function dramatically impacts immune regulation, pathogen susceptibility, and tumor growth. However, prior studies have reached conflicting conclusions regarding the relative importance of catalytic versus scaffold function. Here, we develop biochemical and cellular methods to systematically define the physiological role of USP18. By comparing a patient-derived mutation impairing scaffold function (I60N) to a mutation disrupting catalytic activity (C64S), we demonstrate that scaffold function is critical for cancer cell vulnerability to Type I interferon. Surprisingly, we discovered that human USP18 exhibits minimal catalytic activity, in stark contrast to mouse USP18. These findings resolve human USP18's mechanism-of-action and enable USP18-targeted therapeutics.

Keywords: Cancer; Cell biology; Immune response; Immunity.


Conflict of interest statement

VJ, HW, CWL, DRH, KL, ECR, MY, ZKJ, EC, YX, JS, BY, AG, PL, ACG, VF, PDW, and FW are current or former employees of Pfizer and may own Pfizer stock. BMK and APF receive research funding from Pfizer. This work was supported by Pfizer, and APF and BMK are funded by the Chinese Academy of Medical Sciences (CAMS) Innovation Fund for Medical Science (CIFMS), China (grant nr - 2018-I2M-2-002).

Figures

None
Graphical abstract
Figure 1
Figure 1
mUSP18 loss in CT26 tumors inhibits tumor growth in vivo (A and B) In vitro characterization of mUsp18−/− and Rosa26−/− cancer cells prior to implantation. (A) Relative mRNA expression of Ifit1 (left) and Isg15 (right) to Gapdh measured by RT-qPCR after 72 h treatment with the indicated concentration of murine IFN-β. Each data point denotes the mean of n = 3 replicates ± SEM. (B) Confluence was normalized to 0 U/mL IFN control from each cell line. (C–E) Tumor growth curves of (C,E) control Rosa26−/− and (D and E) mUsp18−/− CT26 tumors injected into wild-type BALB/c mice. Data are represented as (C and D) individual animals and (E) mean, n = 12 animals per genotype. (B) EC50 determinations for each cell line are presented in Table S1. (E) Results from nonlinear regression analysis are presented in Table S1 (slopes significantly different for each dataset, p < 0.0001). See also Figures S1 and S2.
Figure 2
Figure 2
hUSP18 loss confers IFN sensitivity across diverse cancer lineages Parental human cancer cell lines were electroporated with sgRNA targeted to hUSP18 and allelic frequency was determined by sequencing samples 72 h post-electroporation (time initial) and after 2 additional weeks of passaging cells (time final) in the presence (+) or absence (−) of human 1000 U/mL IFN-α. After 2 weeks of passaging cells, the relative ratio of KO to WT alleles at time final +IFN vs. time final -IFN indicates whether hUSP18 KO results in IFN sensitivity. (A) Schematic of experimental design (created with BioRender.com). (B and C) Growth rate of HCT116 wild-type (WT) and hUSP18 KO HCT116 cancer cells ±1000 U/mL human IFN-α added at time = 0 h. Each data point denotes n = 3 replicates; mean ± SEM. (D) KO indicates frameshift mutation or in-frame mutation ≥21 bp; WT indicates no mutation or in-frame mutation <21 bp. Two independent biological replicates (top and bottom rows) were electroporated, passaged, and sequenced in parallel.
Figure 3
Figure 3
C64S and I60N, respectively, disrupt hUSP18 catalytic and scaffold functions (A and B) Biotinylated hUSP18 was immobilized to a streptavidin biosensor and incubated with the indicated concentration of recombinant hISG15. Protein association and dissociation were sequentially monitored for 10 min each. (B) KD = 40 nM was determined by fitting the instrumental response after association (measured in nm wavelength shift) to a standard single-site binding equation as a function of hISG15 concentration. (C) KM(apparent) and VMAX(apparent)/[Enzyme concentration] determinations for hUSP18 (WT, I60N, or C64S) vs. hISG15-Rho110. The reported values are averaged from 2 determinations at different enzyme concentrations and rounded to 2 significant digits. N.D., not determined; signal below the level of detection. (D) Progression curve of 1000 nM hISG15-Rho110 cleavage by 10 nM hUSP18 (WT or C64S) or no enzyme control (buffer) at RT. (E) Cleavage of 5 μM pro-hISG15 (AA1-165) to mature hISG15 (AA1-157) was assessed by SDS-PAGE after 10 min incubation at 37°C with 1 μM of recombinant hUSP18 (WT, C64S, C64S/C64S, or I60N) or no enzyme control (−). (F) HAP1 hUSP18 KO cells were treated for 24 h with IFN-α prior to cell lysis and lysates were incubated with 1, 10, 100, or 1000 nM of indicated recombinant protein for 1 h at RT. Lysates were analyzed by western blot for levels of ISGylated proteins and hISG15 (top) or vinculin (bottom). (G and H) Ratio of phosphorylated STAT1 (pSTAT1) to total STAT1 levels measured by HTRF in individual HAP1 hUSP18 KO and (A) hUSP18 C64S KI or (B) hUSP18 I60N KI clones compared to parental HAP1 cells (WT). Cells were treated with 1000 U/mL human IFN-α for 4 h (IFN prime), followed by 24 h rest, and subsequent 15 min IFN-α re-stimulation (IFN pulse) at the indicated concentration prior to cell lysis (mean ± SEM, n = 3 replicates). (G) Unedited control clone underwent the same electroporation conditions as C64S KI clones, but no editing was observed at the endogenous hUSP18 locus. Results from the two-way ANOVA test with Tukey’s multiple comparisons are presented in Table S1. See also Figure S3.
Figure 4
Figure 4
Disrupting deISGylation is not sufficient to confer IFN sensitivity (A–C) Individual HAP1 hUSP18 KO (KO) and (A and C) hUSP18 C64S KI or (B and C) hUSP18 I60N KI clones were compared to parental HAP1 cells (WT). (A and B) Whole-cell lysates were analyzed by western blot for levels of ISGylated proteins and hISG15 (top) or vinculin and hUSP18 (bottom). Cells were treated with 1000 U/mL human IFN-β for 24 h prior to cell lysis. (C) Viability of hUSP18 C64S KI (top) or I60N KI (bottom) cells was measured after 72 h treatment with the indicated concentration of human IFN-α. Viability was normalized to 0 U/mL IFN control for each cell line. Each data point denotes mean of n = 2 replicates ± SEM. EC50 determinations for each cell line are presented in Table S1. See also Figure S1.
Figure 5
Figure 5
Disrupting the ISGylation pathway does not rescue IFN sensitivity UBA7 KO pools and UBA7/USP18 double KO (dKO) pools were compared to USP18 KO clone and parental HAP1 cells (WT). (A) Whole-cell lysates were analyzed by western blot for levels of ISGylated proteins and ISG15 (top) or vinculin (bottom). Cells were treated with 1000 U/mL human IFN-β for 24 h prior to cell lysis. (B) Schematic of the enzymatic cascade required for ISGylation (UBA7, UBCH8/UBE2L6, and HERC5) and deISGylation (USP18), created with BioRender.com. (C) Cell confluence and (D) relative mRNA expression of IFIT1 (left) or ISG15 (right) to GAPDH measured by RT-qPCR after 48 h treatment with the indicated concentration of human IFN-β. Each data point denotes mean of n = 3 replicates ± SEM. EC50 determinations for each cell line are presented in Table S1. (C) Confluence was normalized to 0 U/mL IFN control from each cell line.
Figure 6
Figure 6
deISGylation does not mediate IFN sensitivity across diverse cancer lineages (A) Parental human cancer cell lines were electroporated with C64S donor oligo and sgRNA targeted to hUSP18. Allelic frequency was determined by sequencing samples 72 h post-electroporation (time initial) and after 2 additional weeks of passaging cells (time final) in the presence (+) or absence (−) of 1000 U/mL human IFN-α. KO indicates frameshift mutation or in-frame mutation ≥21 bp; WT indicates no mutation or in-frame mutation <21 bp; KI indicates donor oligo integration at the appropriate position. An independent biological replicate was electroporated, passaged, and sequenced in parallel (Figure S4). (B and C) Summary of data presented in (A) and Figure S4. (B) Cumulative percent allelic frequency for each genotype (C64S KI, USP18 KO, WT) at the indicated time point, summed across all cell lines and biological replicates. (C) Percent allelic frequency for each genotype at time final -IFN was subtracted from time final +IFN. Positive or negative values indicate an increase or decrease, respectively, in allelic frequency after IFN treatment. Each square denotes the mean of 2 biological replicates. See also Figure S4.
Figure 7
Figure 7
Inhibiting deISGylase activity is not sufficient to confer IFN sensitivity Individual unedited control (unedited), mUSP18 C61S KI (C61S), and mUsp18 KO (KO) clones were compared to parental CT26 cells (WT). Unedited control clones underwent same electroporation conditions as C61S KI and KO clones, but no editing was observed at the endogenous mUsp18 locus. (A) Cells were treated with 1000 U/mL murine IFN-α for 24 h prior to cell lysis and whole-cell lysates were analyzed by western blot for levels of mouse ISGylated proteins and free mISG15 (top) or vinculin (bottom). (B) Cell viability (left) and confluence (right) were measured after 72 h or 84 h treatment with the indicated concentration of murine IFN-α, respectively. Viability and confluence were normalized to 0 U/mL IFN control for each cell line. Each data point denotes a mean of n = 2 replicates ± SEM. EC50 determinations for each cell line are presented in Table S1. (C and D) Tumor growth curves of WT, C61S, or KO CT26 tumors injected into wild-type BALB/c mice. For each genotype, 3 individual clones were injected with n = 10 animals per clone (n = 30 animals per genotype). Data are represented as (C) individual animals and (D) mean tumor growth was first determined for each clone, and data for each genotype are represented as the mean of 3 clones ± SEM. Results from nonlinear regression analysis are presented in Table S1. (E) Wild-type USP18 can negatively regulate Type I IFN responses through its catalytic function to deISGylate ISG15-conjuagated proteins and its scaffold function to repress IFNAR signaling by displacing JAK1. Negative IFN regulation by wild-type USP18 protects cancer cells from Type I IFN sensitivity. Complete loss-of-function mutations in USP18 confer sensitivity to Type I IFN, resulting in enhanced ISG induction, ISGylation, and cancer cell growth inhibition. Mutations in USP18 C64S (human) or C61S (mouse) disrupt deISGylase activity, but are not sufficient to confer IFN sensitivity across cancer lineages. However, partial impairments in scaffold function in human USP18 I60N mutants results in partial IFN sensitivity and an intermediate phenotype between WT and hUSP18 KO. Model created with BioRender.com. See also Figures S5–S7.

References

    1. McNab F., Mayer-Barber K., Sher A., Wack A., O'Garra A. Type I interferons in infectious disease. Nat. Rev. Immunol. 2015;15:87–103. doi: 10.1038/nri3787. - DOI - PMC - PubMed
    1. Snell L.M., McGaha T.L., Brooks D.G. Type I Interferon in Chronic Virus Infection and Cancer. Trends Immunol. 2017;38:542–557. doi: 10.1016/j.it.2017.05.005. - DOI - PMC - PubMed
    1. Schneider W.M., Chevillotte M.D., Rice C.M. Interferon-stimulated genes: a complex web of host defenses. Annu. Rev. Immunol. 2014;32:513–545. doi: 10.1146/annurev-immunol-032713-120231. - DOI - PMC - PubMed
    1. Bekisz J., Baron S., Balinsky C., Morrow A., Zoon K.C. Antiproliferative Properties of Type I and Type II Interferon. Pharmaceuticals. 2010;3:994–1015. doi: 10.3390/ph3040994. - DOI - PMC - PubMed
    1. Gessani S., Conti L., Del Cornò M., Belardelli F. Type I interferons as regulators of human antigen presenting cell functions. Toxins. 2014;6:1696–1723. doi: 10.3390/toxins6061696. - DOI - PMC - PubMed

LinkOut - more resources