

Single cell characterization of blood and expanded regulatory T cells in autoimmune polyendocrine syndrome type 1
- PMID: 38632993
- PMCID: PMC11022049
- DOI: 10.1016/j.isci.2024.109610
Single cell characterization of blood and expanded regulatory T cells in autoimmune polyendocrine syndrome type 1
Abstract
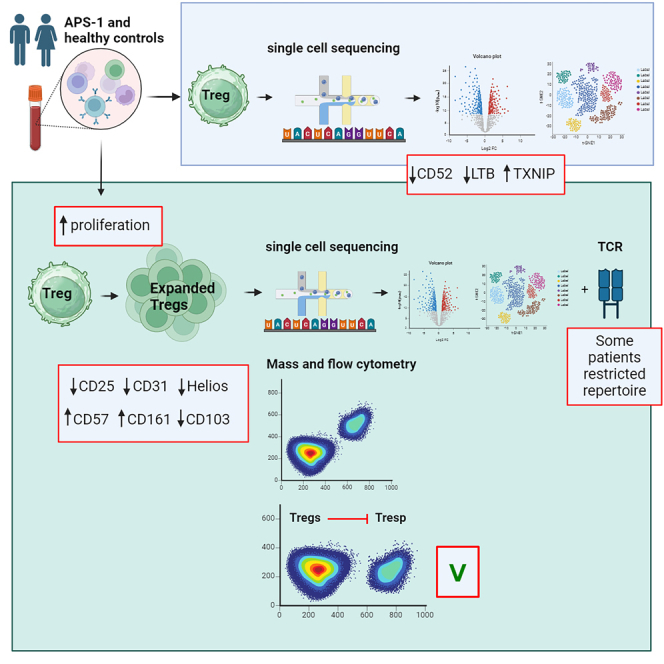
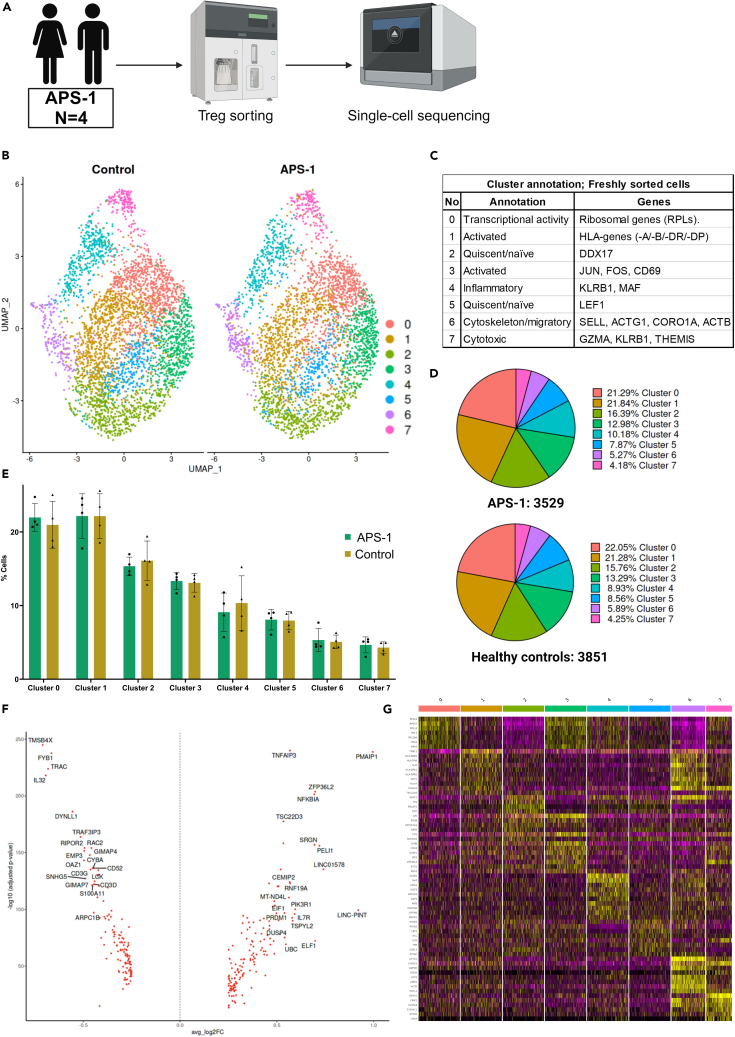
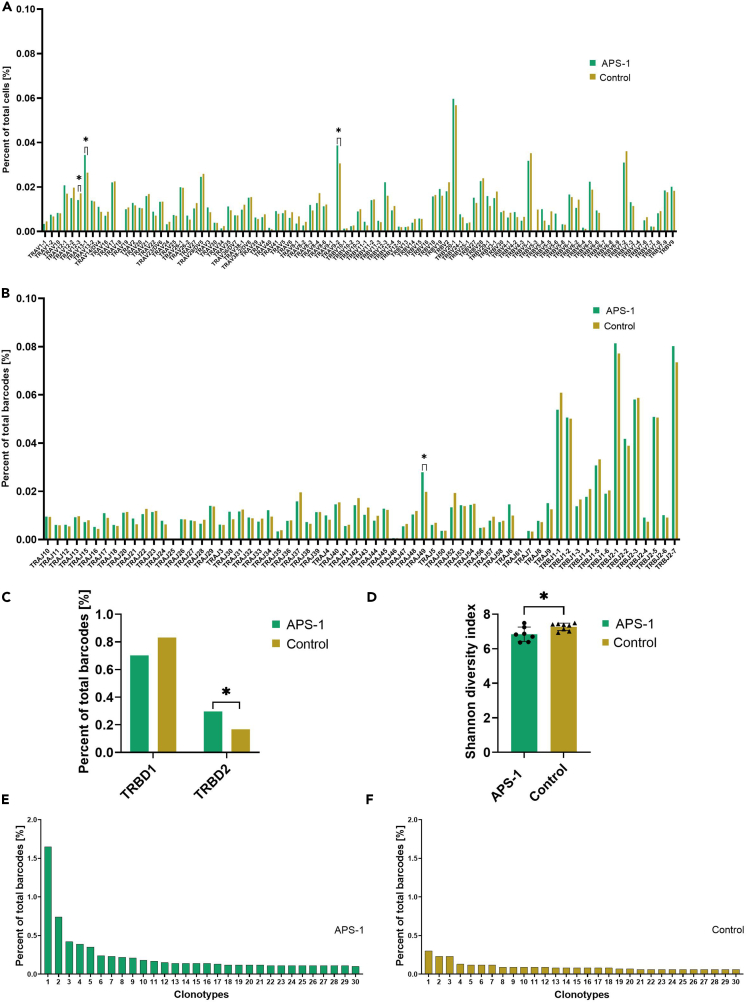
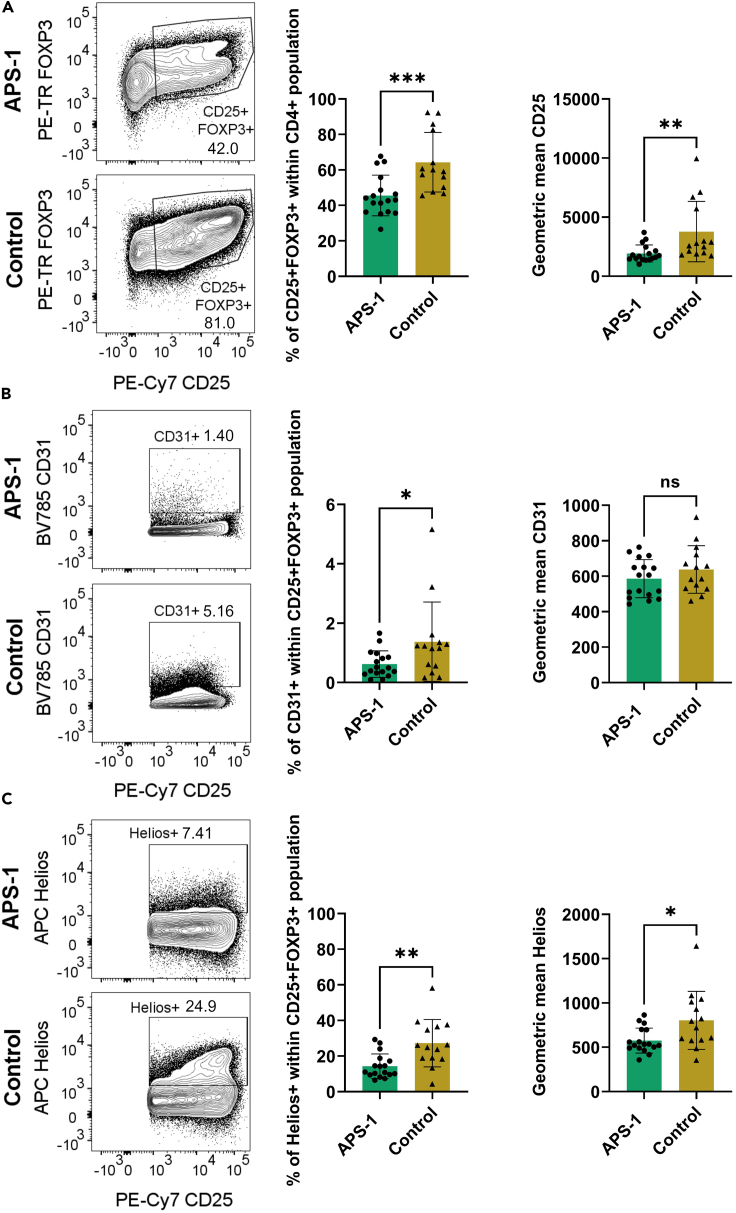
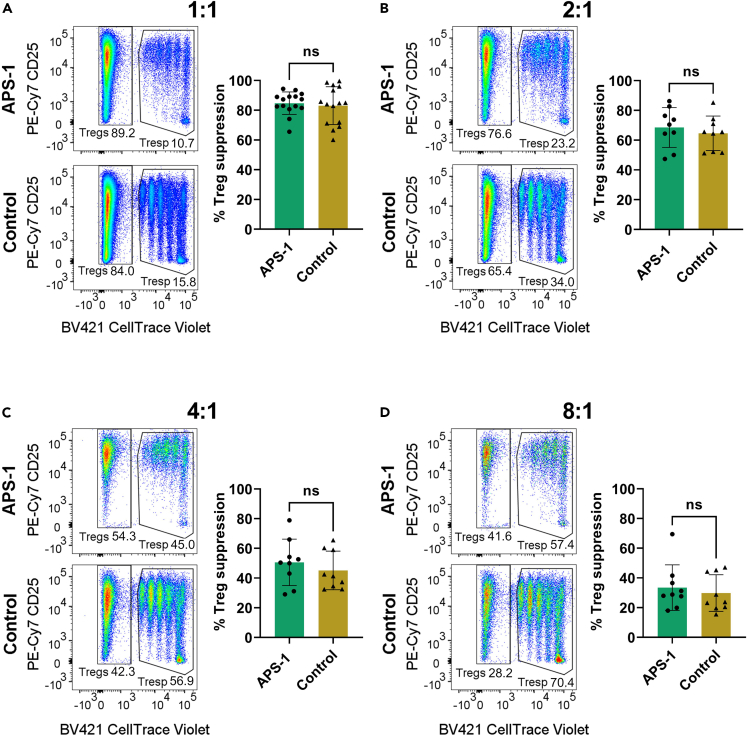
Immune tolerance fails in autoimmune polyendocrine syndrome type 1 (APS-1) because of AIRE mutations. We have used single cell transcriptomics to characterize regulatory T cells (Tregs) sorted directly from blood and from in vitro expanded Tregs in APS-1 patients compared to healthy controls. We revealed only CD52 and LTB (down) and TXNIP (up) as consistently differentially expressed genes in the datasets. There were furthermore no large differences of the TCR-repertoire of expanded Tregs between the cohorts, but unique patients showed a more restricted use of specific clonotypes. We also found that in vitro expanded Tregs from APS-1 patients had similar suppressive capacity as controls in co-culture assays, despite expanding faster and having more exhausted cells. Our results suggest that APS-1 patients do not have intrinsic defects in their Treg functionality, and that their Tregs can be expanded ex vivo for potential therapeutic applications.
Keywords: Components of the immune system; Health sciences; Immunology; Proteomics; Transcriptomics.
© 2024 The Author(s).
Conflict of interest statement
The authors declare no competing interests.
Figures

Similar articles
-
Transcriptional Changes in Regulatory T Cells From Patients With Autoimmune Polyendocrine Syndrome Type 1 Suggest Functional Impairment of Lipid Metabolism and Gut Homing.Front Immunol. 2021 Aug 30;12:722860. doi: 10.3389/fimmu.2021.722860. eCollection 2021. Front Immunol. 2021. PMID: 34526996 Free PMC article.
-
Regulatory T cells expanded from HIV-1-infected individuals maintain phenotype, TCR repertoire and suppressive capacity.PLoS One. 2014 Feb 3;9(2):e86920. doi: 10.1371/journal.pone.0086920. eCollection 2014. PLoS One. 2014. PMID: 24498287 Free PMC article.
-
Human Regulatory T Cells From Umbilical Cord Blood Display Increased Repertoire Diversity and Lineage Stability Relative to Adult Peripheral Blood.Front Immunol. 2020 Apr 15;11:611. doi: 10.3389/fimmu.2020.00611. eCollection 2020. Front Immunol. 2020. PMID: 32351504 Free PMC article.
-
Restoring self-tolerance in autoimmune diseases by enhancing regulatory T-cells.Cell Immunol. 2019 May;339:41-49. doi: 10.1016/j.cellimm.2018.09.008. Epub 2018 Sep 29. Cell Immunol. 2019. PMID: 30482489 Free PMC article. Review.
-
Autoimmune regulator and self-tolerance - molecular and clinical aspects.Immunol Rev. 2016 May;271(1):127-40. doi: 10.1111/imr.12419. Immunol Rev. 2016. PMID: 27088911 Review.
Cited by
-
Immune cell subsets in autoimmune polyendocrine syndrome type I.Sci Rep. 2025 Aug 4;15(1):28398. doi: 10.1038/s41598-025-12634-y. Sci Rep. 2025. PMID: 40759705 Free PMC article.
-
Where AIRE we now? Where AIRE we going?Curr Opin Allergy Clin Immunol. 2024 Dec 1;24(6):448-456. doi: 10.1097/ACI.0000000000001041. Epub 2024 Oct 23. Curr Opin Allergy Clin Immunol. 2024. PMID: 39440452 Free PMC article. Review.
-
Longitudinal Immune Profiling in Autoimmune Polyendocrine Syndrome Type 1.Scand J Immunol. 2025 Apr;101(4):e70021. doi: 10.1111/sji.70021. Scand J Immunol. 2025. PMID: 40166896 Free PMC article.
References
-
- Aaltonen J., Björses P., Perheentupa J., Horelli–Kuitunen N., Palotie A., Peltonen L., Lee Y.S., Francis F., Henning S., Thiel C., et al. An autoimmune disease, APECED, caused by mutations in a novel gene featuring two PHD-type zinc-finger domains. Nat. Genet. 1997;17:399–403. doi: 10.1038/ng1297-399. - DOI - PubMed
-
- Anderson M.S., Venanzi E.S., Klein L., Chen Z., Berzins S.P., Turley S.J., von Boehmer H., Bronson R., Dierich A., Benoist C., Mathis D. Projection of an Immunological Self Shadow within the Thymus by the Aire Protein. Science. 2002;298:1395–1401. - PubMed
LinkOut - more resources
Full Text Sources
Molecular Biology Databases
Miscellaneous
