. 2024 Mar 27;27(4):109583.
doi: 10.1016/j.isci.2024.109583. eCollection 2024 Apr 19.

The single D380 amino acid substitution increases pneumolysin cytotoxicity toward neuronal cells

Affiliations

The single D380 amino acid substitution increases pneumolysin cytotoxicity toward neuronal cells

Simona Serra et al. iScience. .

Abstract

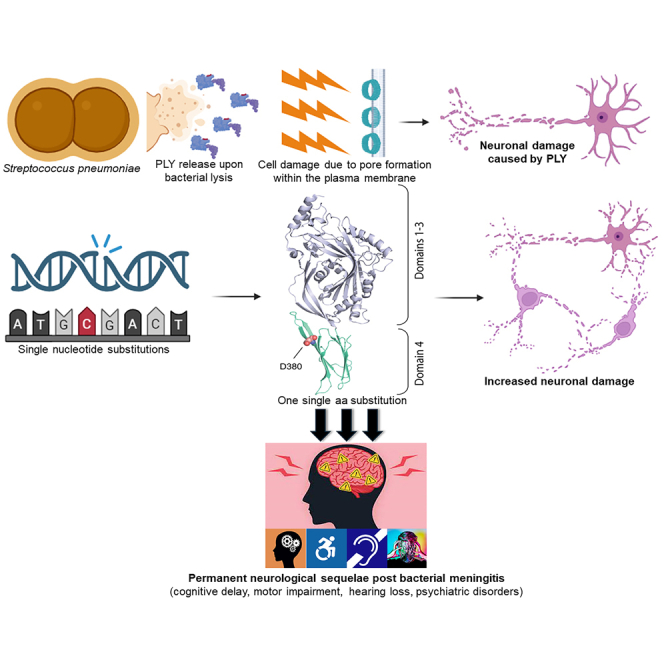
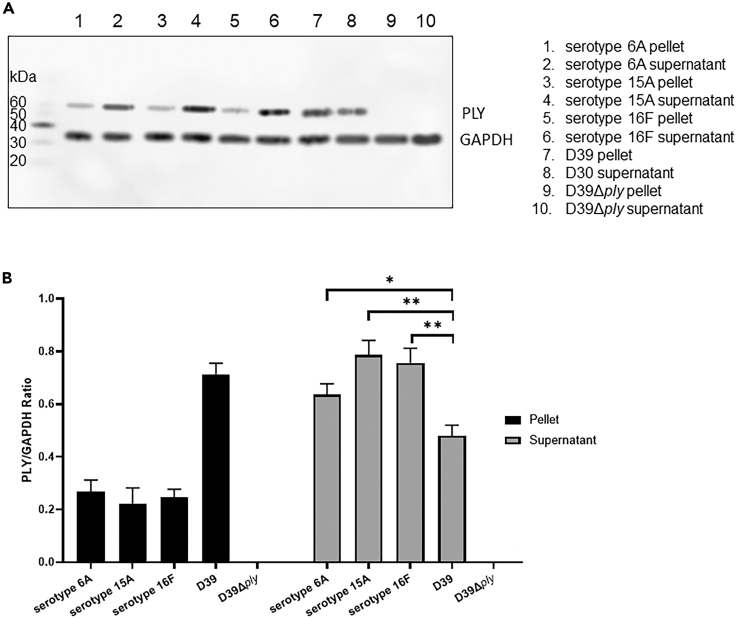
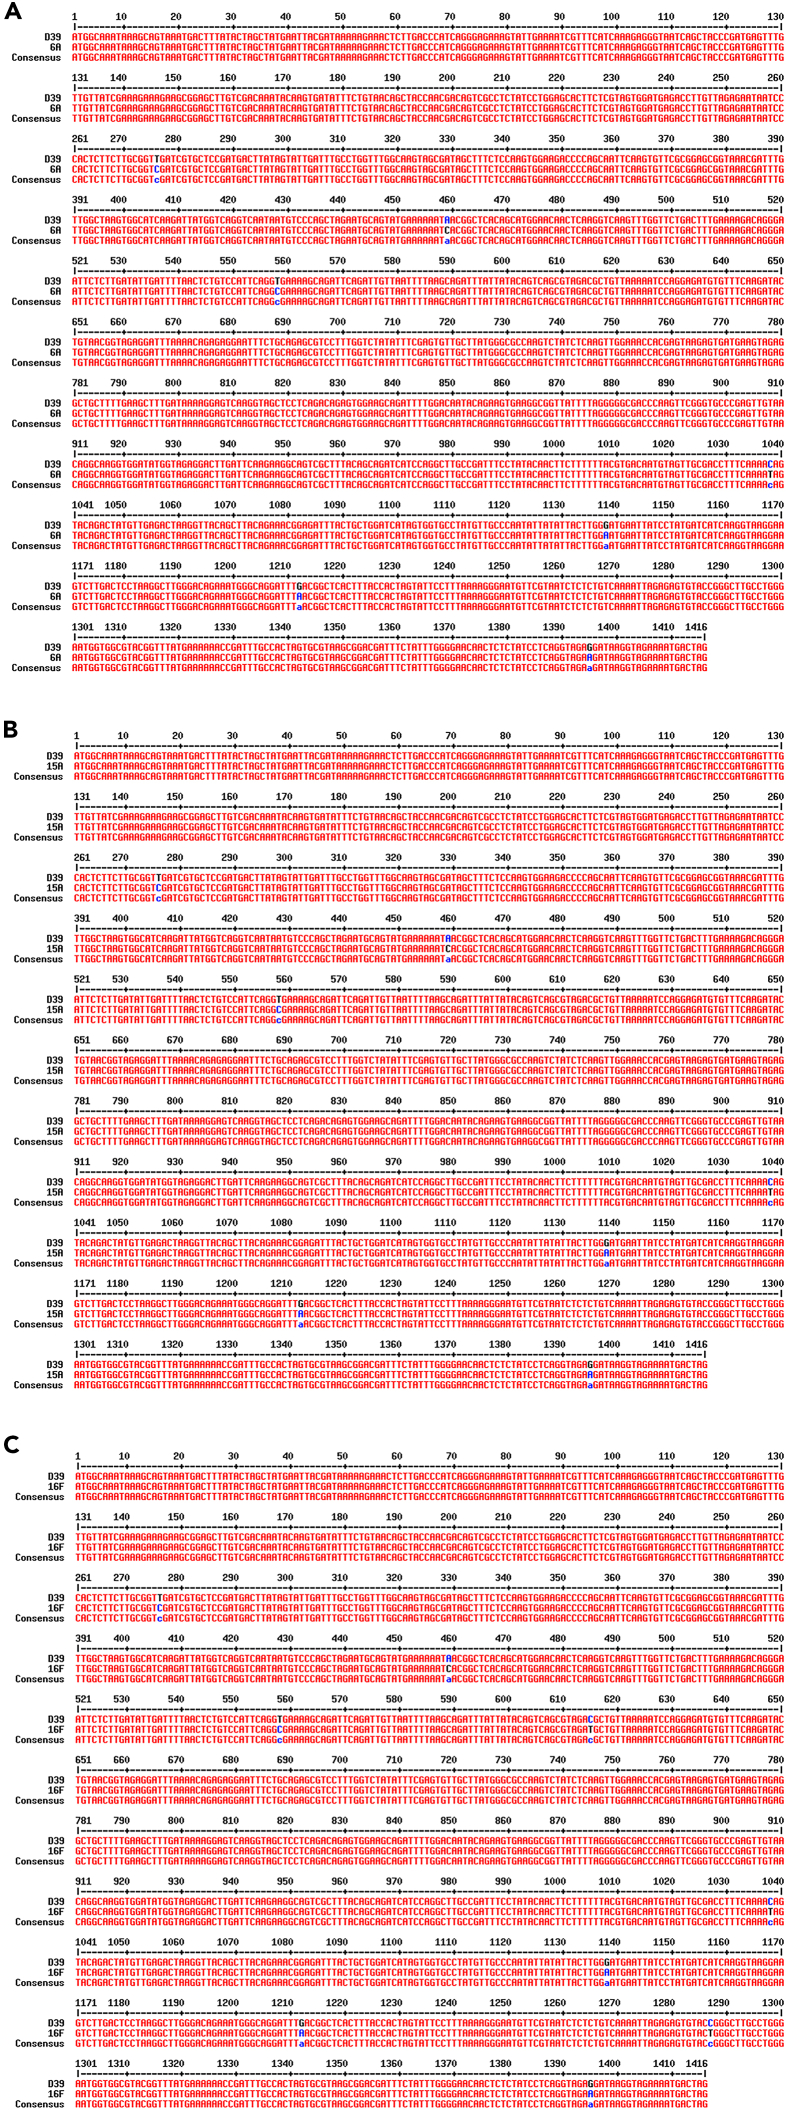
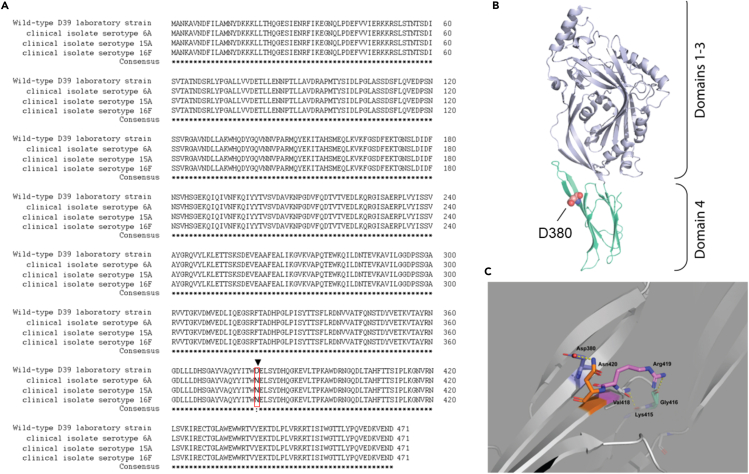
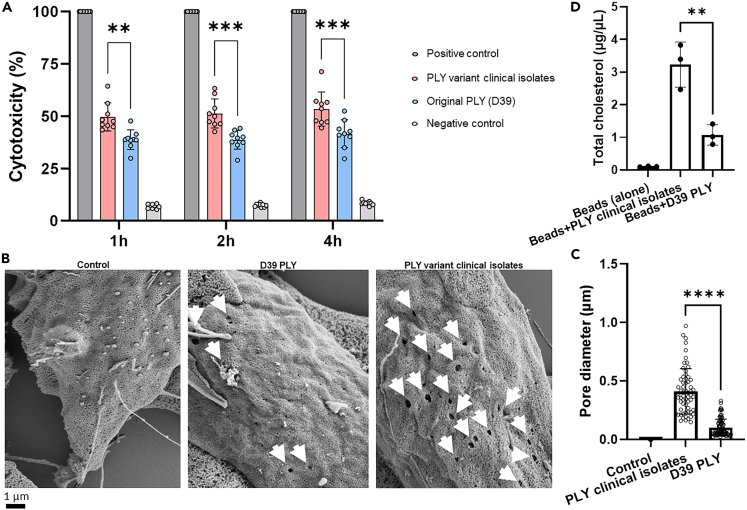
Bacterial meningitis, frequently caused by Streptococcus pneumoniae (pneumococcus), represents a substantial global health threat leading to long-term neurological disorders. This study focused on the cholesterol-binding toxin pneumolysin (PLY) released by pneumococci, specifically examining clinical isolates from patients with meningitis and comparing them to the PLY-reference S. pneumoniae strain D39. Clinical isolates exhibit enhanced PLY release, likely due to a significantly higher expression of the autolysin LytA. Notably, the same single amino acid (aa) D380 substitution in the PLY D4 domain present in all clinical isolates significantly enhances cholesterol binding, pore-forming activity, and cytotoxicity toward SH-SY5Y-derived neuronal cells. Scanning electron microscopy of human neuronal cells and patch clamp electrophysiological recordings on mouse brain slices confirm the enhanced neurotoxicity of the PLY variant carrying the single aa substitution. This study highlights how a single aa modification enormously alters PLY cytotoxic potential, emphasizing the importance of PLY as a major cause of the neurological sequelae associated with pneumococcal meningitis.

Keywords: Biochemistry; Biological sciences; Medical Microbiology; Microbiology; Molecular neuroscience; Natural sciences; Neuroscience.


Conflict of interest statement

The authors declare no competing interests.

Figures

None
Graphical abstract
Figure 1
Figure 1
Quantification of PLY released by THY-grown pneumococcal meningitis clinical isolates and D39 reference strain (A) PLY and GAPDH, respectively at approximately 53–55 kDa and 35–37 kDa, detected by western blot analysis in pellet and supernatant from pneumococcal liquid cultures in THY; western blot analysis was repeated three times (n = 3), each time with different cultures of pneumococci, the displayed western blot is representative of three biological replicates. (B) Quantification of PLY (PLY/GAPDH ratio) in pellet (PLY within bacterial cells) and supernatant (released PLY) from the western blot results shown in Figure 1A; columns represent average values and error bars are standard deviations calculated using the PLY/GAPDH values of each strain/isolate among three biological replicates; ∗ = p < 0.05, ∗∗ = p < 0.01 (2-tails ANOVA test was run to assess the presence of differences between the groups, and then a Dunn’s test was applied for pairwise comparisons; p = 0.034 for the comparison between D39 and serotype 6A, p = 0.007 for the comparison between D39 and serotype 15A, p = 0.008 for the comparison between D39 and serotype 16F; Group comparison F = 1.564, T = 7.632, R2 = 0.8562, Degree of Freedom = 10).
Figure 2
Figure 2
Increased amounts of PLY released by pneumococcal meningitis clinical isolates upon growth in human blood (A) Detection of PLY signal (green) by immunofluorescence microscopy using serum samples from pneumococcal cultures in whole human blood; each image is representative of 15 images taken per each clinical isolate/strain/biological replicate (n = 45). (B) Quantification of the area, measured by ImageJ, occupied by PLY fluorescence signal in each image/field of view (each field of view displayed one dried drop of serum) from the immunofluorescence microscopy analysis shown in Figure 2A; columns represent average values and error bars are standard deviations calculated using the area values of the PLY fluorescence signal in each image/field of view per each strain/isolate; ∗∗∗ = p < 0.001, ∗∗∗∗ = p < 0.0001 (2-tails ANOVA test was run to assess the presence of differences between the groups, and then a Dunn’s test was applied for pairwise comparisons; Group comparison F = 7.732, T = 14.76, R2 = 0.5225, Degree of Freedom = 10).
Figure 3
Figure 3
Quantification of LytA expressed by the pneumococcal meningitis clinical isolates and S. pneumoniae D39 (A) LytA was detected at approximately 37 kDa by western blot analysis in pneumococcal lysates (pellets); western blot analysis was repeated three times (n = 3), each time with different cultures of pneumococci, the displayed western blot is representative of three biological replicates. (B) Grayscale Coomassie staining of lysates of D39 and the meningitis clinical isolates used as loading control to quantify the expression levels of LytA, the same volume and amount of protein content as the one used for the western blot in Figure 3A was used for the Coomassie staining; the arrow points toward the band where at the same molecular weight LytA was detected; the staining of the whole protein content reveals that, with the same protein quantity, D39 seems to have more proteins within the range of 10 and 40 kDa, whilst the clinical isolates have much more protein content, including LytA, at around 40 kDa. (C) Quantification of LytA (PLY/Protein content ratio) in D39 and the meningitis clinical isolates from the western blot and the Coomassie staining results shown in, respectively, Figures 1A and 1B; columns represent average values and error bars are standard deviations calculated using the LytA/Protein content values of each strain/isolate among the three biological replicates of the LytA western blot (the same Coomassie staining was used for the quantification of LytA in each western blot); ∗∗∗p < 0.001 (2-tails ANOVA test was run to assess the presence of differences between the groups, and then a Dunn’s test was applied for pairwise comparisons; Group comparison F = 1.13, T = 7.212, R2 = 0.964, Degree of Freedom = 11).
Figure 4
Figure 4
Alignment of ply gene sequences from S. pneumoniae D39 reference strain and pneumococcal meningitis clinical isolates Ply gene sequence of D39 was aligned along with the ply gene sequence of the serotype 6A (A), 15A (B) and 16F (C) pneumococcal meningitis clinical isolates; gene sequence alignment was performed using the Multalign online tool, the “Consensus” sequence represents the overlap between the D39 ply sequence and the ply sequence of the meningitis clinical isolates; nucleotide substitutions are marked in blue.
Figure 5
Figure 5
A single amino acid substitution changes the conformation of the D4 domain in the new PLY variant of the pneumococcal meningitis clinical isolates Conservation and structural interpretation of PLY variants. (A) Clustal Omega alignment of the wild-type D39 PLY aa sequence and the three clinical isolates. The critical D380 > N mutation is boxed in red. (B) Cartoon model of the pneumococcal PLY structure (PDB code 5AOD) showing the placement of the Asp380 residue and (C) closeup of its hydrogen bonding with nearby residues in which potential static interactions are shown as dashed yellow lines.
Figure 6
Figure 6
The PLY of the pneumococcal meningitis clinical isolates is more neuronal cytotoxic than the PLY of D39 due to a stronger capability to interact with cholesterol which leads to an enhanced pore-forming activity (A) LDH release assay using human SH-SY5Y-derived neuronal cells treated with the two recombinant PLY variants (original PLY from D39 and the PLY variant from the pneumococcal meningitis clinical isolates) showed the degree of neuronal cell death (% cytotoxicity) caused by the toxin; cells treated with lysis buffer were the “Positive control,” untreated cells were the “Negative control”; three biological replicates (three technical replicates in each biological replicate) were performed (n = 3), columns represent average value, datapoints represent all the technical replicates of all three biological replicates; cytotoxicity of the Positive control was set as 100%; ∗∗ = p < 0.01, ∗∗∗ = p < 0.001 (2-tails ANOVA test was run to assess the presence of differences between the groups, and then a Dunn’s test was applied for pairwise comparisons; p = 0.002 for the comparison between PLY of clinical isolates and D39 PLY at 1h; Group comparison F = 1.581, T = 7.714, R2 = 0.9370, Degree of Freedom = 4). (B) Scanning electron microscopy of the cell surface of SH-SY5Y-derived neuronal cells after 30 min of treatment with either the recombinant PLY of D39 (original PLY) or the recombinant PLY of the pneumococcal meningitis clinical isolates (new PLY variant), untreated neuronal cells were used as control; Approximately 120 neuronal cells were images per each experimental condition (untreated as “Control,” treatment with original PLY, treatment with new PLY variant), pores are indicated by white arrows. (C) Measurement of the pore diameter on the plasma membrane of neuronal cells treated with either PLY of clinical isolates of D39 PLY; each datapoint in scatter dot plot represents one pore in each individual image analyzed by SEM (n = 56), columns represent average values and error bars are the standard deviations; all the SEM images in which pores had a regular circle shape were used for this quantification; ∗∗∗∗ = p < 0.0001. (D) Quantification of cholesterol bound to either the recombinant PLY of the meningitis clinical isolates or the PLY of D39, or to the beads alone; bars represent average values, error bars the standard deviations; Each datapoint represents the quantification of cholesterol performed in one biological replicate of the pull-down experiment (three biological replicates in total, n = 3); the amounts of cholesterol bound to either recombinant PLYs or beads alone was adjusted by matching the same amount of PLY bound to the beads according to the Western blot-based quantification of PLY bound to the beads shown in Figures 5A–5C; ∗∗ = p < 0.01 (2-tails ANOVA test was run to assess the presence of differences between the groups, and then a Dunn’s test was applied for pairwise comparisons; p = 0.008 for the comparison between “Beads+PLY clinical isolates” and “Beads+D39 PLY”; Group comparison F = 1.13, T = 4.904, R2 = 0.8574, Degree of Freedom = 4).
Figure 7
Figure 7
Ex vivo whole cell patch clamp electrophysiological recording confirms that the PLY variant of the meningitis clinical isolates functionally impairs neurons quicker and more robustly than the PLY of D39 Whole cell patch clamp recordings were obtained from striatal neurons ex vivo and the membrane voltage responses to a series of current steps were acquired before and after the bath application of PLYs. A single current injection step was intermittently applied to the neuron to monitor the health of the neuron (Control). Over time, neurons exposed to either PLY variants showed signs of deteriorating neuronal health when compared to control. (A) Input resistance of recorded neurons before (black) and after (gray) the addition of the toxin; n = 9 nr of neurons in brain slices incubated with ACSF with the addition of PLY of clinical isolates, n = 9 nr of neurons in brain slices incubated with ACSF with the addition of PLY of D39. (B) Change in input resistance (IR) as a proportion of control recordings in the presence of PLY of the meningitis clinical isolates (black) or PLY of D39 (gray) according to the input resistant measurements shown in Figure 7A. (C) Membrane potential (MP) of recorded neurons before (black) and after (gray) the addition of toxin; n = 9 nr of neurons in brain slices incubated with ACSF with the addition of PLY of clinical isolates, n = 9 nr of neurons in brain slices incubated with ACSF with the addition of PLY of D39. (D) Change in membrane potential as a proportion of control recordings in the presence of presence of PLY of the meningitis clinical isolates (black) or PLY of D39 (gray) according to the input resistant measurements shown in Figure 7C. ∗ = p < 0.05, ∗∗ = p < 0.01 (p = 0.037 for the comparison between PLY clinical isolates and D39 PLY concerning normalized IR, p = 0.027 for the comparison between PLY clinical isolates and D39 PLY concerning Normalized MP, p = 0.003 for the comparison of IR and MP before and after PLY clinical isolates, p = 0.007 for the comparison of IR and MP before and after D39 PLY; Data in Figures 6A–6D resulted not in normal distribution and Wilcoxon test was applied with a Degree of Freedom = 9; Data in Figure 6B resulted in normal distribution and unpaired t-test was applied, F = 1.064, T = 2.282, R2 = 0.2578, Degree of Freedom = 15).

Similar articles

References

    1. van de Beek D., Brouwer M.C., Koedel U., Wall E.C. Community-acquired bacterial meningitis. Lancet. 2021;398:1171–1183. - PubMed
    1. Iovino F., Seinen J., Henriques-Normark B., van Dijl J.M. How Does Streptococcus pneumoniae Invade the Brain? Trends Microbiol. 2016;24:307–315. - PubMed
    1. Vögele M., Bhaskara R.M., Mulvihill E., van Pee K., Yildiz Ö., Kühlbrandt W., Müller D.J., Hummer G. Membrane perforation by the pore-forming toxin pneumolysin. Proc. Natl. Acad. Sci. USA. 2019;116:13352–13357. - PMC - PubMed
    1. Hirst R.A., Kadioglu A., O'callaghan C., Andrew P.W. The role of pneumolysin in pneumococcal pneumonia and meningitis. Clin. Exp. Immunol. 2004;138:195–201. - PMC - PubMed
    1. Braun J.S., Hoffmann O., Schickhaus M., Freyer D., Dagand E., Bermpohl D., Mitchell T.J., Bechmann I., Weber J.R. Pneumolysin causes neuronal cell death through mitochondrial damage. Infect. Immun. 2007;75:4245–4254. - PMC - PubMed

LinkOut - more resources