. 2024 Mar 4;15(4):2014-2047.
doi: 10.1364/BOE.514079. eCollection 2024 Apr 1.

Optical coherence tomography for multicellular tumor spheroid category recognition and drug screening classification via multi-spatial-superficial-parameter and machine learning

Affiliations

Optical coherence tomography for multicellular tumor spheroid category recognition and drug screening classification via multi-spatial-superficial-parameter and machine learning

Feng Yan et al. Biomed Opt Express. .

Abstract

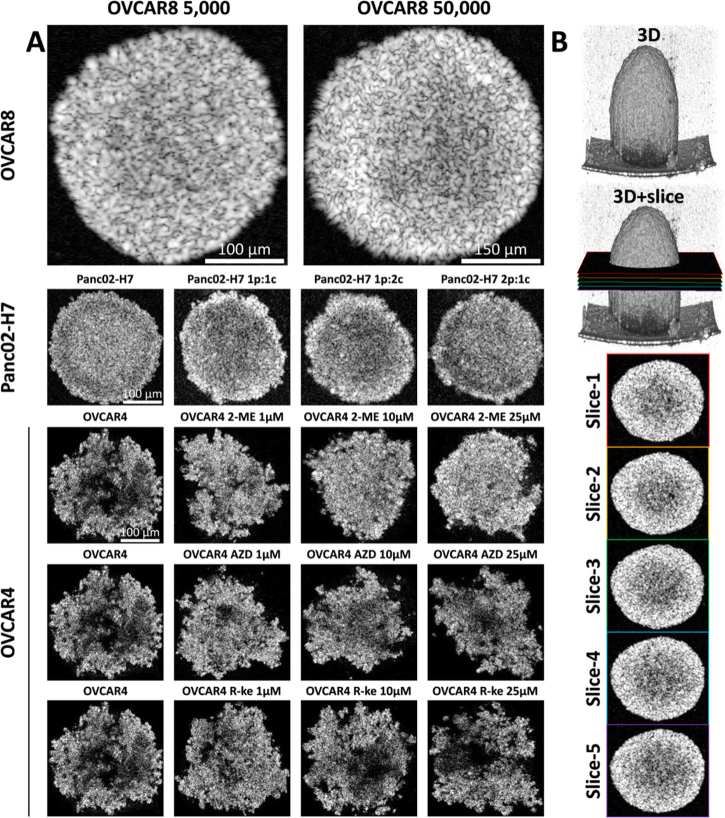
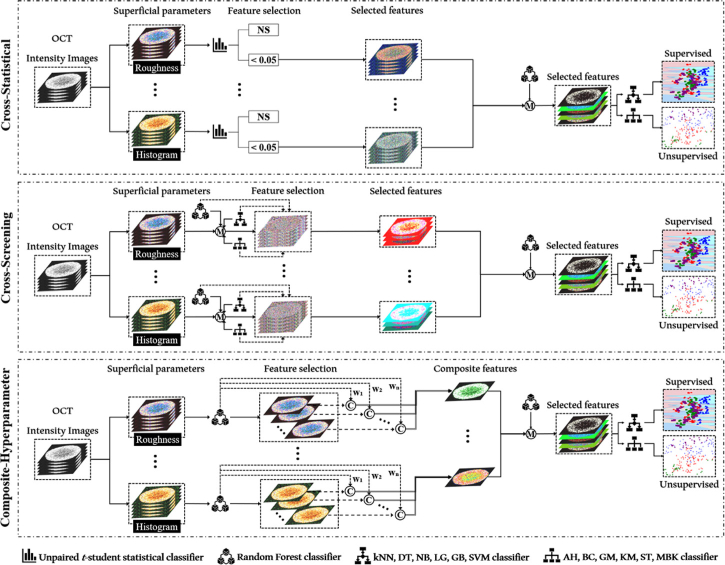
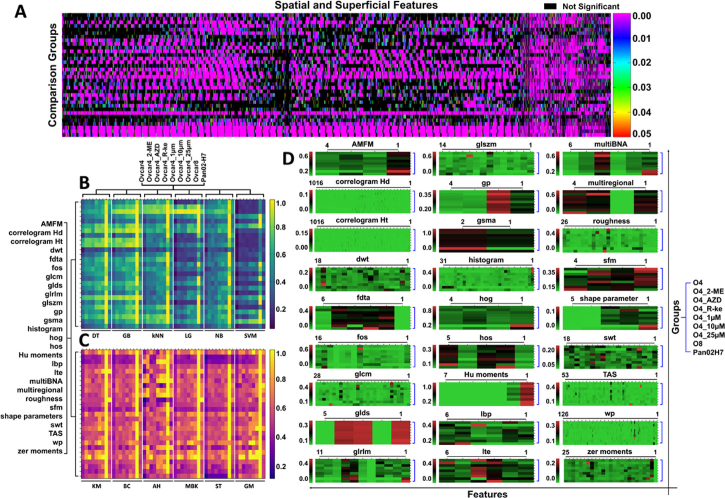
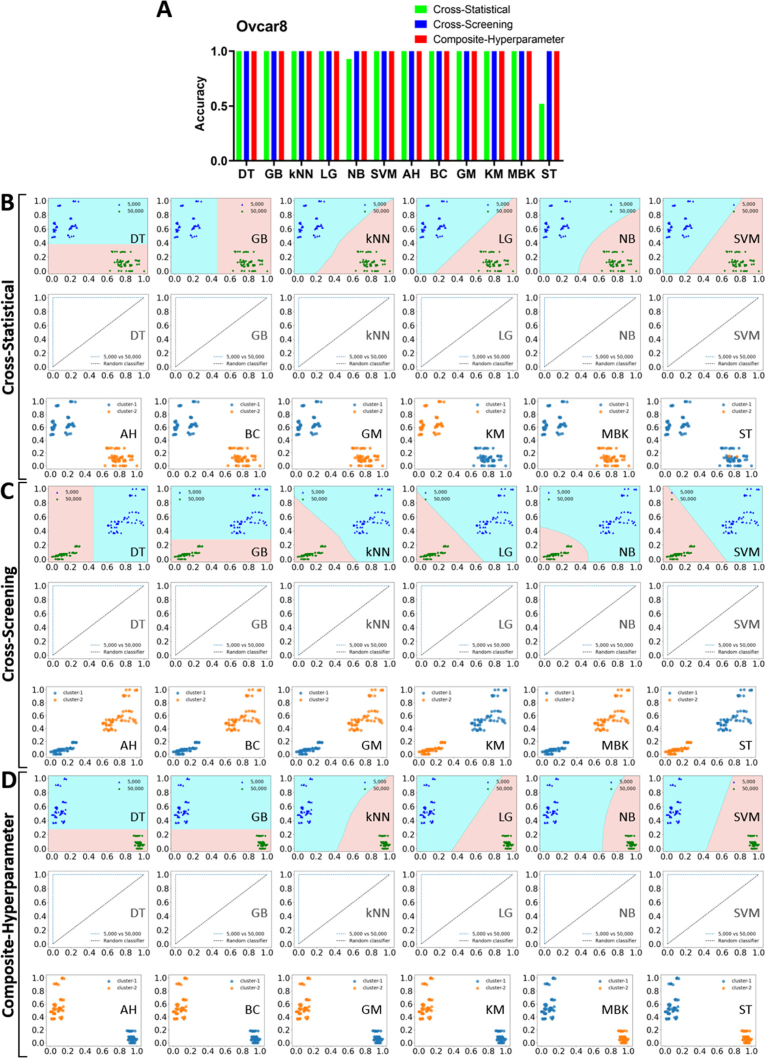
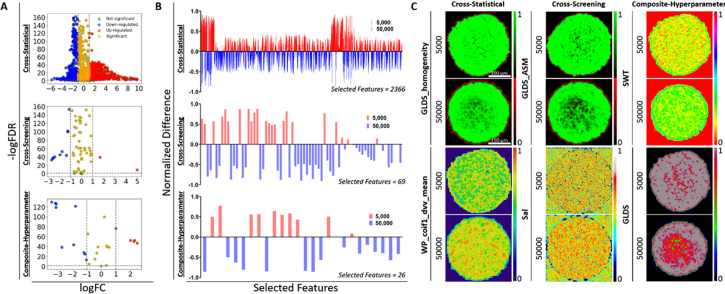
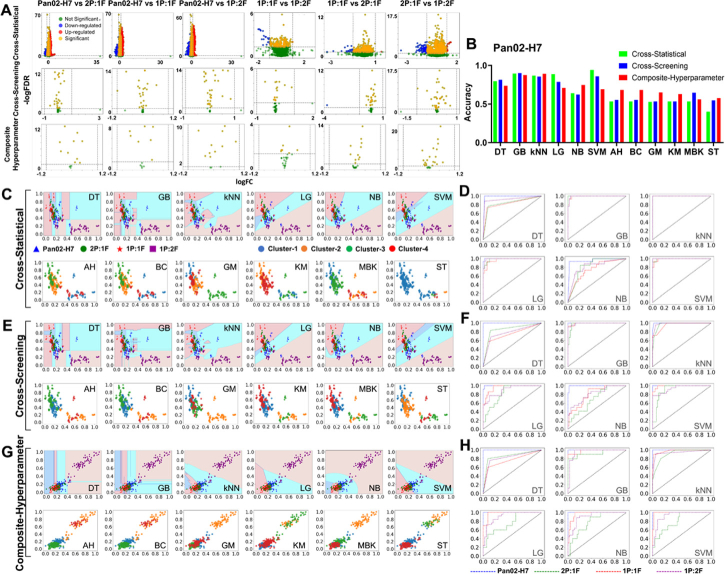
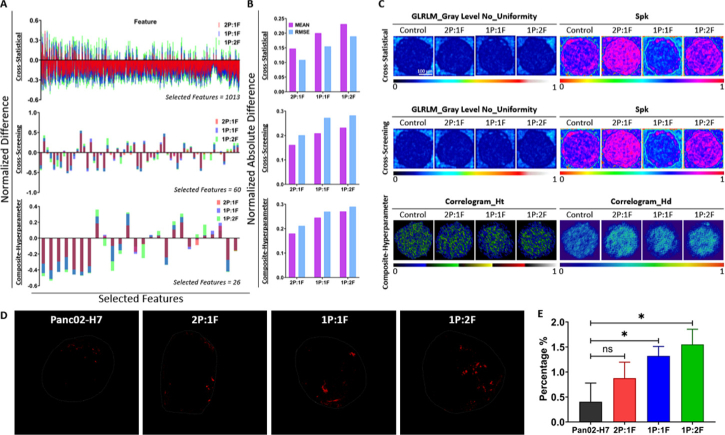
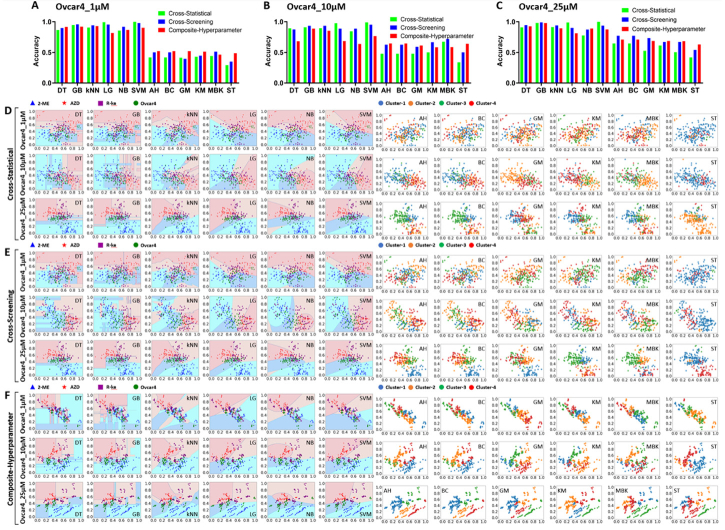
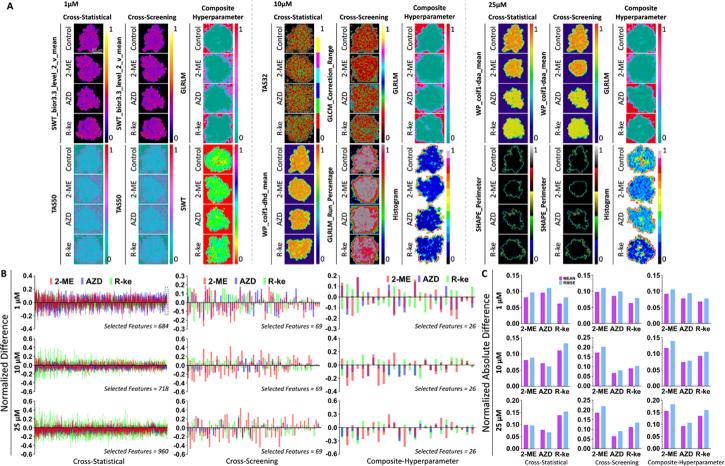
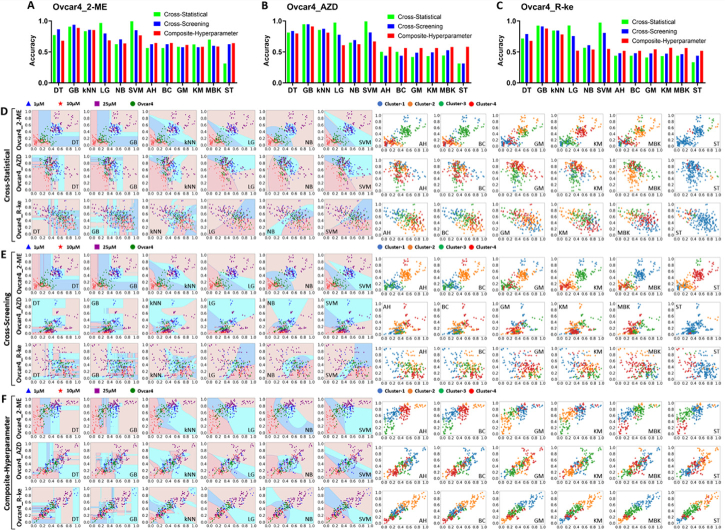
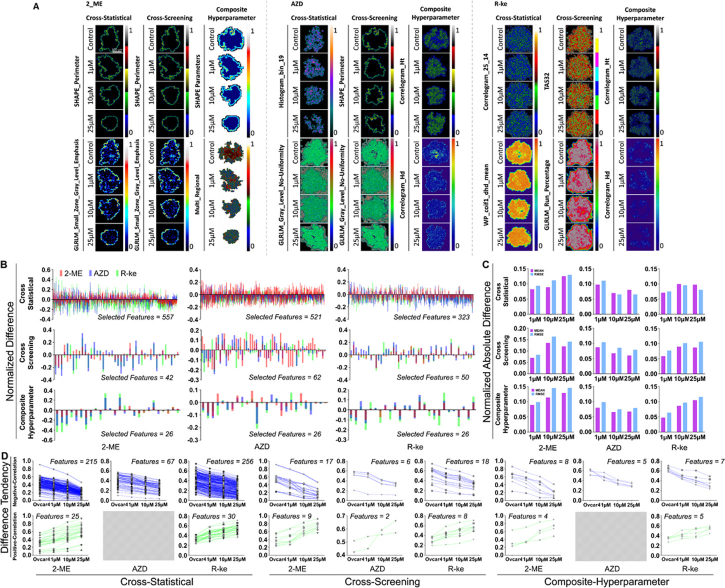
Optical coherence tomography (OCT) is an ideal imaging technique for noninvasive and longitudinal monitoring of multicellular tumor spheroids (MCTS). However, the internal structure features within MCTS from OCT images are still not fully utilized. In this study, we developed cross-statistical, cross-screening, and composite-hyperparameter feature processing methods in conjunction with 12 machine learning models to assess changes within the MCTS internal structure. Our results indicated that the effective features combined with supervised learning models successfully classify OVCAR-8 MCTS culturing with 5,000 and 50,000 cell numbers, MCTS with pancreatic tumor cells (Panc02-H7) culturing with the ratio of 0%, 33%, 50%, and 67% of fibroblasts, and OVCAR-4 MCTS treated by 2-methoxyestradiol, AZD1208, and R-ketorolac with concentrations of 1, 10, and 25 µM. This approach holds promise for obtaining multi-dimensional physiological and functional evaluations for using OCT and MCTS in anticancer studies.


Conflict of interest statement

The authors declare no competing interests.

Figures

Fig. 1.
Fig. 1.
OCT images of different sample groups and the image selecting protocol. A, representative OCT intensity images of multicellular tumor spheroids culturing with different cell numbers, cell types, and treated by different drugs. B, the selection protocol of representative OCT images for data processing. 5 slices with 20 µm depth interval started at the middle height of the spheroid are selected as representative slices for data processing.
Fig. 2.
Fig. 2.
Overview of the cross-statistical, cross-screening, and composite-hyperparameter feature processing framework. NS, not significant. M, model prediction. C, convolution calculation. W, weight. DT, decision tree model. GB, gradient boosting model. kNN, k-nearest neighbor model. LG, logistics model. NB, naïve bayes model. SVM, support vector machine model. KM, k-means model. BC, birch model. AH, agglomerative hierarchical model. MBK, mini batch k-means model. ST, spectral model. GM, Gaussian mixture model.
Fig. 3.
Fig. 3.
Heatmaps of texture & roughness parameters and superficial & spatial features processed by mathematical statistics and machine learning models for different MCTS categories. A, unpaired t-student statistics with p-value <0.05 of all features for the selection of effective features in the cross-statistical algorithm. The X-axis shows 2484 superficial and spatial features from 27 parameters. The specific feature orders and names are listed in Fig. S5 (order is from left to right) and Data File 1 (Ref. [68]). The Y-axis shows 34 groups of MCTS comparisons in cell number, cell type, and different drug treatment categories. The specific comparison among different groups in different categories is listed in Fig. S5. B, the accuracy of supervised models for MCTS classifications by superficial and spatial parameters. C, the accuracy of unsupervised models for MCTS classifications by superficial and spatial parameters. Six supervised and six unsupervised models are used to classify nine MCTS categories by 27 texture and roughness parameters. The filtered heatmap (accuracy >0.5) in Fig. S6 illustrates the texture and roughness parameters contributing to the effective classification of MCTS categories across the 12 machine learning models. D, the weight/importance of features in superficial and spatial parameters for the cross-screening and composite-hyperparameter algorithms. The X-axis indicates the features within the parameters and the details are listed in Fig. S5 (order is from right to left). DT, decision tree model. GB, gradient boosting model. kNN, k-nearest neighbor model. LG, logistics model. NB, naïve bayes model. SVM, support vector machine model. KM, k-means model. BC, birch model. AH, agglomerative hierarchical model. MBK, mini batch k-means model. ST, spectral model. GM, Gaussian mixture model. O4, OVCAR-4 MCTS. O4_2-ME, OVCAR-4 MCTS treated by 2-ME with 1 µM, 10 µM, and 25 µM concentrations. O4_AZD, OVCAR-4 MCTS treated by AZD with 1 µM, 10 µM, and 25 µM concentrations. O4_R-ke, OVCAR-4 MCTS treated by R-ke with 1 µM, 10 µM, and 25 µM concentrations. O4_1 µM, OVCAR-4 MCTS treated with 1 µM 2-ME, AZD, and R-ke drugs. O4_10 µM, OVCAR-4 MCTS treated with 10 µM 2-ME, AZD, and R-ke drugs. O4_25 µM, OVCAR-4 MCTS treated with 25 µM 2-ME, AZD, and R-ke drugs. O8, OVCAR-8 MCTS with 5,000 and 50,000 cell numbers. Pan02H7, Panc02-H7 MCTS with different ratio mixtures of fibroblasts.
Fig. 4.
Fig. 4.
Performance of machine learning models in OVCAR-8 MCTS classifications. A, histogram of the accuracy of machine learning models. B, model evaluation and classification performance of the cross-statistical. C, model evaluation and classification performance of the cross-screening. D, model evaluation and classification performance of the composite-hyperparameter. DT, decision tree. GB, gradient boosting. kNN, k nearest neighbor. LG, logistics. NB, naïve bayes. SVM, support vector machine. AH, agglomerative hierarchical. BC, birch. GM, Gaussian mixture. KM, k means. MBK, mini batch k-means. ST, spectral.
Fig. 5.
Fig. 5.
The statistics and difference of superficial and spatial features in OVCAR-8 MCTS. A, volcano plot of the difference among selected features. B, the normalized difference of selected features in the cross-statistical, cross-screening, and composite-hyperparameter. C, the representative images of the first two highest weight features of OVCAR-8 MCTS with different cell numbers in the cross-statistical, cross-screening, and composite-hyperparameter.
Fig. 6.
Fig. 6.
Performance of machine learning models in Panc02-H7 MCTS classifications. A, volcano plot of the difference among selected features. B, histogram of the accuracy of machine learning models. C&D, model evaluation and classification performance of the cross-statistical. E&F, model evaluation and classification performance of the cross-screening. G&H, model evaluation and classification performance of the composite-hyperparameter. DT, decision tree. GB, gradient boosting. kNN, k nearest neighbor. LG, logistics. NB, naïve bayes. SVM, support vector machine. AH, agglomerative hierarchical. BC, birch. GM, Gaussian mixture. KM, k means. MBK, mini batch k-means. ST, spectral. 2P:1F, 67% Panc02-H7 cells and 33% fibroblasts. 1P:1F, 50% Panc02-H7 cells and 50% fibroblasts. 1P:2F, 33% Panc02-H7 cells and 67% fibroblasts.
Fig. 7.
Fig. 7.
The statistics and difference of superficial and spatial features in Panc02-H7 MCTS. A, the normalized difference of selected features in the cross-statistical, cross-screening, and composite-hyperparameter. B, the absolute difference of selected features in the cross-statistical, cross-screening, and composite-hyperparameter. C, the representative images of the first two highest weight features of Panc02-H7 MCTS in the cross-statistical, cross-screening, and composite-hyperparameter. RMSE, root mean square error. D, the distribution of collagen within Panc02-H7 MCTS with different ratios of fibroblasts using confocal auto-fluorescence imaging. E, the comparison of collagen percentage within MCTS among different groups.
Fig. 8.
Fig. 8.
Performance of machine learning models in OVCAR-4 MCTS with different drug treatment classifications. A, B, and C, histogram of the accuracy of machine learning models in OVCAR-4 MCTS with 1 µM, 10 µM, and 25 µM 2-ME, AZD, and R-ke. D, E, and F, classification performance of the cross-statistical, cross-screening, and composite-hyperparameter. DT, decision tree. GB, gradient boosting. kNN, k nearest neighbor. LG, logistics. NB, naïve bayes. SVM, support vector machine. AH, agglomerative hierarchical. BC, birch. GM, Gaussian mixture. KM, k means. MBK, mini batch k-means. ST, spectral.
Fig. 9.
Fig. 9.
The statistics and difference of superficial and spatial parameters in OVCAR-4 MCTS with different drug treatments. A, the representative images of the first two highest weight features of OVCAR-4 MCTS in the cross-statistical, cross-screening, and composite-hyperparameter. RMSE, root mean square error. B, the normalized difference of selected features in the cross-statistical, cross-screening, and composite-hyperparameter. C, the absolute difference of selected features in the cross-statistical, cross-screening, and composite-hyperparameter.
Fig. 10.
Fig. 10.
Performance of machine learning models in OVCAR-4 MCTS with different concentration treatment classifications. A, B, and C, histogram of the accuracy of machine learning models in OVCAR-4 MCTS with 1 µM, 10 µM, and 25 µM. D, E, and F, classification performance of the cross-statistical, cross-screening, and composite-hyperparameter. DT, decision tree. GB, gradient boosting. kNN, k nearest neighbor. LG, logistics. NB, naïve bayes. SVM, support vector machine. AH, agglomerative hierarchical. BC, birch. GM, Gaussian mixture. KM, k means. MBK, mini batch k-means. ST, spectral.
Fig. 11.
Fig. 11.
The statistics and difference of superficial and spatial parameters in OVCAR-4 MCTS with different concentration treatments. A, the representative images of the first two highest weight features of OVCAR-4 MCTS in the cross-statistical, cross-screening, and composite-hyperparameter. RMSE, root mean square error. B, the normalized difference of selected features in the cross-statistical, cross-screening, and composite-hyperparameter. C, the absolute difference of selected features in the cross-statistical, cross-screening, and composite-hyperparameter.

Similar articles

Cited by

References

    1. Helmlinger G., Netti P. A., Lichtenbeld H. C., et al. , “Solid stress inhibits the growth of multicellular tumor spheroids,” Nat. Biotechnol. 15(8), 778–783 (1997).10.1038/nbt0897-778 - DOI - PubMed
    1. Hirschhaeuser F., Menne H., Dittfeld C., et al. , “Multicellular tumor spheroids: an underestimated tool is catching up again,” J. Biotechnol. 148(1), 3–15 (2010).10.1016/j.jbiotec.2010.01.012 - DOI - PubMed
    1. Yuhas J. M., Li A. P., Martinez A. O., et al. , “A simplified method for production and growth of multicellular tumor spheroids,” Cancer Res. 37(10), 3639–3643 (1977). - PubMed
    1. Gottfried E., Kunz-Schughart L. A., Andreesen R., et al. , “Brave little world: spheroids as an in vitro model to study tumor-immune-cell interactions,” Cell Cycle 5(7), 691–695 (2006).10.4161/cc.5.7.2624 - DOI - PubMed
    1. Jamieson L. E., Harrison D. J., Campbell C., “Chemical analysis of multicellular tumour spheroids,” Analyst 140(12), 3910–3920 (2015).10.1039/C5AN00524H - DOI - PubMed

LinkOut - more resources