. 2024 Mar 15;15(4):2419-2432.
doi: 10.1364/BOE.520886. eCollection 2024 Apr 1.

High spatiotemporal mapping of cortical blood flow velocity with an enhanced accuracy

Affiliations

High spatiotemporal mapping of cortical blood flow velocity with an enhanced accuracy

Tian Jin et al. Biomed Opt Express. .

Abstract

Cerebral blood flow velocity is one of the most essential parameters related to brain functions and diseases. However, most existing mapping methods suffer from either inaccuracy or lengthy sampling time. In this study, we propose a particle-size-related calibration method to improve the measurement accuracy and a random-access strategy to suppress the sampling time. Based on the proposed methods, we study the long-term progress of cortical vasculopathy and abnormal blood flow caused by glioma, short-term variations of blood flow velocity under different anesthetic depths, and cortex-wide connectivity of the rapid fluctuation of blood flow velocities during seizure onset. The experimental results demonstrate that the proposed calibration method and the random-access strategy can improve both the qualitative and quantitative performance of velocimetry techniques and are also beneficial for understanding brain functions and diseases from the perspective of cerebral blood flow.


Conflict of interest statement

The authors declare no conflicts of interest.

Figures

Fig. 1.
Fig. 1.
Primary test of measuring velocity using correlation spectroscopy. (a) The scheme of simulation for measuring flow velocity; (b) Simulation results of the measured flow velocity versus the fractional ratio between the particle size and waist diameter before and after performing the particle-size-related calibration; (c) The schematic diagram of a microchannel used for in vitro experiment of measuring blood flow velocity; (d) Experimental results of the measured flow velocity versus the preset flow velocity before and after the particle-size-related calibration; (e) In vivo results of measuring blood flow velocity in a mouse brain with single-pixel dwelling times of 0.2 s, 0.1 s, and 0.05 s, respectively. The scale bar in (e) is 0.4 mm.
Fig. 2.
Fig. 2.
Flow chart of the random-access strategy for fast blood flow measurement. (a) A typical image of cerebral vasculature acquired using photoacoustic microscopy; (b) Architectures of the U-net-based deep-learning framework; (c) Quantitative evaluation of three vessel segmentation methods. GT, global thresholding, LT, local thresholding, DL, deep learning; (d) The result of vessel segmentation using deep learning method; (e) Enlarged windows that show detailed information including vessel regions, skeletons, and midpoints. Two windows show the areas marked by dashed boxes in (d); (f) A schematic diagram of the final random-access modality. Figures (a, b) share the same scale bar of 1 mm, and the size of the enlarged windows in (e) is 2.1 × 2.1 mm2. Figures (a, d-f) with the black background show the complete process of random-access modality for blood flow detection.
Fig. 3.
Fig. 3.
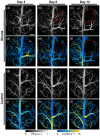
The study of long-term hemodynamic changes during the progress of glioma using the vessel region scanning modality. (a-c) Structural changes of cortical vasculature in a glioma-bearing mouse; (d-f) Changes of blood flow velocity in a glioma-bearing mouse; (g-i) Structural changes of cortical vasculature in a control mouse; (j-l) Changes of blood flow velocity in a control mouse. Orange arrows indicate positions that were injected C6 cells or PBS. Red dashed circles indicate a growing glioma area. All images share the same scale bar of 1 mm.
Fig. 4.
Fig. 4.
The studies of rapid fluctuations of blood flow velocity over the entire cortex using vessel skeleton scanning and vessel midpoint scanning modalities. (a) An original image of a typical cortical vasculature; (b) The skeleton image corresponds to (a); (c) Dynamic changes in cortical blood flow velocity under varying anesthetic states. The red arrows indicate the vessels with significant changes of flow velocity; (d) Statistical results of fluctuations of HbT and blood velocity induced by anesthesia; (e) Seed-based correlation map of a typical seizure case; (f) Velocity fluctuations of typical nodes in the seizure case; (g) Seed-based correlation map of a control case; (h) Velocity fluctuations of specific nodes in a control case. The red arrow indicates the seed pixel, and the white arrows indicate the typical nodes. (a-c) share the same scale bar of 1 mm, and (e, g) share the same scale bar of 1 mm.

Similar articles

References

    1. Wälchli T., Bisschop J., Carmeliet P., et al. , “Shaping the brain vasculature in development and disease in the single-cell era,” Nat. Rev. Neurosci. 24(5), 271–298 (2023).10.1038/s41583-023-00684-y - DOI - PMC - PubMed
    1. Tarasoff-Conway J. M., Carare R. O., Osorio R. S., et al. , “Clearance systems in the brain—implications for Alzheimer disease,” Nat. Rev. Neurol. 11(8), 457–470 (2015).10.1038/nrneurol.2015.119 - DOI - PMC - PubMed
    1. Quick S., Moss J., Rajani R. M., et al. , “A vessel for change: endothelial dysfunction in cerebral small vessel disease,” Trends Neurosci. 44(4), 289–305 (2021).10.1016/j.tins.2020.11.003 - DOI - PubMed
    1. Buxton R. B., Uludağ K., Dubowitz D. J., et al. , “Modeling the hemodynamic response to brain activation,” Neuroimage 23, S220–S233 (2004).10.1016/j.neuroimage.2004.07.013 - DOI - PubMed
    1. Montgomery M. K., Kim S. H., Dovas A., et al. , “Glioma-induced alterations in neuronal activity and neurovascular coupling during disease progression,” Cell Rep. 31(2), 107500 (2020).10.1016/j.celrep.2020.03.064 - DOI - PMC - PubMed

LinkOut - more resources