. 2024 Apr 3:15:1360281.
doi: 10.3389/fimmu.2024.1360281. eCollection 2024.

IMPROVE: a feature model to predict neoepitope immunogenicity through broad-scale validation of T-cell recognition

Affiliations

IMPROVE: a feature model to predict neoepitope immunogenicity through broad-scale validation of T-cell recognition

Annie Borch et al. Front Immunol. .

Abstract

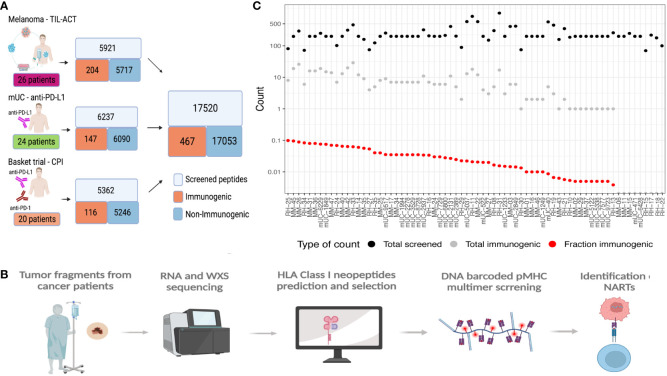
Background: Mutation-derived neoantigens are critical targets for tumor rejection in cancer immunotherapy, and better tools for neoepitope identification and prediction are needed to improve neoepitope targeting strategies. Computational tools have enabled the identification of patient-specific neoantigen candidates from sequencing data, but limited data availability has hindered their capacity to predict which of the many neoepitopes will most likely give rise to T cell recognition.

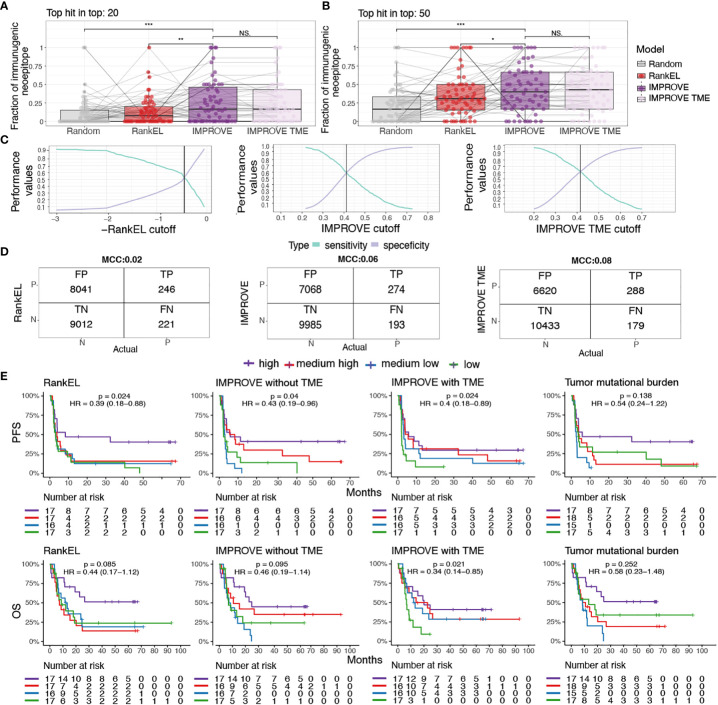
Method: To address this, we make use of experimentally validated T cell recognition towards 17,500 neoepitope candidates, with 467 being T cell recognized, across 70 cancer patients undergoing immunotherapy.

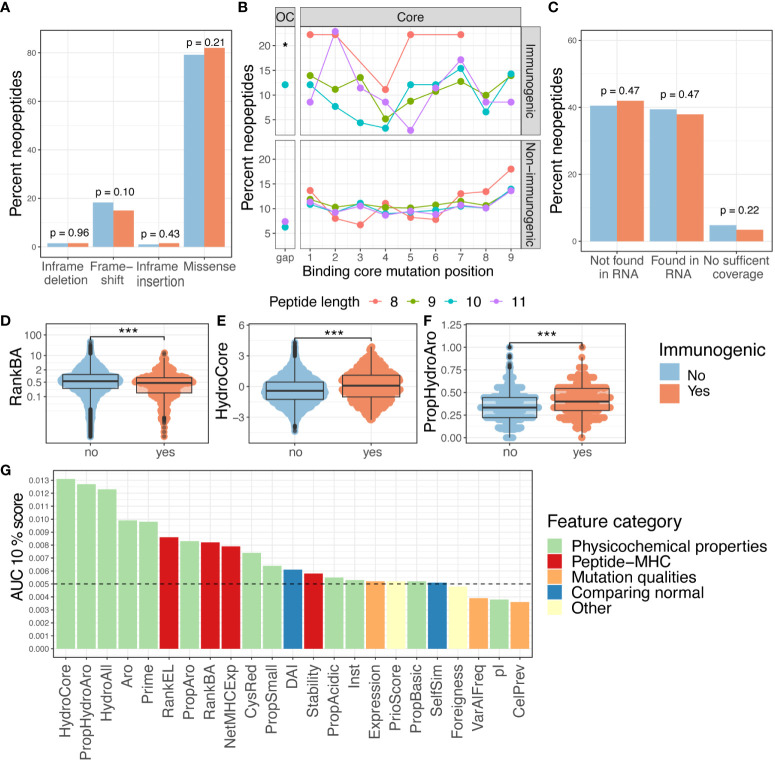
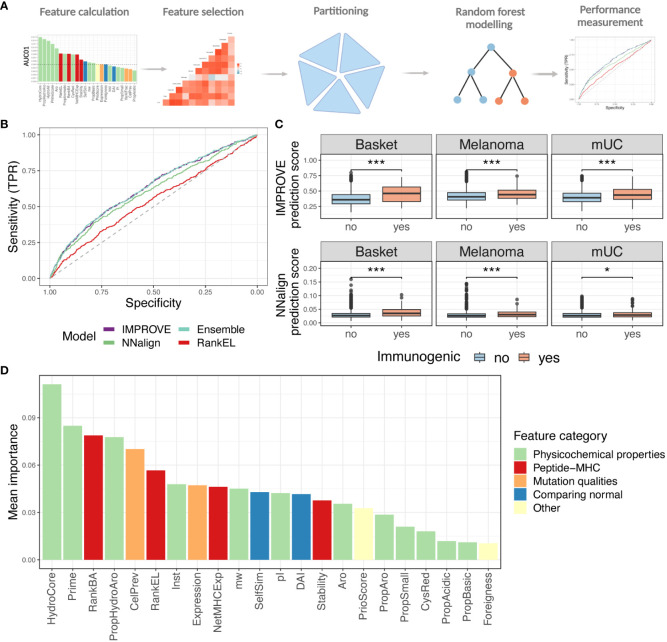
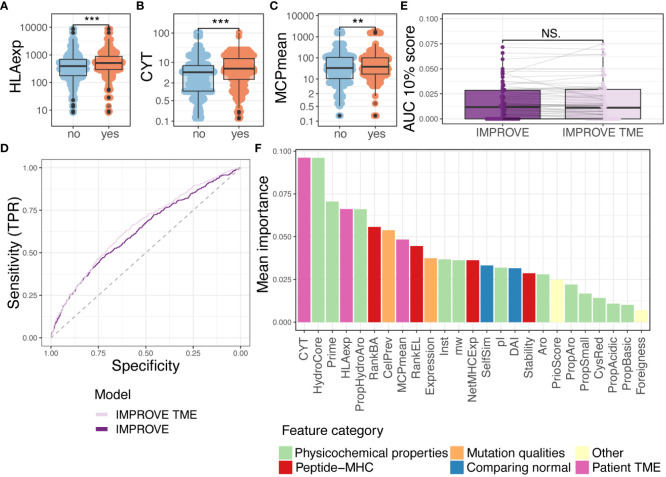
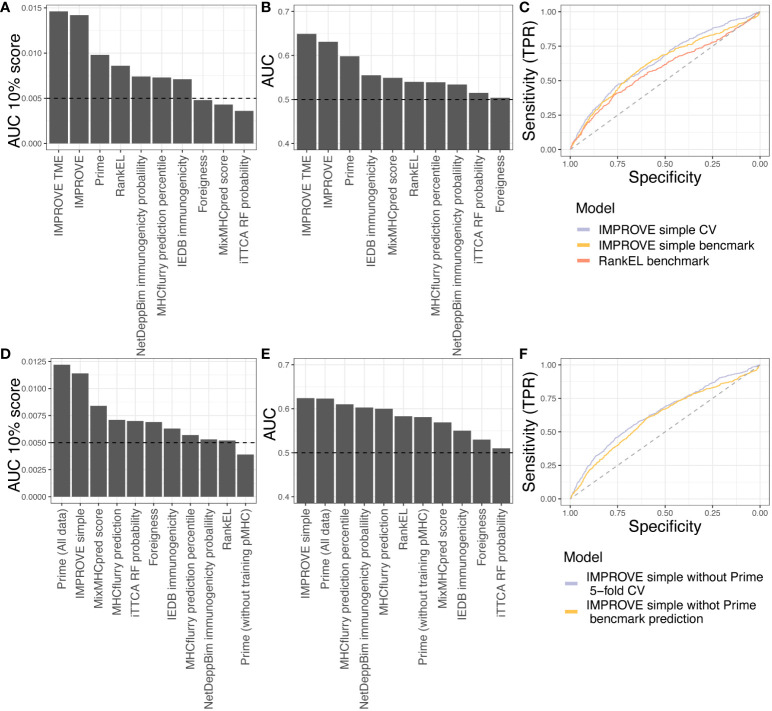
Results: We evaluated 27 neoepitope characteristics, and created a random forest model, IMPROVE, to predict neoepitope immunogenicity. The presence of hydrophobic and aromatic residues in the peptide binding core were the most important features for predicting neoepitope immunogenicity.

Conclusion: Overall, IMPROVE was found to significantly advance the identification of neoepitopes compared to other current methods.

Keywords: immunoinformatics; immunotherapy; machine learning; neoantigen; neoepitope prediction.


Conflict of interest statement

SH is the cofounder of PokeAcell and is the inventor of several licensed patents, however, none of these activities are of relevance to the work presented in this manuscript. The remaining authors declare that the research was conducted in the absence of any commercial or financial relationships that could be construed as a potential conflict of interest.

Figures

Figure 1
Figure 1
Data overview. (A) Data overview illustrating the number of validated peptides for each cohort and the number of patients screened together with a summary of the total amount validated with the number of immunogenic and non-immunogenic neopeptides. (B) General workflow of the data generation, including the patient samples being sequenced and patients’ specific libraries with neoepitope candidates being generated and screened with patients’ samples to find immunogenic neoepitopes. (C) Patient overview according to the number of neoepitopes screened (black dots), immunogenic neoepitopes (gray dots), and fraction immunogenic (red dots). MM, the melanoma cohort; mUC, the mUC cohort; RH, the basket trial cohort.
Figure 2
Figure 2
Features and immunogenicity. (A) Percentage of immunogenic neoepitopes according to the mutation consequence. The p-values were calculated according to the proportion test, testing if the number of immunogenic neoepitopes for each mutation type was present in a higher fraction compared to the non-immunogenic ones. (B) Fraction of immunogenic neoepitope for all missense mutations according to peptide position and peptide length. The gap position represents the peptide outside the core (OC) and is significantly enriched for neopeptides with a length of 10 (p = 0.01, prop.test). The neopeptides are separated into immunogenic and non-immunogenic neopeptides. (C) Percent of immunogenic and non-immunogenic neopeptides where the mutation was validated in RNA. A proportion test was performed to evaluate the proportion of immunogenic neoepitopes in the different categories. (D–F) Boxplot comparing the non-immunogenic form immunogenic neopeptides for four selected features; statistics by Wilcoxon test. (D) Peptide–MHC binding affinity (RankBA) p = 8.9·10-9. (E) Hydrophobicity only in the core of the peptide (HydroCore) p = 1.6·10-12. (F) Proportion of hydrophobic and aromatic residues in the peptide (PropHydroAro) p = < 2.22·10-16. (G) Performance with the partial AUC 10% for each feature with continuous values independently colored by feature type. p values < 0.05 = *; p values < 0.001 = ***.
Figure 3
Figure 3
Random forest modeling. (A) Strategy of the machine learning approach with feature selection, partitioning, and modeling. (B) ROC curve with the IMPROVE model in purple (AUC = 0.630 and AUC01 = 0.0139), which performs significantly better than the NNAlign in green (AUC = 0.605 and AUC01 = 0.0131) (p = 0.039, roc.test) and RankEL (AUC = 0.539 and AUC01 = 0.0086) (p = 4.3-6). An Ensemble model of NNAlign and IMPROVE was also made, resulting in a similar performance as IMPROVE (0.631 and AUC01 = 0.0139), marked in a light blue line. (C) Prediction score from the NNAlign model at the top and IMPROVE model at the bottom according to the immunogenic and non-immunogenic peptide split by cohort. The IMPROVE model had significant separation in all three cohorts, with p-values of 1.6-9, 2.3-6, and 7.1-6 for the three cohorts. All with non-paired Wilcoxon test. The NNAlign model obtained significant separation in basket trial (p = 1.0-10, Wilcoxon test) and melanoma (p = 3.8-7, Wilcoxon test) and for the mUC cohort (p = 0.019). (D) Mean feature importance for the IMPROVE model colored by the feature category. p values < 0.05 = *; p values < 0.001 = ***.
Figure 4
Figure 4
Random forest with tumor microenvironment (TME) parameters. (A–C) Comparing immunogenic with non-immunogenic neoepitopes for features. Statistics made using Wilcoxon test and Bonferroni-adjusted p-values. (A) HLA expression (HLAexp) p = 2.7-15. (B) Cytolytic activity (CYT) p = 9.3-10. (C) Mean of MCP-counter populations (MCPmean) p = 0.0075. (D) ROC curve illustrating the two IMPROVE models. The IMPROVE model without TME features in dark purple (AUC = 0.630 and AUC01 = 0.0139) and IMPROVE with TME features in light purple (AUC = 0.652 and AUC01 = 0.0145). IMPROVE TME is significantly better than IMPROVE (p = 0.01, roc.test). (E) The partial AUC 10% per patient for the two models and statistics made using paired Wilcoxon test (p = 0.95). (F) Mean feature importance for the IMPROVE with TME features colored by the feature type. p values < 0.01 = **; p values < 0.001 = ***; p-values > 0.5 = NS.
Figure 5
Figure 5
Patient performance and survival. (A, B) The fraction of immunogenic neoepitopes in the top 20 and top 50 neoepitope candidates of the IMPROVE model (dark purple) and the IMPROVE TME (light purple), with red indicating eluted ligand % Rank and gray indicating randomly sampled peptides. (A) Top 20 neopeptides IMPROVE vs. RankEL (p = 0.0023), IMPROVE vs. random (p = 8.2-5), and IMPROVE vs. IMPROVE TME (p = 0.64). (B) Top 50 neopeptides IMPROVE vs. RankEL (p = 0.03), IMPROVE vs. random (p = 1.8-5), and IMPROVE vs. IMPROVE TME (p = 0.71). (C) Sensitivity and specificity calculated for the cutoff where the point the curve crosses defines the set cutoff of what is predicted to be immunogenic and non-immunogenic. (D) Confusion matrix with cutoff where the sensitivity and specificity cross. The left image shows RankEL according to the pre-selected neoepitopes with expression above 0.01. The middle image shows the IMPROVE model without TME, and the confusion matrix on the right image is the IMPROVE model with TME features included, with the defined threshold found in panel (C). (E) Kaplan–Meier curves showing all predicted neopeptides with a threshold of RankEL< 2 and Expression > 0.01, which included predicted neoepitopes that were not screened, for example, HLA alleles that were not available and neopeptides for patients selected with a more restricted threshold. The survival analysis was made for the three categories described in the confusion matrix. The patients were separated into four groups according to the number of predicted neoepitopes above the defined threshold. The four groups were determined according to the quantile, where “high” is above the third quantile, and “medium high” is between the second and third quantiles. “Medium low” is between the second and first quantiles, and low is below the first quantile. The threshold for predicted neoepitopes was set to where the sensitivity and specificity cross as shown in panel (C) and was also the threshold used in the confusion matrix. (Left) RankEL. (Middle left) The IMPROVE model without TME. (Middle right) The IMPROVE model with TME. (Right) The tumor mutational burden (TMB). p values < 0.05 = *; p values < 0.01 = **; p values < 0.001 = ***; p-values > 0.5 = NS.
Figure 6
Figure 6
Benchmark data. (A, B) Testing the in-house dataset used to train IMPROVE with other available tools. (A) Performance according to the partial AUC 10%. (B) Performance according to AUC. (C) A simple IMPROVE model was generated using cross-validation, referred to as CV, taking features only by knowing the mutated peptide, corresponding WT peptide, and the HLA allele. This only excluded the Priority Score and cellular prevalence from the original IMPROVE model without TME. This IMPROVE simple model resulted in a performance of AUC = 0.643 and AUC01 = 0.0134 and is marked in light blue. The IMPROVE simple model to predict immunogenicity from the benchmark from CEDAR data performed only a bit worse than the IMPROVE simple model and is marked in yellow (AUC = 0.625 and AUC01 = 0.0102). The prediction of the CEDAR benchmark data using IMPROVE performed significantly better (p = 0.0038, roc.test) than RankEL as colored in red (AUC = 0.586 and AUC01 = 0.0094). (D, E) Testing the CEDAR dataset using other available tools. (D) Performance according to the partial AUC 10%. (E) Performance according to AUC. (F) Retraining of IMPROVE simple model without Prime feature (purple), resulting in AUC = 0.64 and AUC01 = 0.0135, and predicting CEDAR data with the IMPROVE simple model without Prime (yellow), resulting in AUC = 0.61 and AUC01 = 0.0104.

References

    1. Gibney GT, Weiner LM, Atkins MB. Predictive biomarkers for checkpoint inhibitor-based immunotherapy. Lancet Oncol. (2016) 17(12):e542–51. doi: 10.1016/S1470-2045(16)30406-5 - DOI - PMC - PubMed
    1. Goodman AM, Kato S, Bazhenova L, Patel SP, Frampton GM, Miller V, et al. . Companion diagnostic, pharmacogenomic, and cancer biomarkers tumor mutational burden as an independent predictor of response to immunotherapy in diverse cancers. Mol Cancer Ther. (2017) 16(11):2598–608. doi: 10.1158/1535-7163.MCT-17-0386 - DOI - PMC - PubMed
    1. Cristescu R, Aurora-Garg D, Albright A, Xu L, Liu XQ, Loboda A, et al. . Tumor mutational burden predicts the efficacy of pembrolizumab monotherapy: A pan-tumor retrospective analysis of participants with advanced solid tumors. J Immunother Cancer. (2022) 10(1). doi: 10.1136/jitc-2021-003091 - DOI - PMC - PubMed
    1. Linette GP, Carreno BM. Neoantigen vaccines pass the immunogenicity test. Trends Mol Med. (2017) 23(10):869–71. doi: 10.1016/j.molmed.2017.08.007 - DOI - PMC - PubMed
    1. Kristensen NP, Heeke C, Tvingsholm SA, Borch A, Draghi A, Crowther MD, et al. . Neoantigen-reactive CD8+ T cells affect clinical outcome of adoptive cell therapy with tumor-infiltrating lymphocytes in melanoma. J Clin Invest. (2022) 132(2). doi: 10.1172/JCI150535 - DOI - PMC - PubMed