

A compact setup for behavioral studies measuring limb acceleration
- PMID: 38633334
- PMCID: PMC11022083
- DOI: 10.1016/j.ohx.2024.e00522
A compact setup for behavioral studies measuring limb acceleration
Abstract
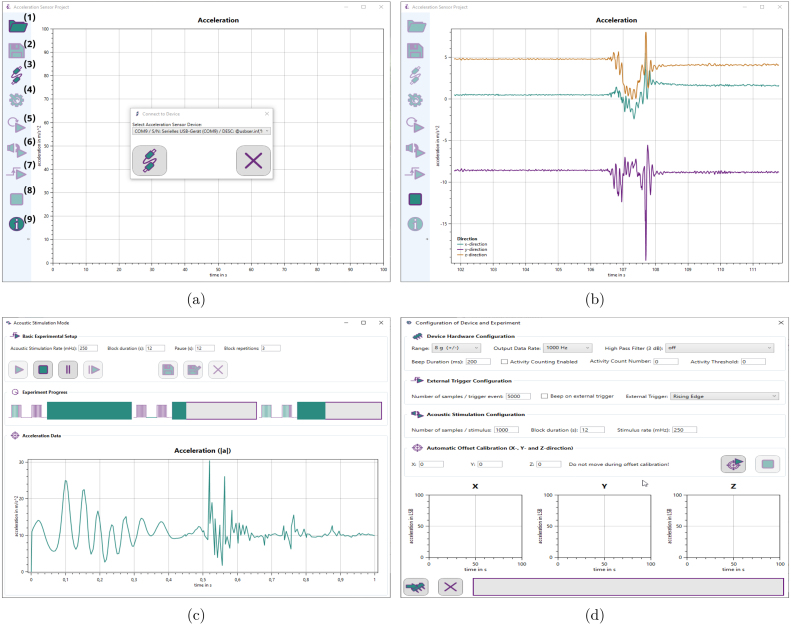
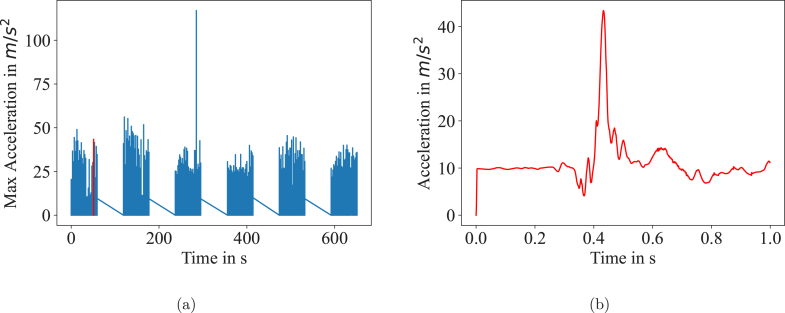
Behavioral studies contribute largely to a broader understanding of human brain mechanisms and the process of learning and memory. An established method to quantify motor learning is the analysis of thumb activity. In combination with brain stimulation, the effect of various treatments on neural plasticity and motor learning can be assessed. So far, the setups for thumb abduction measurements employed consist of bulky amplifiers and digital-to-analog devices to record the data. We developed a compact hardware setup to measure acceleration data which can be integrated into a wearable, including a sensor board and a microcontroller board which can be connected to a PC via USB. Additionally, we provide two software packages including graphical user interfaces, one to communicate with the hardware and one to evaluate and process the data. This work demonstrates the construction and application of our setup at the example of thumb acceleration measurement with a custom made glove and its use for research. Using integrated circuits, the size of the measurement devices is reduced to this wearable. It is simple to construct and can be operated easily by non-technical staff.
Keywords: Acceleration; Neural plasticity; Thumb movement.
© 2024 The Author(s).
Conflict of interest statement
The authors declare the following financial interests/personal relationships which may be considered as potential competing interests: Jonathan Rapp reports financial support was provided by German Research Foundation. If there are other authors, they declare that they have no known competing financial interests or personal relationships that could have appeared to influence the work reported in this paper.
Figures


Similar articles
-
High Density Resistive Array Readout System for Wearable Electronics.Sensors (Basel). 2022 Feb 27;22(5):1878. doi: 10.3390/s22051878. Sensors (Basel). 2022. PMID: 35271023 Free PMC article.
-
A Wearable-Sensor System with AI Technology for Real-Time Biomechanical Feedback Training in Hammer Throw.Sensors (Basel). 2022 Dec 30;23(1):425. doi: 10.3390/s23010425. Sensors (Basel). 2022. PMID: 36617025 Free PMC article.
-
Recording human electrocorticographic (ECoG) signals for neuroscientific research and real-time functional cortical mapping.J Vis Exp. 2012 Jun 26;(64):3993. doi: 10.3791/3993. J Vis Exp. 2012. PMID: 22782131 Free PMC article.
-
Neuromorphic hardware databases for exploring structure-function relationships in the brain.Philos Trans R Soc Lond B Biol Sci. 2001 Aug 29;356(1412):1249-58. doi: 10.1098/rstb.2001.0904. Philos Trans R Soc Lond B Biol Sci. 2001. PMID: 11545701 Free PMC article. Review.
-
Review of Wearable Devices and Data Collection Considerations for Connected Health.Sensors (Basel). 2021 Aug 19;21(16):5589. doi: 10.3390/s21165589. Sensors (Basel). 2021. PMID: 34451032 Free PMC article. Review.
References
-
- Walther Michael, Kuhnke Nicola, Schessl Joachim, Delvendahl Igor, Jung Nikolai, Kreml Dirk, Ziemann Ulf, Mall Volker. Deafferentation of neighbouring motor cortex areas does not further enhance saturated practice-dependent plasticity in healthy adults. Clin. Neurophysiol. : Official J. Int. Federation Clin. Neurophysiol. 2008;119(4):886–891. doi: 10.1016/j.clinph.2007.12.006. - DOI - PubMed
-
- Teo James T.H., Swayne Orlando B.C., Cheeran Binith, Greenwood Richard J., Rothwell John C. Human theta burst stimulation enhances subsequent motor learning and increases performance variability. Cerebral Cortex (New York, N.Y. : 1991) 2011;21(7):1627–1638. doi: 10.1093/cercor/bhq231. - DOI - PubMed
LinkOut - more resources
Full Text Sources
