

Development of a membrane-disruption assay using phospholipid vesicles as a proxy for the detection of cellular membrane degradation
- PMID: 38633504
- PMCID: PMC11021370
- DOI: 10.1016/j.toxcx.2024.100197
Development of a membrane-disruption assay using phospholipid vesicles as a proxy for the detection of cellular membrane degradation
Abstract
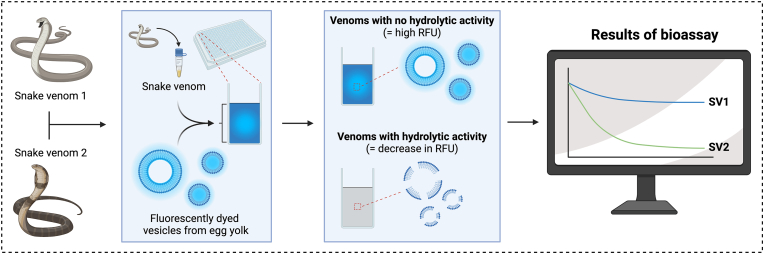
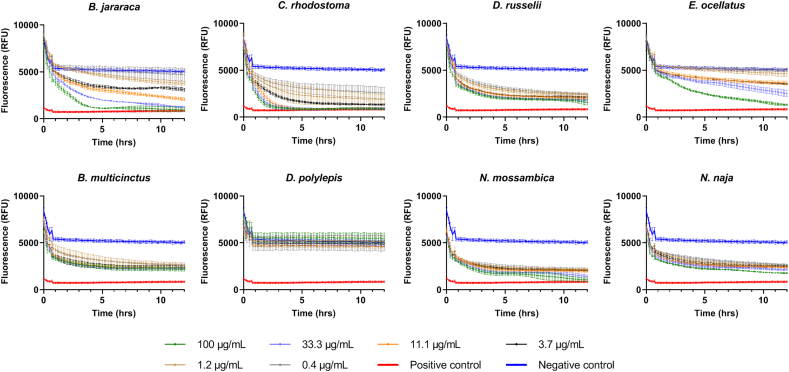
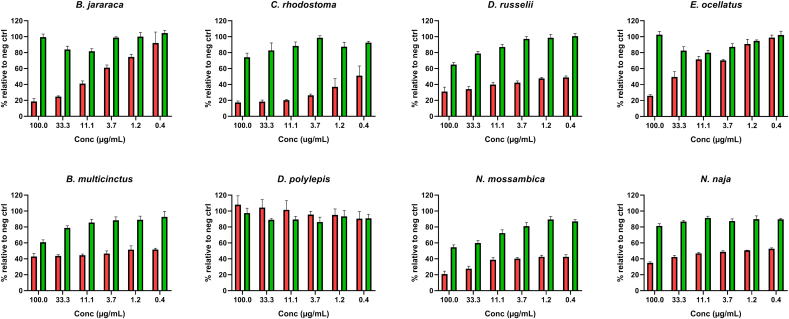
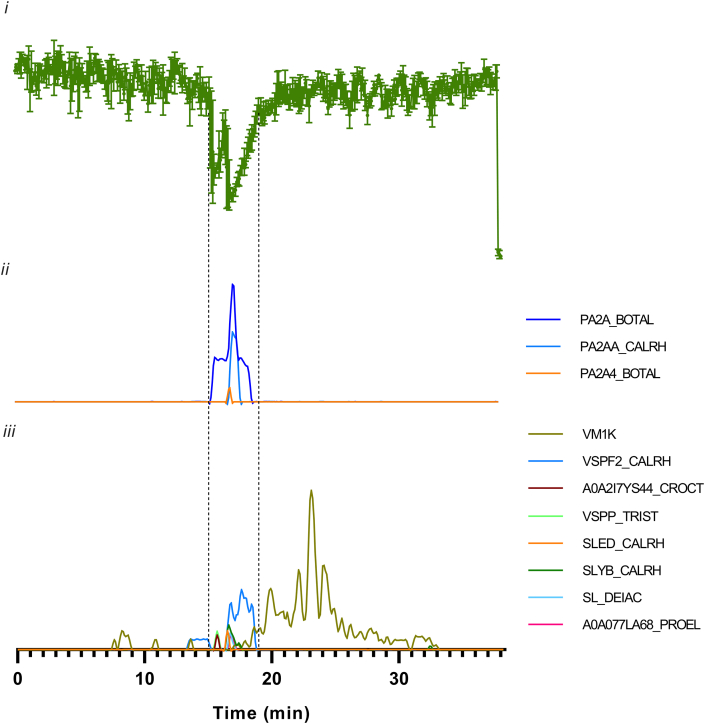
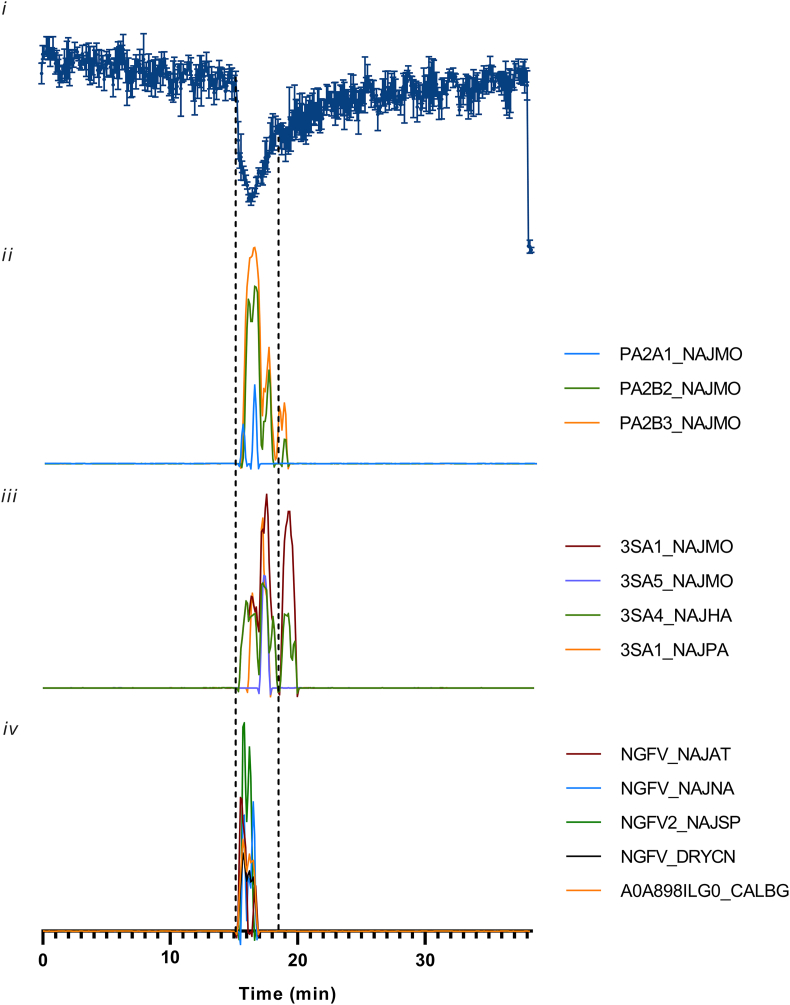
Snakebite envenoming is a global health issue that affects millions of people worldwide, and that causes morbidity rates surpassing 450,000 individuals annually. Patients suffering from snakebite morbidities may experience permanent disabilities such as pain, blindness and amputations. The (local) tissue damage that causes these life-long morbidities is the result of cell- and tissue-damaging toxins present in the venoms. These compounds belong to a variety of toxin classes and may affect cells in various ways, for example, by affecting the cell membrane. In this study, we have developed a high-throughput in vitro assay that can be used to study membrane disruption caused by snake venoms using phospholipid vesicles from egg yolk as a substrate. Resuspended chicken egg yolk was used to form these vesicles, which were fluorescently stained to allow monitoring of the degradation of egg yolk vesicles on a plate reader. The assay proved to be suitable for studying phospholipid vesicle degradation of crude venoms and was also tested for its applicability for neutralisation studies of varespladib, which is a PLA2 inhibitor. We additionally made an effort to identify the responsible toxins using liquid chromatography, followed by post-column bioassaying and protein identification using high-throughput venomics. We successfully identified various toxins in the venoms of C. rhodostoma and N. mossambica, which are likely to be involved in the observed vesicle-degrading effect. This indicates that the assay can be used for screening the membrane degrading activity of both crude and fractionated venoms as well as for neutralisation studies.
Keywords: Cell membrane; Cytotoxicity; Envenoming; Phospholipase; Snakebite; Toxin.
© 2024 The Author(s).
Conflict of interest statement
The authors declare that they have no known competing financial interests or personal relationships that could have appeared to influence the work reported in this paper.
Figures

Similar articles
-
Development of a high-throughput in vitro screening method for the assessment of cell-damaging activities of snake venoms.PLoS Negl Trop Dis. 2023 Aug 17;17(8):e0011564. doi: 10.1371/journal.pntd.0011564. eCollection 2023 Aug. PLoS Negl Trop Dis. 2023. PMID: 37590328 Free PMC article.
-
Application of an Extracellular Matrix-Mimicking Fluorescent Polymer for the Detection of Proteolytic Venom Toxins.Toxins (Basel). 2023 Apr 18;15(4):294. doi: 10.3390/toxins15040294. Toxins (Basel). 2023. PMID: 37104232 Free PMC article.
-
Monitoring Snake Venom-Induced Extracellular Matrix Degradation and Identifying Proteolytically Active Venom Toxins Using Fluorescently Labeled Substrates.Biology (Basel). 2023 May 24;12(6):765. doi: 10.3390/biology12060765. Biology (Basel). 2023. PMID: 37372050 Free PMC article.
-
Unresolved issues in the understanding of the pathogenesis of local tissue damage induced by snake venoms.Toxicon. 2018 Jun 15;148:123-131. doi: 10.1016/j.toxicon.2018.04.016. Epub 2018 Apr 23. Toxicon. 2018. PMID: 29698755 Review.
-
Pharmacological re-assessment of traditional medicinal plants-derived inhibitors as antidotes against snakebite envenoming: A critical review.J Ethnopharmacol. 2022 Jun 28;292:115208. doi: 10.1016/j.jep.2022.115208. Epub 2022 Mar 18. J Ethnopharmacol. 2022. PMID: 35314419 Review.
Cited by
-
Macrovipera lebetinus obtusa Venom and Its Fractions Affect Human Dermal Microvascular Endothelial and Fibrosarcoma Cells.Int J Mol Sci. 2025 Apr 11;26(8):3601. doi: 10.3390/ijms26083601. Int J Mol Sci. 2025. PMID: 40332122 Free PMC article.
References
-
- Alberts B., Hopkin K., Johnson A.D., Morgan D., Raff M., Roberts K., et al. WW Norton & Company; 2018. Essential Cell Biology: Fifth International Student Edition.
-
- Uniprot. P01467 · 3SA1_NAJMO · Cytotoxin 1. [cited 14 Jul 2023]. Available: https://www.uniprot.org/uniprotkb/P01467/entry.
-
- Bénard-Valle M., Neri-Castro E.E., Fry B.G., Boyer L., Cochran C., Alam M., et al. In: Venomous Reptiles and Their Toxins: Evolution, Pathophysiology and Biodiscovery. Fry B.G., editor. Oxford University Press; New York, NY, USA: 2015. Antivenom research and development; pp. 61–72.
LinkOut - more resources
Full Text Sources
