

EEPD1 is identified as a predictor of prognosis and immune microenvironment through pan-cancer analysis and related to progression of colorectal cancer
- PMID: 38633650
- PMCID: PMC11021989
- DOI: 10.1016/j.heliyon.2024.e29285
EEPD1 is identified as a predictor of prognosis and immune microenvironment through pan-cancer analysis and related to progression of colorectal cancer
Abstract
Background: EEPD1 is vital in homologous recombination, while its role in cancer remains unclear.
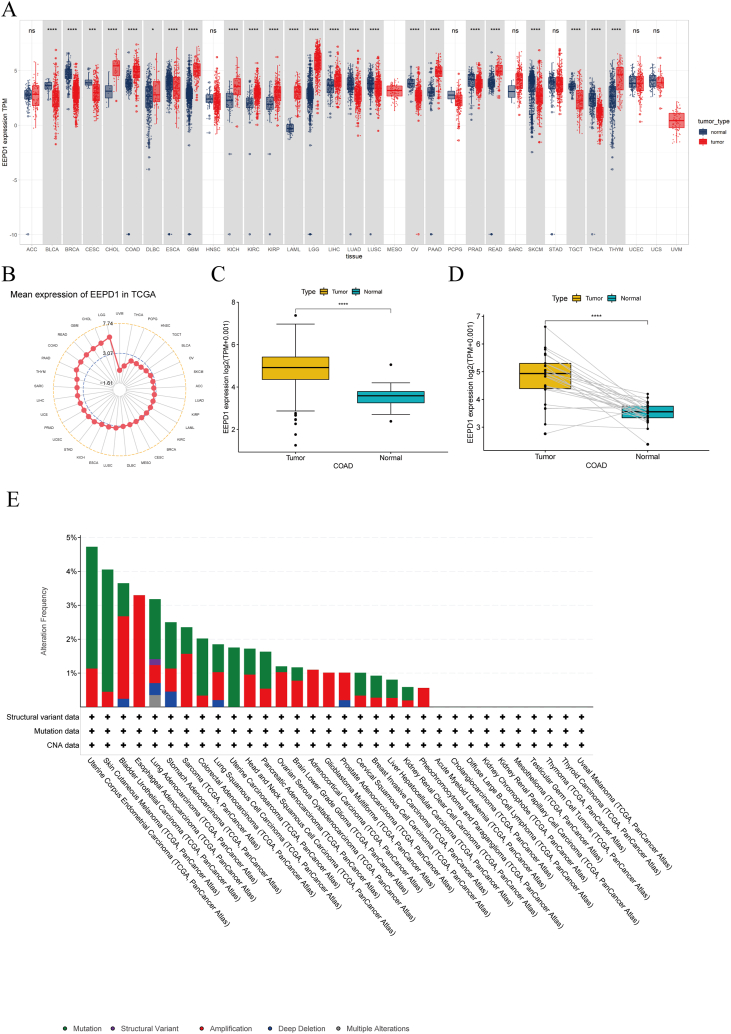
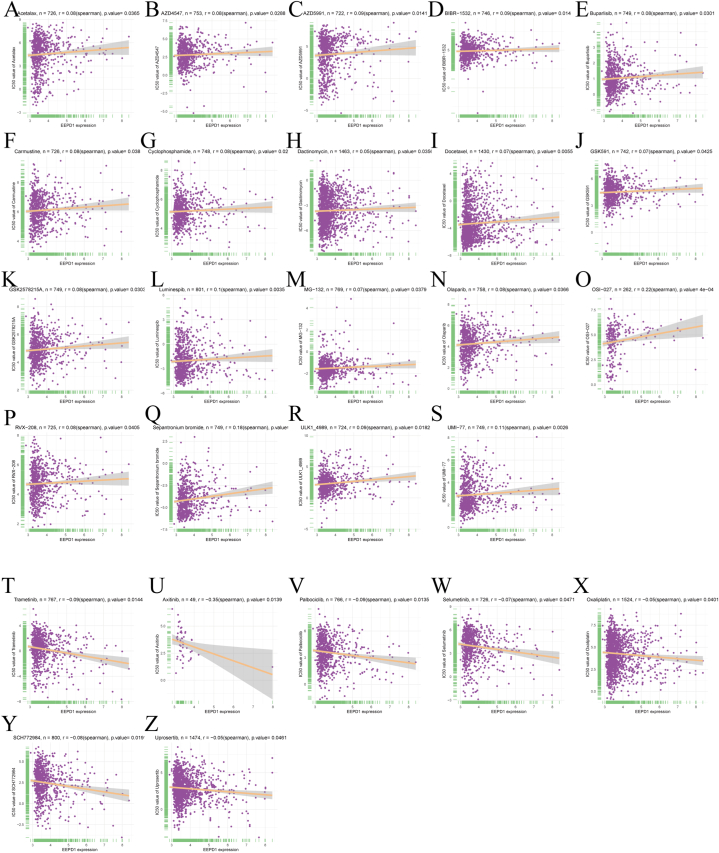
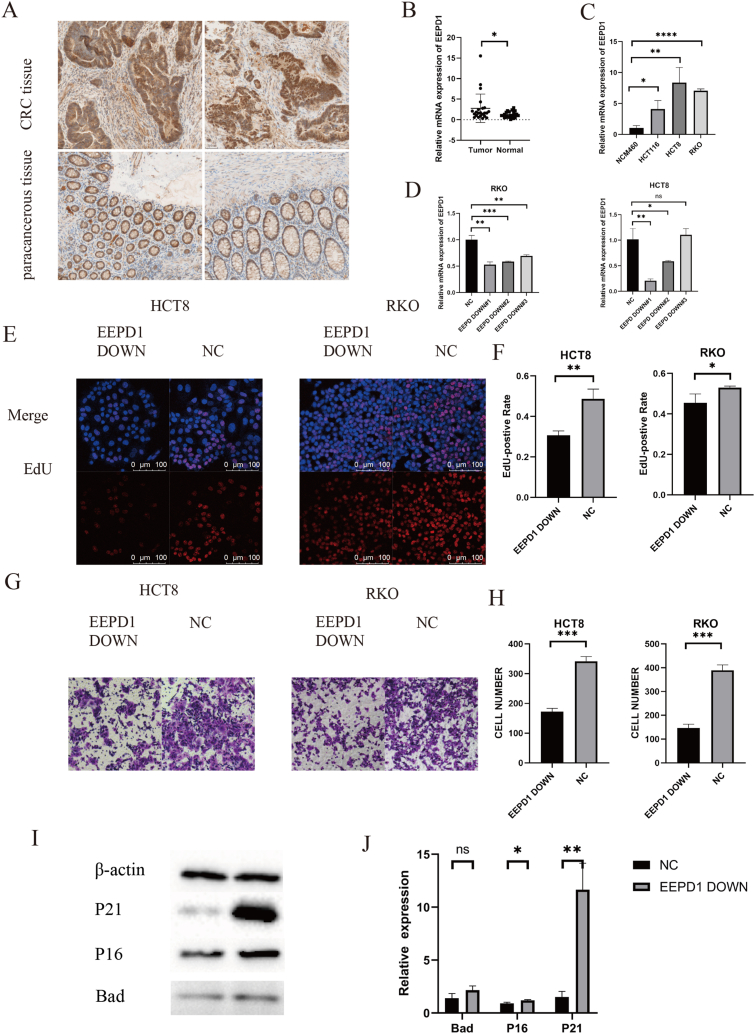
Methods: We performed multiple pan-cancer analyses of EEPD1 with bioinformatics methods, such as gene expression, gene alterations, Prognosis and enrichment analysis, tumor microenvironment, immune cell infiltration, TMB, MSI, immunotherapy, co-expression of genes, and drug resistance. Finally, RT-qPCR, EdU, and transwell assays helped investigate the impact of EEPD1 on CRC cells.
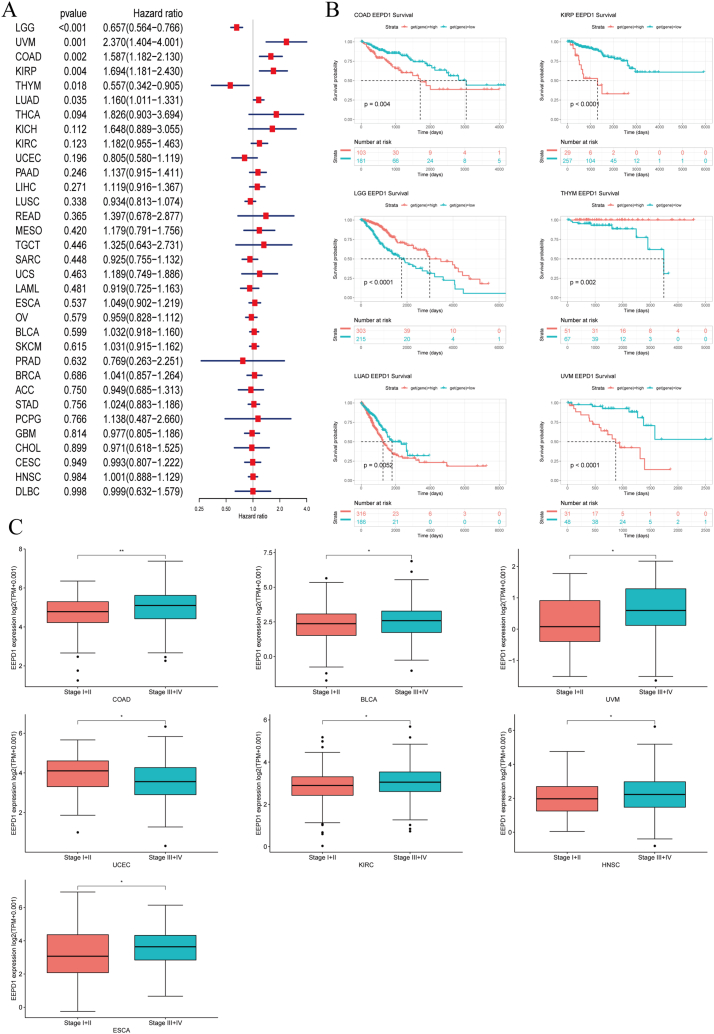
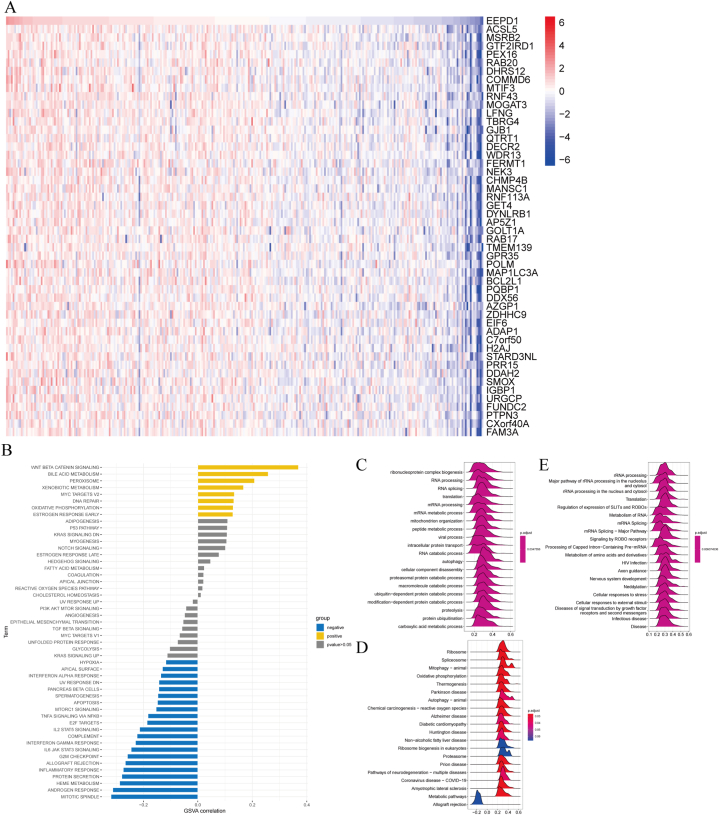
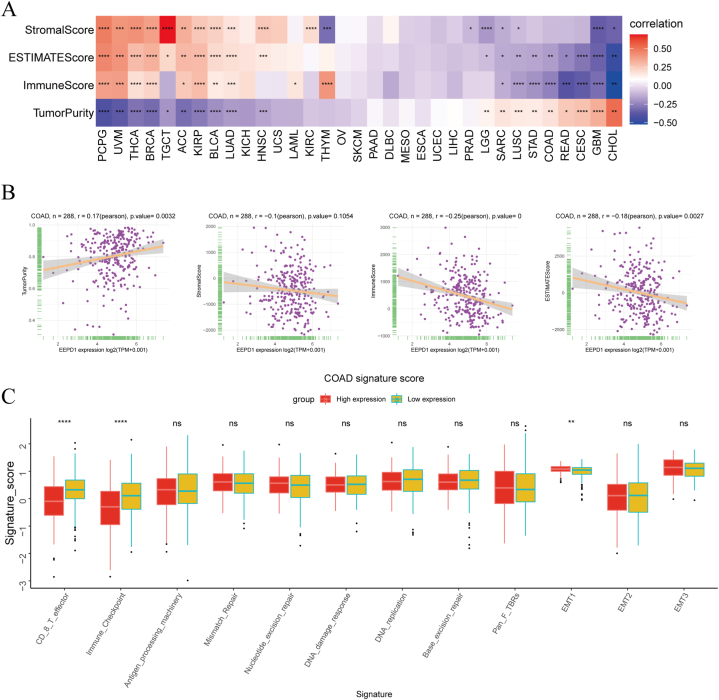
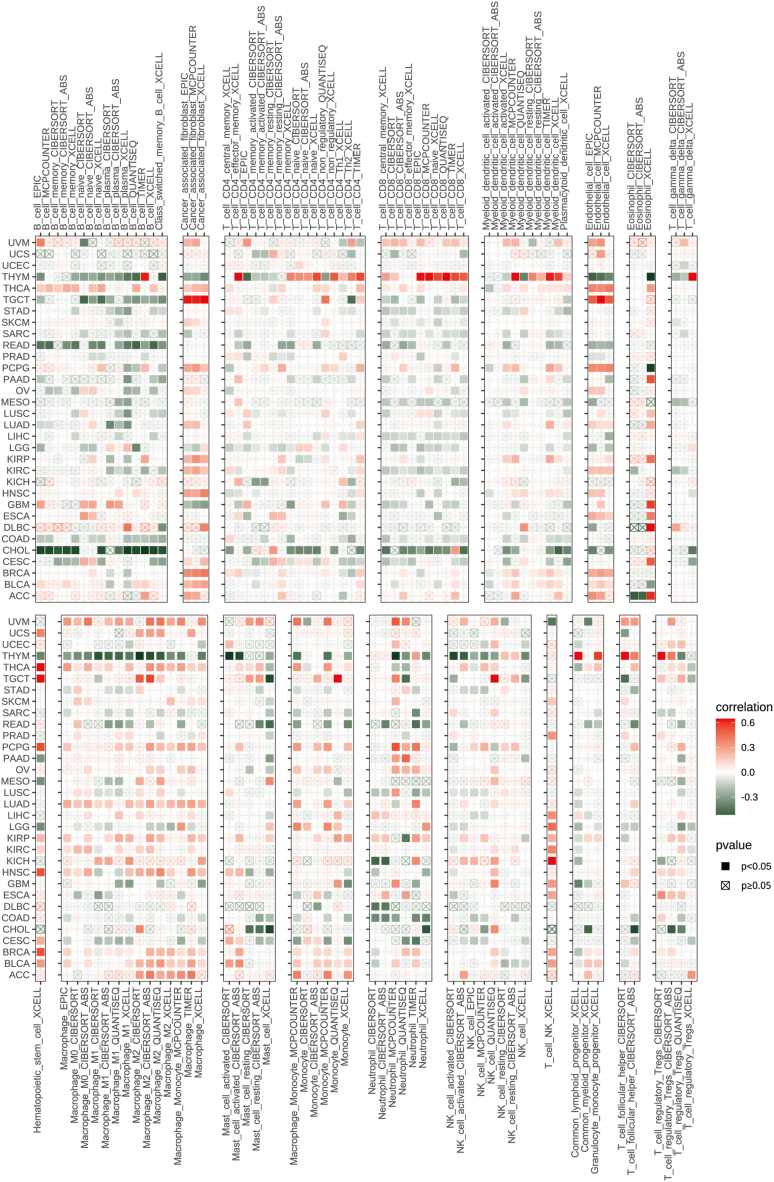
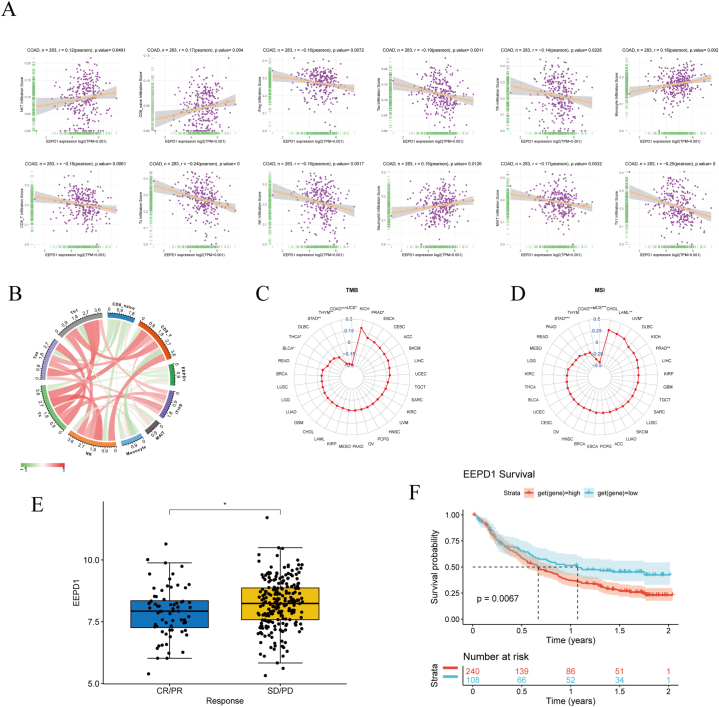
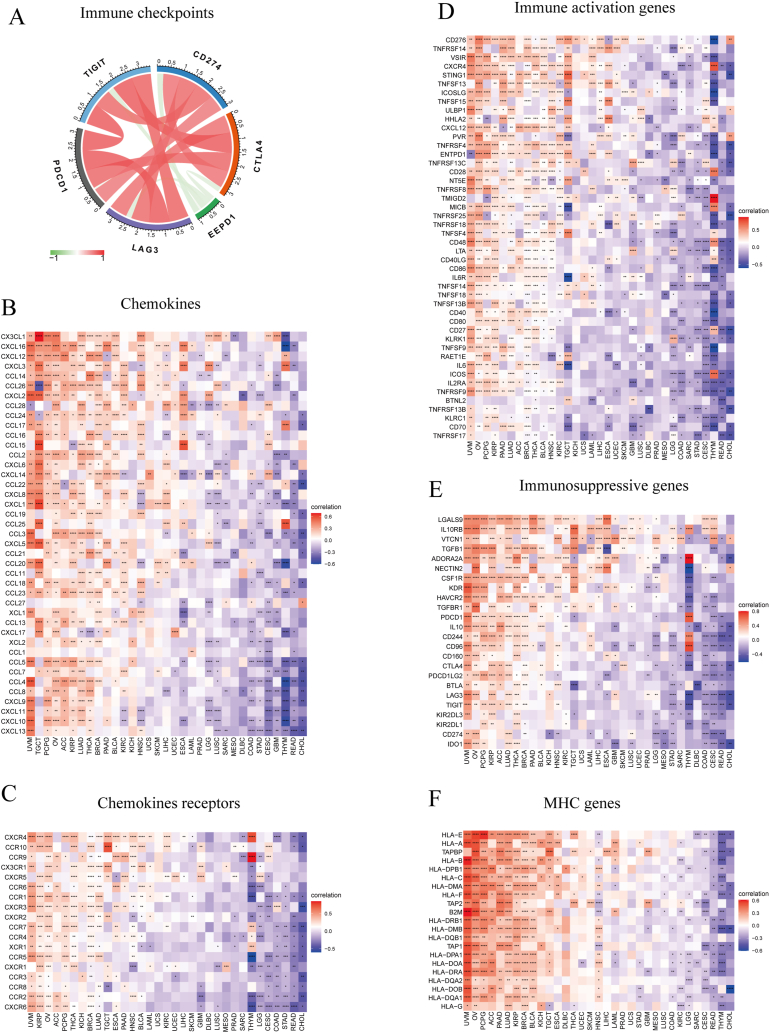
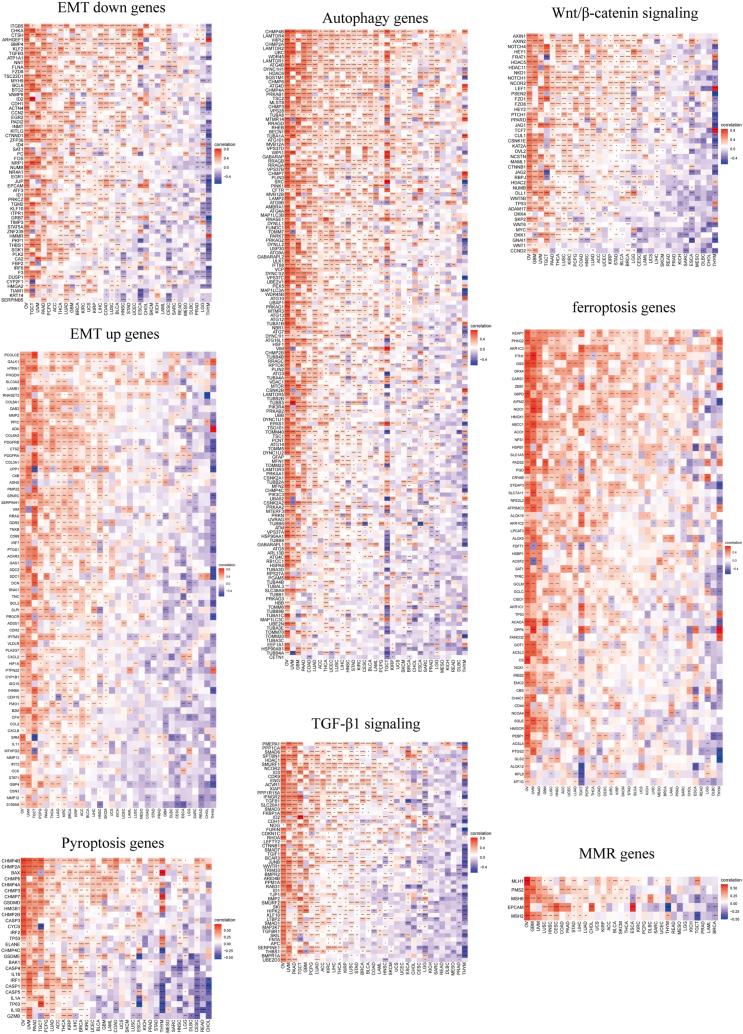
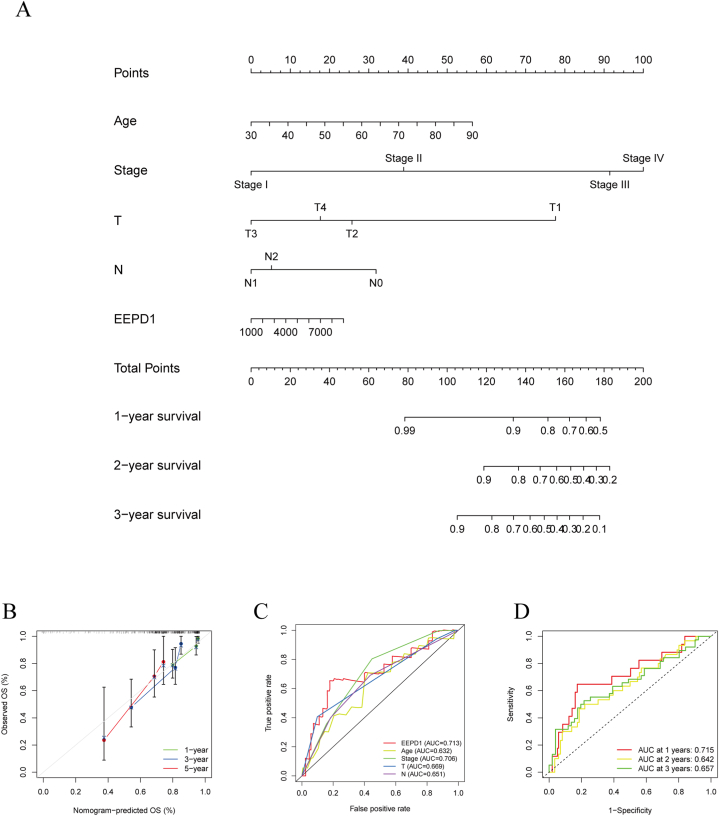
Results: EEPD1 was dysregulated and correlated with bad prognosis in several cancers. GSVA and GSEA revealed that EEPD1 was primarily associated with the "WNT_BETA_CATENIN_SIGNALING," "ribonucleoprotein complex biogenesis," "Ribosome," and "rRNA processing." The infiltration of CD8+ T cells, MAIT cells, iTreg cells, NK cells, Tc cells, Tex cells, Tfh cells, and Th1 cells were negatively correlated with EEPD1 expression. Additionally, EEPD1 is significantly associated with TMB and MSI in COAD, while enhanced CRC cell proliferation and migration.
Conclusions: EEPD1 was dysregulated in human cancers and correlated with various cancer patient prognoses. The dysregulated EEPD1 expression can affect tumor-infiltrating immune cells and immunotherapy response. Therefore, EEPD1 could act as an oncogene associated with immune cell infiltration in CRC.
Keywords: CRC; Cell migration; Cell proliferation; EEPD1; Immune infiltration.
© 2024 The Authors.
Conflict of interest statement
The authors declare that they have no known competing financial interests or personal relationships that could have appeared to influence the work reported in this paper.
Figures
Similar articles
-
HHLA2 Used as a Potential Prognostic and Immunological Biomarker and Correlated with Tumor Microenvironment in Pan-Cancer.Biomed Res Int. 2022 Feb 23;2022:3924400. doi: 10.1155/2022/3924400. eCollection 2022. Biomed Res Int. 2022. Retraction in: Biomed Res Int. 2024 Mar 20;2024:9789013. doi: 10.1155/2024/9789013. PMID: 35252444 Free PMC article. Retracted.
-
AP3S1 is a Novel Prognostic Biomarker and Correlated With an Immunosuppressive Tumor Microenvironment in Pan-Cancer.Front Cell Dev Biol. 2022 Jul 8;10:930933. doi: 10.3389/fcell.2022.930933. eCollection 2022. Front Cell Dev Biol. 2022. PMID: 35874816 Free PMC article.
-
A comprehensively prognostic and immunological analysis of actin-related protein 2/3 complex subunit 5 in pan-cancer and identification in hepatocellular carcinoma.Front Immunol. 2022 Sep 6;13:944898. doi: 10.3389/fimmu.2022.944898. eCollection 2022. Front Immunol. 2022. PMID: 36148220 Free PMC article.
-
Comprehensive Analysis of KREMEN2 as an Immunotherapeutic and Prognostic Biomarker in Pan-Cancer.Anticancer Res. 2023 Oct;43(10):4491-4509. doi: 10.21873/anticanres.16643. Anticancer Res. 2023. PMID: 37772558
-
Pan-cancer evidence of prognosis, immune infiltration, and immunotherapy efficacy for annexin family using multi-omics data.Funct Integr Genomics. 2023 Jun 26;23(3):211. doi: 10.1007/s10142-023-01106-z. Funct Integr Genomics. 2023. PMID: 37358720
References
-
- Sung H., Ferlay J., Siegel R.L., Laversanne M., Soerjomataram I., Jemal A., Bray F. Global cancer statistics 2020: GLOBOCAN estimates of incidence and mortality worldwide for 36 cancers in 185 countries. CA A Cancer J. Clin. 2021;71(3):209–249. - PubMed
LinkOut - more resources
Full Text Sources
Research Materials
