Utilizing GO/PEDOT:PSS/PtNPs-enhanced high-stability microelectrode arrays for investigating epilepsy-induced striatal electrophysiology alterations
- PMID: 38633666
- PMCID: PMC11022210
- DOI: 10.3389/fbioe.2024.1376151
Utilizing GO/PEDOT:PSS/PtNPs-enhanced high-stability microelectrode arrays for investigating epilepsy-induced striatal electrophysiology alterations
Abstract
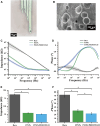
The striatum plays a crucial role in studying epilepsy, as it is involved in seizure generation and modulation of brain activity. To explore the complex interplay between the striatum and epilepsy, we engineered advanced microelectrode arrays (MEAs) specifically designed for precise monitoring of striatal electrophysiological activities in rats. These observations were made during and following seizure induction, particularly three and 7 days post-initial modeling. The modification of graphene oxide (GO)/poly (3,4-ethylenedioxythiophene):polystyrene sulfonate (PEDOT:PSS)/platinu-m nanoparticles (PtNPs) demonstrated a marked reduction in impedance (10.5 ± 1.1 kΩ), and maintained exceptional stability, with impedance levels remaining consistently low (23 kΩ) even 14 days post-implantation. As seizure intensity escalated, we observed a corresponding increase in neuronal firing rates and local field potential power, with a notable shift towards higher frequency peaks and augmented inter-channel correlation. Significantly, during the grand mal seizures, theta and alpha bands became the dominant frequencies in the local field potential. Compared to the normal group, the spike firing rates on day 3 and 7 post-modeling were significantly higher, accompanied by a decreased firing interval. Power in both delta and theta bands exhibited an increasing trend, correlating with the duration of epilepsy. These findings offer valuable insights into the dynamic processes of striatal neural activity during the initial and latent phases of temporal lobe epilepsy and contribute to our understanding of the neural mechanisms underpinning epilepsy.
Keywords: PEDOT:PSS; graphene oxide; microelectrode arrays; striatum; temporal lobe epilepsy.
Copyright © 2024 Han, Wang, Jing, Yang, Liu, Mo, Xu, Luo, Jia, Zhu, Cao, Cai and Liu.
Conflict of interest statement
The authors declare that the research was conducted in the absence of any commercial or financial relationships that could be construed as a potential conflict of interest.
Figures


Similar articles
-
Chronic intracortical neural recordings using microelectrode arrays coated with PEDOT-TFB.Acta Biomater. 2016 Mar 1;32:57-67. doi: 10.1016/j.actbio.2015.12.022. Epub 2015 Dec 12. Acta Biomater. 2016. PMID: 26689462
-
SWCNTs/PEDOT:PSS nanocomposites-modified microelectrode arrays for revealing locking relations between burst and local field potential in cultured cortical networks.Biosens Bioelectron. 2024 Jun 1;253:116168. doi: 10.1016/j.bios.2024.116168. Epub 2024 Mar 1. Biosens Bioelectron. 2024. PMID: 38452571
-
PtNPs/PEDOT:PSS-Modified Microelectrode Arrays Reveal Electrophysiological Activities of Different Neurons in Medial Amygdala of Mice Under Innate Fear.Front Neurosci. 2022 May 10;16:868235. doi: 10.3389/fnins.2022.868235. eCollection 2022. Front Neurosci. 2022. PMID: 35620664 Free PMC article.
-
SWCNTs/PEDOT:PSS-Modified Microelectrode Arrays for Dual-Mode Detection of Electrophysiological Signals and Dopamine Concentration in the Striatum under Isoflurane Anesthesia.ACS Sens. 2021 Sep 24;6(9):3377-3386. doi: 10.1021/acssensors.1c01241. Epub 2021 Aug 19. ACS Sens. 2021. PMID: 34410704
-
Patternable Gelatin Methacrylate/PEDOT/Polystyrene Sulfonate Microelectrode Coatings for Neuronal Recording.ACS Biomater Sci Eng. 2022 Sep 12;8(9):3933-3943. doi: 10.1021/acsbiomaterials.2c00231. Epub 2022 Aug 17. ACS Biomater Sci Eng. 2022. PMID: 35976694
Cited by
-
PEDOT:PSS-based bioelectronics for brain monitoring and modulation.Microsyst Nanoeng. 2025 May 13;11(1):87. doi: 10.1038/s41378-025-00948-w. Microsyst Nanoeng. 2025. PMID: 40360495 Free PMC article. Review.
References
-
- Antoine D., Moshé S. L. (2002). The basal ganglia and the epilepsies: translating experimental concepts to new therapies. Epileptic Disord. 4, 7–8. - PubMed
-
- Cendes F. (2005). Mesial temporal lobe epilepsy syndrome: an updated overview. J. epilepsy Clin. Neurophysiol. 11, 141–144. 10.1590/S1676-26492005000300006 - DOI
LinkOut - more resources
Full Text Sources
Research Materials

